Abstract
The purpose of this work is to evaluate the quantitative parameters of magnetic resonance imaging (MRI), particularly diffusion-weighted imaging (DWI) and dynamic contrast enhancement (DCE) as well as positron-emission tomography, combined with computer tomography (PET/CT), with 18F-fluorodesoxyglucose, in the prediction of breast cancer molecular type. We studied the correlation between a set of parameters in the invasive ductal carcinoma of the breast, not otherwise specified (IDC-NOS) as it is the most common invasive breast tumor. The parameters were as follows: apparent diffusion coefficient (ADC) in DWI, positive enhancement integral (PEI) in DCE, maximum standardized uptake value (SUVmax) in 18F-FDG PET/CT, tumor size, grade, and Ki-67 index, level of lymph node metastatic lesions. We also evaluated the probability of a statistically significant difference in mean ADC, PEI, and SUVmax values for patient groups with different Nottingham prognostic index (NPI) and molecular tumor type. Statistically significant correlations between SUVmax, tumor size, and NPI, mean and minimal ADC values with Ki-67 and molecular tumor type were found. The PEI showed a correlation with the NPI risk level and was characterized by a relationship with the magnitude of the predicted NPI risk and regional lymph node involvement. The prognostic model created in our work allows for NPI risk group prediction. The SUVmax, ADC and PEI are non-invasive prognostic markers in the invasive breast cancer of no specific type. The correlation between ADC values and the expression of some tumor receptors can be used for in vivo molecular tumor type monitoring and treatment adjustment.
Keywords: Breast cancer, breast MRI, DWI, DCE, 18F-FDG PET/CT
Introduction
Breast tumors are heterogeneous diseases with different clinical manifestations, outcomes, and responses to therapy. The ability to predict the morphological properties of cancer at an early stage is crucial for treatment planning. The traditional prognostic factors for breast cancer include the size of the primary tumor, regional lymph node status, and tumor grade. Immunohistochemical prognostic factors include the expression of Ki-67, receptors for estrogen (ER), progesterone (PR), and human epidermal growth factor-2 (HER-2).
Diffusion-weighted imaging (DWI) and positron emission tomography (PET) with 18-fluorodeoxyglucose (18F-FDG) are functional imaging methods that allow the evaluation of the tumor’s biological properties [1]. The apparent diffusion coefficient (ADC) is a quantitative parameter allowing for tissue diffusion estimation. Generally, malignant tumors exhibit a significant diffusion restriction, which is inversely proportional to the nuclear-cytoplasmic ratio [2,3].
The positive enhancement integral (PEI) is a semi-quantitative parameter of tissue perfusion. Mathematically, PEI is an integral of the area under the curve, reflecting the concentration of a contrast medium at a certain point at a particular time [4]. Post-processing allows creating PEI color maps representing the level of tissue perfusion [5]. From a clinical point of view, PEI can be used as a criterion for perfusion assessment, allowing differentiation between benign and malignant processes in the breast and revealing a residual tumor after treatment [4].
PET, combined with computed tomography (CT) with 18F-FDG, detects hypermetabolism of breast tumor and is widely used for primary diagnosis, staging, and treatment response evaluation [6]. SUVmax is routinely used to quantify metabolism in PET/CT with FDG. Several studies describe a relationship between breast cancer immunohistochemical characteristics and ADC or SUVmax values [7]. Identifying the relationship between the quantitative parameters of the tumor and its histological structure will allow to better assess the heterogeneity of the tumor and its metastases. As it follows from this, approaches to breast cancer treatment can be improved.
Invasive ductal carcinoma of the breast, not otherwise specified (IDC-NOS) is the most common breast cancer subtype accounting for 56.4% of cases [8]. IDC-NOS combines lesions without distinctive pathological features characteristic of other breast tumors. The clinical and radiological diagnosis of IDC-NOS poses no small difficulties. However, the preoperative assessment of survival rate plays a significant role in treatment planning. Traditionally, the Nottingham prognostic index (NPI) is used for this assessment. NPI incorporates the data on tumor size, grade, and the number of metastatic lymph nodes [9].
Objective: to assess the relationship between SUVmax, ADC, PEI, and the immunohistochemical characteristics of ICD-NOS, such as Ki-67, receptor status (ER, PR, HER2), molecular tumor subtype per St. Gallen (2013), primary lesion size and grade, as well as with NPI prognostic groups.
Materials and methods
Our study is observational with data collection carried out from January 1, 2016, to August 1, 2018. Histological data were obtained from patients with IDC-NOS who underwent breast MRI with DWI and DCE and whole-body PET/CT with 18F-FDG. Inclusion criteria were as follows: treatment-naive IDC-NOS diagnosed by histological and immunohistochemical studies; final pathology report with data on tumor grade, Ki-67, receptor status (ER, PR, HER2), the number of metastatic lymph nodes; breast MRI with DWI and DCE plus whole-body PET/CT with 18F-FDG with an interim of less than 2 weeks; measurable quantitative parameters (ADC and PEI on breast MRI, SUVmax PEI on PET/CT). The average time from breast MRI to surgery was 15.05 ± 6.95 days. Sixty-four patients met the inclusion criteria.
Imaging
Breast MRI was performed on a 1.5 Tesla unit (Aera 4G, Siemens Medical Solutions, Erlangen, Germany), equipped with a dedicated radio frequency coil. The scan protocol included following pulse sequences: axial T2-weighted images (TSE, TR/TE 4530/93, FOV 320 mm, matrix size 576x403), axial diffusion-weighted images (b-values: 50, 800 s/mm2; TR/TE 9700/87, FOV 340 mm, matrix size 192 × 66 mm). For dynamic contrast enhancement, we used a routine three-dimensional T1-weighted gradient echo sequence with fat suppression (spectral attenuated inversion recovery) with TE/TR = 2/4.5 ms, flip angle = 180, matrix size 290 × 320 mm, FOV = 380 × 420 mm2. The contrast bolus (Gadovist 1.0 mmol/ml) was injected at a rate of 2-3 ml/s based on the peripheral venous access. One pre-contrast and six post-contrast series in axial plane were collected with a one-minute interval. Post-processing included PEI map generation.
A whole-body PET/CT with 18F-FDG was performed on Biograph Truepoint (Siemens Medical Solutions, Knoxville, TN) and Gemini TF (Philips, Cleveland) units. The data acquisition time ranged from 2 to 3 minutes per table position, dependent on the body mass index. 18F-FDG PET/CT was acquired at 1 hour after the tracer injection. The patients fasted at least 8 hours. The target blood glucose level was not more than 11 mmol/l. The dose of injected tracer was calculated on the weight of the body (approximately 6 MBq/kg), with a maximum dose of 450 MBq. During the subsequent 1 hour after injection, patients were sitting in a quiet room without talking. Matrix size was 128 × 128 with True X reconstruction for Biograph Truepoint system and 144 × 144 with LOR-TF-RAMLA reconstruction for Gemini TF. All patients were in a supine position during the scan with the study area from osteomeatal line to mid-thighs (130 kV, 50 mA/s, slice thickness 3 mm) with the arms above the head.
We analyzed ADC maps and PET images by manually selecting a region of interest (ROI freehand - Figure 1), excluding the areas of cystic transformation, tumor necrosis, and normal breast parenchyma. The measurements included mean and minimum ADC values (ADCmean, ADCmin), maximum SUV (SUVmax). In metastatic lesions, ADC and SUVmax were not measured.
Figure 1.
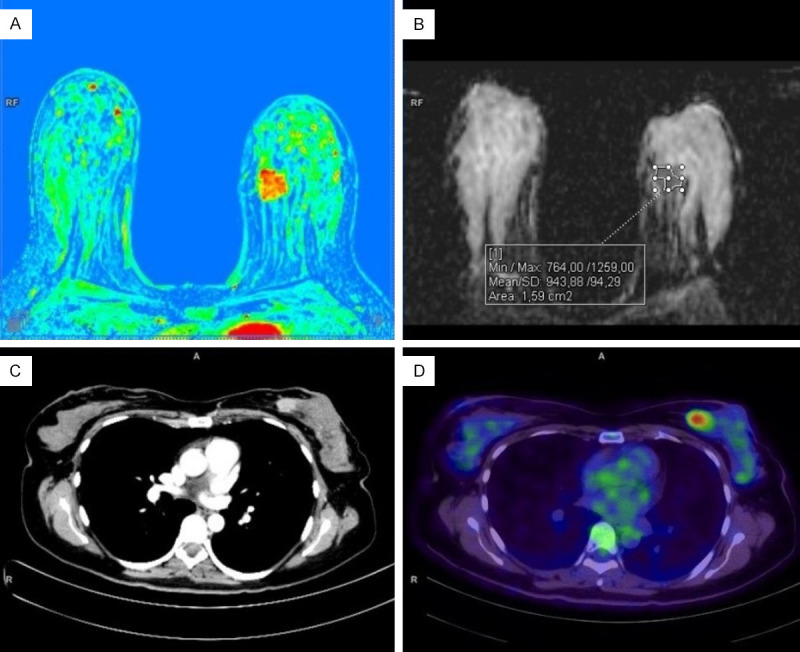
Breast MRI (upper row) and whole-body PET/CT with 18F-FDG (lower row) in a patient with invasive breast cancer. A. The perfusion map shows a hypervascular tumor in the inner quadrants of the left breast. B. ADC map with an example of freehand ROI placement. C. CT scan with intravenous contrast (iopamidol) - a component of combined PET/CT. D. A significant increase in tumor metabolism was detected via PET/CT with 18F-FDG.
Freehand ROI placement was also used for PEI color map analysis. We selected tumor region with the highest visual perfusion level. The second region of interest was automatically selected in the normal tissue of the contralateral breast. We normalized PEI values by calculating the tumor-to-normal contralateral breast ratio. The resulting coefficient was taken as the normalized PEI value [10].
Histological examination
We looked through postoperative pathology reports for Ki-67 level, tumor size and grade, receptor status (ER, PR, HER2neu), and the number of metastatic lymph nodes. The single largest dimension in the axial plane was used to estimate tumor size.
An immunohistochemical analysis determined tumor receptor status (estrogen, progesterone); more than 1% of stained nuclei was classified positive, regardless of the intensity of staining [11]. A “three plus” Hercept test result was considered positive for HER2/neu expression [12]. Main molecular subtypes of breast cancer were identified per St. Gallen Consensus (2013) [13].
We used the obtained data to calculate the NPI using the formula [0.2 × S] + N + G, whereas S is primary tumor size (cm), N is regional lymph node status (no metastatic lymph nodes -1 point, 1-4 nodes -2 points, more than 4 nodes - 3 points), G - tumor grade. Patients were assigned to groups with a good (2.0-3.4 points), moderate (3.41-5.4) or poor (> 5.4) survival prognosis [14].
Statistical analysis
To assess the role of quantitative MRI and PET/CT as survival predictors in IDC-NOS, we evaluated the statistically significant differences between ADCmean, ADCmin, SUVmax, and PEI in different NPI prognostic groups. Additionally, we compared the average tumor ADCmean, ADCmin, SUVmax, and PEI by the primary tumor grade and the number of metastatic lymph nodes. Statistical processing was performed using IBM SPSS Statistics (version 23).
Results
The cohort included 64 patients with IDC-NOS aged from 27 to 76 years, average -54.1 ± 12.7 years. We conducted 128 studies and compared quantitative parameters of lesion metabolism (SUVmax), diffusion (ADCmean and ADCmin), and perfusion (PEI) with tumor size, Ki-67, and NPI using Spearman’s correlation coefficient (Table 1).
Table 1.
Correlation analysis of PET and MRI quantitative parameters with the tumor size, Ki-67, and NPI
| Parameter | Correlation characteristics (ρ-Spearman’s correlation coefficient, p-level of significance) | |||||
|---|---|---|---|---|---|---|
|
| ||||||
| Tumor size | Ki-67 | NPI | ||||
|
|
|
|
||||
| ρ | p | ρ | p | ρ | p | |
| SUVmax | 0.46 | < 0.001* | 0.151 | 0.234 | 0.326 | 0.009* |
| ADCmean | 0.143 | 0.258 | -0.366 | 0.003* | -0.021 | 0.869 |
| ADCmin | -0.002 | 0.985 | -0.413 | 0.001* | -0.166 | 0.19 |
| PEI | 0.133 | 0.294 | 0.115 | 0.365 | 0.313 | 0.012* |
- statistically significant (P < 0.05).
The data analysis indicated a direct statistically significant correlation of moderate closeness between tumor size and SUVmax (ρ = 0.46; P < 0.001). The studied quantitative parameters of MRI did not show a statistically significant correlation with tumor size (P > 0.05).
We also compared Ki-67 level with DWI, observing a statistically significant inverse correlations of moderate crowding for ADC, both medium and minimal (ρ = -0.366; P = 0.003 and ρ = -0.413; P = 0.001, respectively). The correlation analysis between NPI and quantitative MRI and PET established statistically significant direct associations of moderate crowding for SUVmax (ρ = 0.326, P = 0.009) and PEI (ρ = 0.313, P = 0.012). Then, we compared quantitative MRI and PET parameters based on the NPI prognostic group (Table 2). We found statistically significant differences between SUVmax and PEI, depending on the NPI prognostic group (P = 0.007 and P = 0.006, respectively).
Table 2.
Comparison of MRI and PET parameters based on patient’s NPI prognostic group
| Parameter | NPI group | P | |||||
|---|---|---|---|---|---|---|---|
|
| |||||||
| Low | Medium | High | |||||
|
|
|
|
|||||
| Me | Q1-Q3 | Me | Q1-Q3 | Me | Q1-Q3 | ||
| SUVmax | 3.61 | 2.3-7.62 | 7.67 | 5.3-13.2 | 9.2 | 5.65-13.34 | 0.007* |
| ADCmean | 844 | 794-921 | 837.5 | 741-957 | 816 | 706.5-887.5 | 0.428 |
| ADCmin | 464.5 | 273-538 | 398 | 302-476 | 335.5 | 273.5-435 | 0.178 |
| PEI | 7.27 | 3.91-8.47 | 6.93 | 4.14-11.11 | 10.55 | 7.79-17.41 | 0.006* |
- statistically significant (P < 0.05).
In a posteriori comparisons of SUVmax and NPI prognostic groups, we observed statistically significant higher levels in a high risk (P = 0.009) and medium risk (P = 0.012) groups, compared with a low-risk cohort. The differences between the SUVmax of medium and high-risk groups were not statistically significant (P = 0.815). SUVmax values in different NPI prognostic groups are presented in Figure 2.
Figure 2.
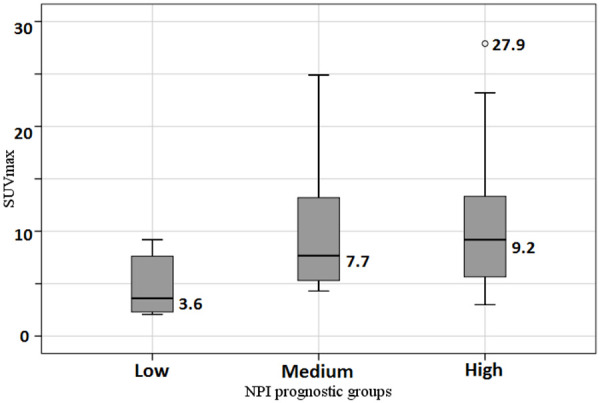
Comparison of SUVmax in different NPI prognostic groups.
A PEI-based paired comparison of prognostic groups identified statistically significant differences between low and high-risk NPI groups (P = 0.012). We also noted close-to-critical differences between PEI and NPI in medium and high-risk groups (P = 0.052). In both cases, we observed higher PEI values in the high-risk NPI group. The differences between low and medium risk groups were not statistically significant (P = 0.698). Figure 3 illustrates the relationship between PEI and NPI risk group. We compared studied quantitative PET and MRI with tumor grade (Table 3). We did not observe statistically significant differences between MRI and PET data and tumor grade (P > 0.05 in all cases).
Figure 3.
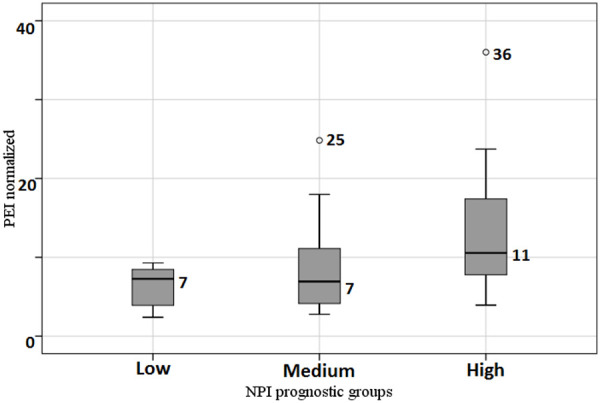
Comparison of PEI in different NPI prognostic groups.
Table 3.
Comparison of quantitative PET and MRI parameters with tumor grade
| Parameter | Tumor grade | P | |||||
|---|---|---|---|---|---|---|---|
|
| |||||||
| Grade 1 | Grade 2 | Grade 3 | |||||
|
|
|
|
|||||
| Me | Q1-Q3 | Me | Q1-Q3 | Me | Q1-Q3 | ||
| SUVmax | 5.0 | 4.6-7.15 | 6.79 | 4.7-11.64 | 9.2 | 5.5-14.9 | 0.097 |
| ADCmean | 877.5 | 829-910.5 | 829.5 | 748-932 | 829 | 720-939 | 0.711 |
| ADCmin | 472.5 | 415.5-520 | 390.5 | 293-476 | 372.5 | 276-438 | 0.262 |
| PEI | 8.67 | 7.21-9.99 | 8.45 | 5.05-12.64 | 9.12 | 5.14-10.99 | 0.999 |
* - statistically significant (P < 0.05).
We also compared the studied diagnostic parameters and regional lymph node status (Table 4). As per Table 4, there were statistically significant differences in the ADCmin and PEI ratio depending on regional lymph node status (P = 0.019 and P = 0.013, respectively).
Table 4.
Comparison of quantitative PET and MRI parameters with regional lymph node status
| Parameter | Regional lymph node status per NPI | P | |||||
|---|---|---|---|---|---|---|---|
|
| |||||||
| 1 | 2 | 3 | |||||
|
|
|
|
|||||
| Me | Q1-Q3 | Me | Q1-Q3 | Me | Q1-Q3 | ||
| SUVmax | 6.39 | 4.6-10.47 | 9.55 | 5.9-13.74 | 6.74 | 4.83-12.4 | 0.182 |
| ADCmean | 832.5 | 755-926.5 | 834.5 | 712-941 | 831 | 769-912 | 0.959 |
| ADCmin | 425 | 306-529 | 305.5 | 267-398 | 391.5 | 310-472 | 0.019* |
| PEI | 6.89 | 3.83-10.76 | 9.17 | 5.95-12.09 | 10.55 | 7.17-18.51 | 0.013* |
- statistically significant (P < 0.05).
In a posteriori comparisons of ADCmin, we observed statistically significant differences between the first and second degrees of regional lymph node involvement (P = 0.016). The latter had lower ADCmin values. Pairwise comparisons of PEI ratio and regional lymph node status detected statistically significant differences between first and third degrees with PEI median values of 6.89 and 10.55, respectively (P = 0.011).
Comparison between quantitative MRI and PET parameters and tumor receptor status did not reveal any statistically significant differences (P > 0.05). However, the comparison of evaluated diagnostic indicators and molecular tumor type yielded the following results (Table 5). As per Table 5, we observed statistically significant differences in ADCmean and ADCmin depending on molecular tumor type (P = 0.013 and P = 0.048).
Table 5.
Comparison of quantitative PET and MRI parameters with molecular tumor type
| Parameter | Molecular tumor type | P | |||||||
|---|---|---|---|---|---|---|---|---|---|
| HER2+ | Luminal A | Luminal B | Triple negative | ||||||
|
|
|
|
|
||||||
| Me | Q1-Q3 | Me | Q1-Q3 | Me | Q1-Q3 | Me | Q1-Q3 | ||
| SUVmax | 7.5 | 5.4-9.2 | 4.62 | 4.35-7.44 | 8.4 | 5.17-13.14 | 10.2 | 5.8-13.6 | 0.278 |
| ADCmean | 937 | 796.5-1102 | 957 | 926.5-1005 | 821.5 | 729.5-871.5 | 782 | 720-913 | 0.013* |
| ADCmin | 393 | 382-525.5 | 446 | 426.5-525 | 364 | 287.5-472 | 276 | 252-389 | 0.048* |
| PEI | 8.78 | 5.29-17.0 | 6.46 | 5.03-8.63 | 9.17 | 5.86-12.28 | 7.1 | 4.63-12.09 | 0.709 |
- statistically significant (P < 0.05).
In a posteriori comparison showed that ADCmean for the Luminal A tumor type was significantly higher than for the Luminal B (P = 0.02) and Triple negative (P = 0.039) types. The differences were not statistically significant with Luminal A and HER2+ tumor types (P = 0.444). The values of ADCmean depending on molecular tumor type are compared in Figure 4. In pairwise comparisons of the ADCmin for different molecular tumor types, we observed close-to-critical differences for Luminal A and triple negative types (P = 0.053).
Figure 4.
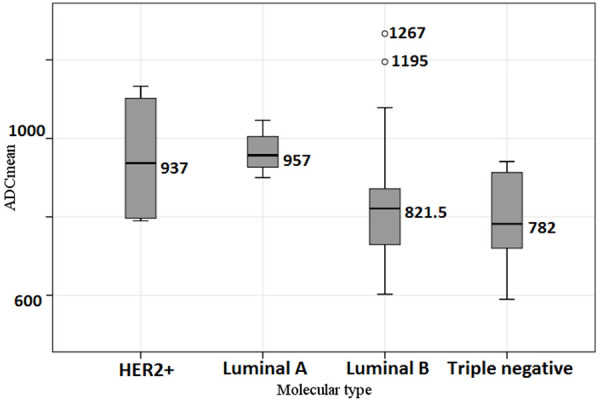
Comparison of the ADCmean depending on molecular tumor type.
Thus, we noted statistically significant correlations of SUVmax with tumor size and NPI, ADCmean and ADCmin with the Ki-67 level and molecular tumor types, ADCmin with the degree regional lymph nodes involvement. NPI risk group and regional lymph node status correlated with PEI ratio.
Construction of prognostic models for molecular tumor type and NPI risk group differentiation
Accounting for the identified differences in MRI and PET parameters depending on the NPI group, we developed a prognostic model for calculating the probability of a patient assignment to a specific risk group. For this purpose, a method of discriminant analysis was used, where the classification criterion was set as belonging to one of the three NPI risk groups, and the MRI and PET parameters under evaluation as independent factors. By reviewing all possible combinations of diagnostic parameters, it was established that the best model was the one that included all of them without exception. We assessed the proportion of patients from the studied sample correctly classified into risk groups as a key performance indicator of the predictive model.
The predictive model consisted of two discriminant functions.
Function 1 took the following form (1):
F1 = 0.229 + 0.126 * XPEI + 0.099 * XSUV - 0.002 * XADCmean - 0.001 * XADCmin (1)
Function 2 took the following form (2):
F2 = -1.851 - 0.074 * XPEI + 0.157 * XSUV + 0.003 * XADCmin (2)
whereas F1 is the discriminant function 1, F2 is the discriminant function 2, XPEI is the PEI value, XSUV is the SUVmax value, XADCmean is the mean ADC value, XADCmin is the minimum ADC value.
Our predictive model was statistically significant (P = 0.015). Function 1 showed moderate correlation (r = 0.48) with NPI risk group while function 2 demonstrated weak correlation (P = 0.237).
We calculated a territorial map for more accurate patient risk stratification (Figure 5). Discriminant function value calculation determines the coordinates of a single point (F1; F2). Lower left sector indicates low-risk group, middle-upper area - medium risk group, lower right sector - to the high-risk group per NPI.
Figure 5.
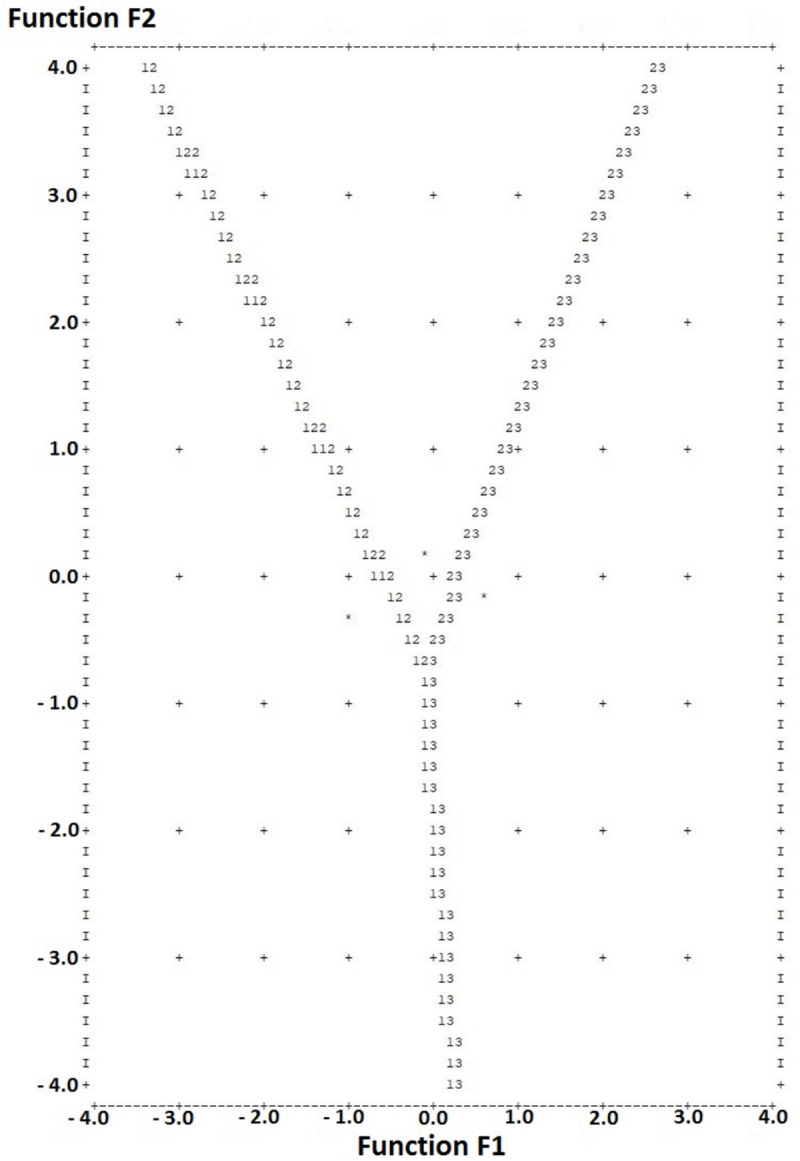
Territorial map for NPI risk group classification depending on the parameters of MRI and PET. Discriminant function value calculation (in text) determines the coordinates of a single point (F1; F2). Lower left sector indicates low-risk group, middle-upper area - medium risk group, lower right sector - to the high-risk group per NPI.
Sensitivity assessment showed that patients from the low-risk group were correctly classified in 80.0% of cases. For the high-risk group, this value was 62.5%. The prognostic model had the worst sensitivity for the medium-risk group, in which only 36.7% of patients were correctly classified (33.3% were assigned to the low-risk group, and 30.0% to the high-risk group).
We grouped tumors into two categories to determine the prognostic efficacy of quantitative MRI and PET for molecular tumor type prediction. HER2+ and Luminal A tumors comprised the first group, Luminal B and Triple negative - the second group. The analysis did not reveal statistically significant models for these molecular tumor types.
ROC analysis of the probability that a tumor belongs to one of the two groups based on the investigated diagnostic parameters resulted in two statistically significant models for the mean and minimum ADC (P = 0.002 and P = 0.013, respectively). The ROC curve characterizing the dependence of the probability that a tumor belongs to the Luminal A and HER2+ types on ADCmean is presented in Figure 6. The area under curve was 0.805 ± 0.066 (95% CI: 0.677-0.934). The ADCmean cut-off value was 892 mm2/s with equal to or higher values predictive of Luminal A or HER2+, and values below 892 predictive of Luminal B or Triple negative molecular types. The sensitivity of the model was 81.8%, specificity -77.4%.
Figure 6.
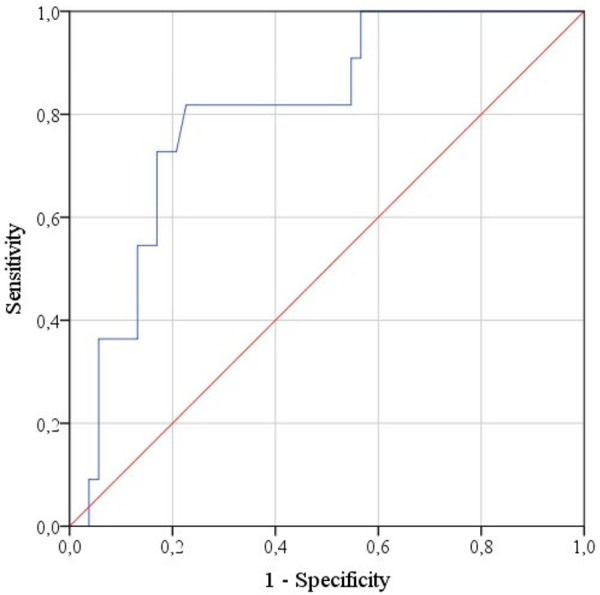
ROC curve characterizing the dependence of the probability that a tumor belongs to the Luminal A and HER2+ types on ADCmean.
Figure 7 shows the ROC curve characterizing the dependence of the probability that a tumor belongs to the Luminal A and HER2+ types on ADCmin. The area under curve was 0.738 ± 0.066 (95% CI: 0.609-0.867). The ADCmin cut-off value was 396 mm2/s with equal to or higher values predictive of Luminal A or HER2+, and values below 396 predictive of Luminal B or Triple negative molecular types. The sensitivity of the model was also 81.8%, specificity -60.4%.
Figure 7.
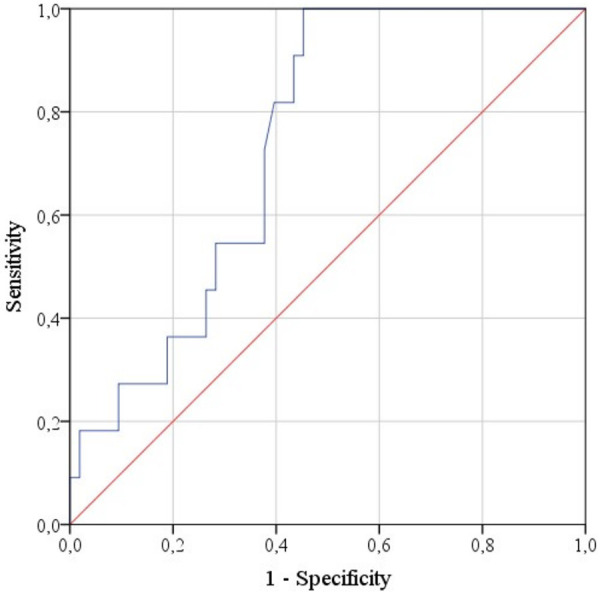
ROC curve characterizing the dependence of the probability that a tumor belongs to the Luminal A and HER2+ types on ADCmin.
Finally, we constructed a prognostic model using binary logistic regression. The model classified the subjects into different categories with certain molecular tumor types based on quantitative MRI and PET data. We used elimination for the selection of statistically significant factors with resultant regression function (3).
P = 1/(1+e-z) * 100%
z = -10.79 - 0.211 * XSUV + 0.011 * XADCmean + 0.003 * XADCmin (3)
whereas P is the probability of a tumor being Luminal A or HER2+ types (%); XSUV - the SUVmax value, XADCmean - the ADCmean value (mm2/s), XADCmin - the ADCmin value (mm2/s).
The regression model was statistically significant (P < 0.001). Per Nagelkerke’s R2, the model (3) accounted for up to 40.9% of the factors determining molecular tumor type.
Per regression coefficients, the increase in SUVmax value was accompanied by a decrease in the probability of the tumor be-longing to one of the molecular types - Luminal A or HER2+, and the increase in mean and minimum ADC values - by an increase in said probability. Using the odds ratio for each of the prognostic model factors (8), SUVmax increase by 1 reduced the chances of tumor assignment to the molecular type Luminal A or HER2+ by 19%, the mean ADC increase by 1 mm2/s raised the chances of tumor assignment to the above types by 1.1%, and the minimum ADC value increase - by 0.3%.
ROC analysis was used to determine the optimal separating value of the logistic function P, allowing patient classification into groups with various molecular tumor types (Figure 8).
Figure 8.
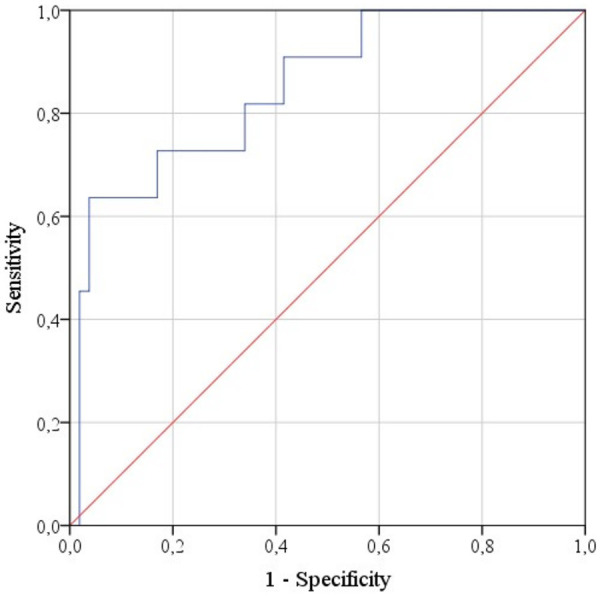
ROC curve characterizing the dependence of the probability that a tumor belongs to the Luminal A and HER2+ types on the value of P function.
The area under the curve was 0.849 ± 0.063 (95% CI: 0.725-0.973). The cut-off value was 23%, with P values equal to or greater than 23% indicative of HER2+ or Luminal A and lower values implying Luminal B or Triple negative types. The sensitivity of the prognostic model was 72.7%, specificity -83%.
The diagnostic efficiency of the regression model (3) is comparable to the single-factor prognostic model mentioned above (ADCmean-based tumor molecular group estimation), suggesting that for accurate patient classification, there is no need to account for a large number of MRI and PET parameters. The ADCmean alone should be sufficient to predict the tumor type as HER2+ or Luminal A.
Discussion
The relationship between ADC, SUVmax, PEI and prognostic factors
We measured ADCmin and ADCmean using b-factors of 50, 800 s/mm2. High b-factors eliminated the perfusion effect in DWI [15]. According to the literature, ADC is inversely proportional to the nuclear-cytoplasmic ratio of tumor cells [3,13], which is an essential indicator of tumor grade [10].
In his work, Kim et al. [1] did not find a correlation between ADC and various prognostic factors, including age, tumor size, and grade, regional lymph node involvement, receptor status. On the other hand, Razek et al. [16] report that mean ADC values of invasive breast cancer are significantly lower in patients with high-grade and large tumors, as well as metastases to regional lymph nodes. The results obtained in our work are consistent with the findings of Choi et al. [17] on the statistical relationship between Ki-67 and ADC values in IDC, and Razek et al. [16] on the correlation between ADC and regional lymph node status.
Discrepancies between our findings and results of Kim et al. (ADC and lymph node status), Razek et al. (ADC and tumor size/grade) may be associated, first of all, with differences in the histological structure of the tumor and ADC measurement methodology. In particular, Kim et al. used the average of three different ROIs with an area of 10 ± 2 mm2; Razek et al. used other b-factors (200 and 400 mm2/s). Manual ROI placement and ADCmin measurement were not used in these two publications. One should keep in mind that scanner characteristics and protocol parameters vary significantly, which leads to incomparable ADC values.
Although we did not observe any statistically significant correlation between the receptor expression and ADC values, ADCmean was significantly higher in Luminal A tumors than in Luminal B (P = 0.02) and Triple negative (P = 0.039). For Luminal A and HER2+ tumor types, the correlations with ADCmean were not statistically significant (P = 0.444). Incoronato et al. [18] reported a correlation between the absence of progesterone receptors and high mean ADC values. These results are contradicting the available data [19,20]. On the other hand, Incoronato et al. observed the correlation between mean ADC and molecular tumor type.
A direct correlation of moderate closeness was observed between the quantitative values of SUVmax and NPI. Also, the average SUVmax values in medium and high NPI risk groups demonstrated a statistically significant difference compared to the low-risk group with higher SUVmax, indicating the worst prognosis.
Many publications confirm this pattern. Ikenaga et al. reported that a primary breast tumor with a SUVmax greater than 4.0 has had a higher recurrence rate compared to tumors with a low metabolism (P < 0.0001) [7]. Tumor metabolism, reflected by 18F-FDG uptake in PET/CT and expressed as SUVmax, was higher in large-sized tumors, which correlates with the studies mentioned above. At the same time, one cannot exclude the overestimation of SUVmax with a larger volume [1].
We did not observe any relationship between SUVmax and receptor status or molecular tumor type, contrary to available data [18,21-23].
The observed negative correlation between ADCmin and SUVmax is in line with the results of Nakajo et al. [7]. The uptake of 18F-FDG reflects the metabolic activity of the tumor; ADC is a quantitative parameter of diffusion restriction. According to the available publications, an increase in tumor grade is accompanied by a pronounced diffusion restriction [15].
The PEI is a quantitative parameter of tissue perfusion [4]. The difference in perfusion of a tumor and unchanged parenchyma is a well-known diagnostic parameter based reflecting stromal vascular component and cancer angiogenesis [24]. PEI is easy to implement and is available in most viewing applications. PEI is dependent on the speed and volume of administration of the contrast agent, therefore, normalization should be utilized.
At the time of writing, the only available publication covering PEI as a quantitative diagnostic parameter in breast cancer was done by Nadrljanski et al. [10]. The authors performed, the normalization of PEI via the perfusion of unchanged parenchyma in the contralateral breast. The medians of normalized PEI for ductal carcinoma in situ (DCIS) and invasive ductal carcinoma (IDC) differed significantly.
We found the correlation between PEI and NPI quantitative values, NPI risk groups, 1st and 3rd degree of lymph node involvement by NPI. No statistically significant correlation was observed between PEI values and receptor status, as well as the molecular tumor type. In their work Incoronato et al. evaluated quantitative indicators of perfusion, such as Ktrans, Kep, Ve, and prognostic factors of breast cancer. The use of Ktransmax made it possible to differentiate the Luminal A type from HER2+ and triple negative; a correlation was found between perfusion values and expression of individual receptors. Other literature sources confirm the link between Kepmax and tumor grade [25], as well as a high proliferation index (Ki-67 > 20%) [26].
Predictive model generation
Despite many successful studies on the relationship of quantitative MRI and PET/CT with prognostic criteria for breast cancer [27,28,6], so far there have been no attempts to create a predictive model of NPI risk groups based on ADC, SUVmax and PEI.
The prognostic model created in our work allows for NPI risk group prediction and is based on quantitative radiological parameters (SUVmax, PEI, ADCmean, and ADCmin). The model demonstrates the highest accuracy (80.0%) in identifying low-risk NPI group; patients were correctly classified as high-risk in 62.5% of cases.
The regression-based diagnostic model accounts for SUVmax, ADCmin, and ADCmean and estimates the probability of tumor being Luminal A or HER2+ with a sensitivity of 72.7%, a specificity of 83%; the area under the curve was 0.849 ± 0.063 (95% CI: 0.725-0.973). The work of Incoronato et al. featured a multifactorial predictive model incorporating Ktransmax and SUVmax; highest accuracy was achieved for Luminal B subtype (86.2%). At the same time, they also observed a relationship between tumor molecular markers (Luminal A and HER2+) with relatively low SUVmax values.
Apart from the created diagnostic model, we observed a higher predictive accuracy (sensitivity 81.8%, specificity 77.4%) with only ADCmean. If the value is above 892 mm2/s, the tumor will be classified as Luminal A or HER2+. ADC allows evaluating the tumor’s biological properties based on its microstructure and intercellular density. The pattern we observed is reinforced by observations of Youk [29] and Incoronato [18], where ADCmean predicted Luminal B molecular type with an accuracy of 87.7%. Thus, the hypothesis on the relationship between a decrease in tumor metabolism, an increase in diffusion and better prognosis was confirmed.
Study limitations
The limitations primarily concern study design. It was observational with data only on IDC-NOS. MRI and PET/CT were assessed by a single radiologist, which could affect the evaluation and measurements in both modalities. The sample size is small with the non-uniform distribution of molecular tumor subtypes. Two-dimensional regions of interest are another limitation as volumetric measurements allow for a more accurate assessment of the tumor’s quantitative parameters. However, 3D ROI measurement is unavailable on most clinical DICOM viewer applications.
Conclusion
The possibility of using quantitative parameters from imaging studies to determine the prognosis and molecular subtype in breast cancer is of great interest to oncologists. However, this approach will not receive clinical acceptance in the absence of a sufficient number of publications. Some discordance in available results can be explained by the complexity of the relationship between prognostic biological factors and quantitative imaging parameters. However, it is impossible not to point out some general patterns. Tumors with low ADC, PEI, and SUVmax values have a better prognosis, which is explained by their higher differentiation, a lesser degree of angiogenesis, and decreased metabolism.
The results of our work show that a comprehensive assessment of the quantitative imaging parameters of the primary breast tumor, including metabolism (PET), diffusion and perfusion (MRI) can reliably predict the NPI risk group. In particular, the proposed model predicts a low-risk group with an accuracy of 80.0%, and to a high-risk group -62.5%. The average ADC value can differentiate molecular tumor type with a sensitivity of 81.8% and a specificity of 77.4%.
Diagnostic accuracy is strictly related to the sample size, which must exceed hundreds of observations for each molecular subtype. Nevertheless, our results suggest the possible role of routine breast MRI with DWI and DCE as well as 18F-FDG PET/CT in clinical practice for diagnostic and prognostic purposes. Although SUVmax, ADC, and PEI as in vivo survival markers cannot yet replace biopsy, their role in follow-up imaging is of interest, especially for timely diagnosis of tumor mutations requiring further adjustments to treatment. To this end, additional research is needed with a more uniform and larger sample, as well as the creation of standardized protocols for breast MRI and 18F-FDG PET/CT.
Disclosure of conflict of interest
None.
Abbreviations
- MRI
magnetic resonance imaging
- DWI
diffusion weighted imaging
- DCE
dynamic contrast enhancement
- IDC-NOS
invasive ductal carcinoma of the breast, not otherwise specified
- 18F-FDG
18F-fluorodesoxyglucose
- ADC
apparent diffusion coefficient
- PEI
positive enhancement integral
- SUVmax
maximum standardized uptake value
- NPI
Nottingham prognostic index
- ER
estrogen receptor
- PR
progesterone receptor
- HER2
human epidermal growth factor-2
- ROI
region of interest
- DICOM
digital imaging and communications in medicine
References
- 1.Kim SH, Cha ES, Kim HS, Kang BJ, Choi JJ, Jung JH, Park YG, Suh YJ. Diffusion-weighted imaging of breast cancer: correlation of the apparent diffusion coefficient value with prognostic factors. J Magn Reson Imaging. 2009;30:615–620. doi: 10.1002/jmri.21884. [DOI] [PubMed] [Google Scholar]
- 2.Ho KC, Lin G, Wang JJ, Lai CH, Chang CJ, Yen TC. Correlation of apparent diffusion coefficients measured by 3T diffusion-weighted MRI and SUV from FDG PET/CT in primary cervical cancer. Eur J Nucl Med Mol Imaging. 2008;36:200–208. doi: 10.1007/s00259-008-0936-5. [DOI] [PubMed] [Google Scholar]
- 3.Jeh SK, Kim SH, Kim HS, Kang BJ, Jeong SH, Yim HW, Song BJ. Correlation of the apparent diffusion coefficient value and dynamic magnetic resonance imaging findings with prognostic factors in invasive ductal carcinoma. J Magn Reson Imaging. 2010;33:102–109. doi: 10.1002/jmri.22400. [DOI] [PubMed] [Google Scholar]
- 4.Khiat A, Gianfelice D, Amara M, Boulanger Y. Influence of post-treatment delay on the evaluation of the response to focused ultrasound surgery of breast cancer by dynamic contrast enhanced MRI. Br J Radiol. 2006;79:308–314. doi: 10.1259/bjr/23046051. [DOI] [PubMed] [Google Scholar]
- 5.Third International Congress on MR-mammography, 25-27 September 2003, Jena, Germany - Abstracts. Eur Radiol. 13:D1–D86. [PubMed] [Google Scholar]
- 6.Nakajo M, Kajiya Y, Kaneko T, Kaneko Y, Takasaki T, Tani A, Ueno M, Koriyama C, Nakajo M. FDG PET/CT and diffusion-weighted imaging for breast cancer: prognostic value of maximum standardized uptake values and apparent diffusion coefficient values of the primary lesion. Eur J Nucl Med Mol Imaging. 2010;37:2011–2020. doi: 10.1007/s00259-010-1529-7. [DOI] [PubMed] [Google Scholar]
- 7.Ikenaga N, Otomo N, Toyofuku A, Ueda Y, Toyoda K, Hayashi T, Nishikawa K, Tanaka M. Standardized uptake values for breast carcinomas assessed by fluorodeoxyglucose-positron emission tomography correlate with prognostic factors. Am Surgeon. 2007;73:1151–7. [PubMed] [Google Scholar]
- 8.Rakha EA, Reis-Filho JS, Ellis IO. Basal-like breast cancer: a critical review. J. Clin. Oncol. 2008;26:2568–2581. doi: 10.1200/JCO.2007.13.1748. [DOI] [PubMed] [Google Scholar]
- 9.Haybittle JL, Blamey RW, Elston CW, Johnson J, Doyle PJ, Campbell FC, Nicholson RI, Griffiths K. A prognostic index in primary breast cancer. Br J Cancer. 1982;45:361–6. doi: 10.1038/bjc.1982.62. [DOI] [PMC free article] [PubMed] [Google Scholar]
- 10.Nadrljanski M, Maksimović R, Plešinac-Karapandžić V, Nikitović M, Marković-Vasiljković B, Milošević Z. Positive enhancement integral values in dynamic contrast enhanced magnetic resonance imaging of breast carcinoma: Ductal carcinoma in situ vs. invasive ductal carcinoma. Eur J of Radiol. 2014;83:1363–1367. doi: 10.1016/j.ejrad.2014.05.006. [DOI] [PubMed] [Google Scholar]
- 11.Umekita Y, Souda M, Ohi Y, Rai Y, Sagara Y, Sagara Y, Yoshida H. Expression of estrogen receptor alpha and progesterone receptor in normal human breast epithelium. In Vivo. 2007;21:535–9. [PubMed] [Google Scholar]
- 12.Umekita Y, Souda M, Ohi Y, Sagara Y, Rai Y, Takahama T, Yoshida H. Expression of wild-type estrogen receptor β protein in human breast cancer: Specific correlation with HER2/neu overexpression. Pathol Int. 2006;56:423–427. doi: 10.1111/j.1440-1827.2006.01983.x. [DOI] [PubMed] [Google Scholar]
- 13.Goldhirsch A, Winer EP, Coates AS, Gelber RD, Piccart-Gebhart M, Thürlimann B, Senn HJ, Albain KS, André F, Bergh J, Bonnefoi H, Bretel-Morales D, Burstein H, Cardoso F, Castiglione-Gertsch M, Coates AS, Colleoni M, Costa A, Curigliano G, Davidson NE, Di Leo A, Ejlertsen B, Forbes JF, Gelber RD, Gnant M, Goldhirsch A, Goodwin P, Goss PE, Harris JR, Hayes DF, Hudis CA, Ingle JN, Jassem J, Jiang Z, Karlsson P, Loibl S, Morrow M, Namer M, Kent Osborne C, Partridge AH, Penault-Llorca F, Perou CM, Piccart-Gebhart MJ, Pritchard KI, Rutgers EJT, Sedlmayer F, Semiglazov V, Shao ZM, Smith I, Thürlimann B, Toi M, Tutt A, Untch M, Viale G, Watanabe T, Wilcken N, Winer EP, Wood WC. Personalizing the treatment of women with early breast cancer: highlights of the St Gallen International Expert Consensus on the Primary Therapy of Early Breast Cancer 2013. Ann Oncol. 2013;24:2206–2223. doi: 10.1093/annonc/mdt303. [DOI] [PMC free article] [PubMed] [Google Scholar]
- 14.Rakha EA, Soria D, Green AR, Lemetre C, Powe DG, Nolan CC, Garibaldi JM, Ball G, Ellis IO. Nottingham Prognostic Index Plus (NPI+): a modern clinical decision making tool in breast cancer. Br J Cancer. 2014;110:1688–1697. doi: 10.1038/bjc.2014.120. [DOI] [PMC free article] [PubMed] [Google Scholar]
- 15.Sinha S, Lucas-Quesada FA, Sinha U, DeBruhl N, Bassett LW. In vivo diffusion-weighted MRI of the breast: potential for lesion characterization. J Magn Reson Imaging. 2002;15:693–704. doi: 10.1002/jmri.10116. [DOI] [PubMed] [Google Scholar]
- 16.Razek AA, Gaballa G, Denewer A, Nada N. Invasive ductal carcinoma: correlation of apparent diffusion coefficient value with pathological prognostic factors. NMR Biomed. 2010;23:619–623. doi: 10.1002/nbm.1503. [DOI] [PubMed] [Google Scholar]
- 17.Choi SY, Chang YW, Park HJ, Kim HJ, Hong SS, Seo DY. Correlation of the apparent diffusion coefficiency values on diffusion-weighted imaging with prognostic factors for breast cancer. Br J Radiol. 2012;85:474–479. doi: 10.1259/bjr/79381464. [DOI] [PMC free article] [PubMed] [Google Scholar]
- 18.Incoronato M, Grimaldi AM, Cavaliere C, Inglese M, Mirabelli P, Monti S, Ferbo U, Nicolai E, Soricelli A, Catalano OA, Aiello M, Salvatore M. Relationship between functional imaging and immunohistochemical markers and prediction of breast cancer subtype: a PET/MRI study. Eur J Nucl Med Mol Imaging. 2018;45:1680–1693. doi: 10.1007/s00259-018-4010-7. [DOI] [PubMed] [Google Scholar]
- 19.Park SH, Choi HY, Hahn SY. Correlations between apparent diffusion coefficient values of invasive ductal carcinoma and pathologic factors on diffusion-weighted MRI at 3.0 Tesla. J Magn Reson Imaging. 2013;41:175–182. doi: 10.1002/jmri.24519. [DOI] [PubMed] [Google Scholar]
- 20.Lee HS, Kim SH, Kang BJ, Baek JE, Song BJ. Perfusion parameters in dynamic contrast-enhanced MRI and apparent diffusion coefficient value in diffusion-weighted MRI: association with prognostic factors in breast cancer. Acad Radiol. 2016;23:446–456. doi: 10.1016/j.acra.2015.12.011. [DOI] [PubMed] [Google Scholar]
- 21.Koo HR, Park JS, Kang KW, Cho N, Chang JM, Bae MS, Kim WH, Lee SH, Kim MY, Kim JY, Seo M, Moon WK. 18F-FDG uptake in breast cancer correlates with immunohistochemically defined subtypes. Eur Rad. 2013;24:610–618. doi: 10.1007/s00330-013-3037-1. [DOI] [PubMed] [Google Scholar]
- 22.Kitajima K, Fukushima K, Miyoshi Y, Nishimukai A, Hirota S, Igarashi Y, Katsuura T, Maruyama K, Hirota S. Association between 18F-FDG uptake and molecular subtype of breast cancer. Eur J Nucl Med Mol Imaging. 2015;42:1371–1377. doi: 10.1007/s00259-015-3070-1. [DOI] [PubMed] [Google Scholar]
- 23.Miyake KK, Nakamoto Y, Kanao S, Tanaka S, Sugie T, Mikami Y, Toi M, Togashi K. Diagnostic value of18F-FDG PET/CT and MRI in predicting the clinicopathologic subtypes of invasive breast cancer. Am J of Roentgenol. 2014;203:272–279. doi: 10.2214/AJR.13.11971. [DOI] [PubMed] [Google Scholar]
- 24.Gasparini G, Harris AL. Clinical importance of the determination of tumor angiogenesis in breast carcinoma: much more than a new prognostic tool. J. Clin. Oncol. 1995;13:765–782. doi: 10.1200/JCO.1995.13.3.765. [DOI] [PubMed] [Google Scholar]
- 25.Koo HR, Cho N, Song IC, Kim H, Chang JM, Yi A, Yun BL, Moon WK. Correlation of perfusion parameters on dynamic contrast-enhanced MRI with prognostic factors and subtypes of breast cancers. J Magn Reson Imaging. 2012;36:145–151. doi: 10.1002/jmri.23635. [DOI] [PubMed] [Google Scholar]
- 26.Catalano OA, Horn GL, Signore A, Iannace C, Lepore M, Vangel M, Luongo A, Catalano M, Lehman C, Salvatore M, Soricelli A, Catana C, Mahmood U, Rosen BR. PET/MR in invasive ductal breast cancer: correlation between imaging markers and histological phenotype. Br J Cancer. 2017;116:893–902. doi: 10.1038/bjc.2017.26. [DOI] [PMC free article] [PubMed] [Google Scholar]
- 27.Cipolla V, Santucci D, Guerrieri D, Drudi FM, Meggiorini ML, de Felice C. Correlation between 3 T apparent diffusion coefficient values and grading of invasive breast carcinoma. Eur J Rad. 2014;83:2144–2150. doi: 10.1016/j.ejrad.2014.09.015. [DOI] [PubMed] [Google Scholar]
- 28.Amornsiripanitch N, Nguyen VT, Rahbar H, Hippe DS, Gadi VK, Rendi MH, Partridge SC. Diffusion-weighted MRI characteristics associated with prognostic pathological factors and recurrence risk in invasive ER+/HER2- breast cancers. J Magn Reson Imaging. 2017;48:226–236. doi: 10.1002/jmri.25909. [DOI] [PMC free article] [PubMed] [Google Scholar]
- 29.Youk JH, Son EJ, Chung J, Kim JA, Kim E. Triple-negative invasive breast cancer on dynamic contrast-enhanced and diffusion-weighted MR imaging: comparison with other breast cancer subtypes. Eur Radiol. 2012;22:1724–1734. doi: 10.1007/s00330-012-2425-2. [DOI] [PubMed] [Google Scholar]


