Abstract
Objectives: Bladder urothelial carcinoma (BLCA) is one of the most common malignancies in urinary system. With the development of next-generation sequencing technology, we intended to investigate prognostic immune cells and related signature to predict the prognosis of BLCA and potential therapeutic targets. Methods: We obtained the transcriptome profiles of 573 BLCA patients from The Cancer Genome Atlas (TCGA) and Gene Expression Omnibus (GEO) databases. The fractions of immune cells in each sample was calculated by “CIBERSORT” algorithm. Tumor Infiltrating Immune Cells Scores (TIICS) was accordingly derived and Receiver Operating Characteristic (ROC) curve was conducted to evaluate the predictive efficiency. Moreover, differential analysis was performed between two TIICS groups and hub TIICS-related immune signature was identified. The correlation of key immune genes and immune-infiltrating immune cells was evaluated based on the TIMER database. An Immune Signature Prognostic Index (ISPI) based on these signatures was constructed with superior predictive accuracy. Last, the TIICS model or related immune signature were all validated in an independent cohort from the GSE13507. Results: The least absolute shrinkage and selection operator (LASSO) algorithm was utilized to screen the 6 hub tumor-infiltrating immune cells in TCGA cohort, where higher infiltrating levels of M0 Macrophages, M2 Macrophages and Neutrophils were hazard factors, while CD8+ T cells and memory activated CD4+ T cells were protective factors. Conclusion: Taken together, our study identified several prognostic immune cells and related immune signature in BLCA, shedding insight on the individualized immunotherapy or potential drug targets.
Keywords: Tumor-infiltrating immune cells, immune signature, prognosis, bladder urothelial carcinoma
Introduction
Bladder urothelial carcinoma (BLCA) remains one of the most common malignancies in urinary system and ranks the ninth among all tumors worldwide [1]. Urothelial carcinoma is the main pathological type of bladder cancer, accounting for 90% of all BLCA patients [2,3]. Since the public awareness of early-detection or development of management, the morbidity of BLCA and tumor-related mortality have increased yearly with the estimated new cases reaching up to 80470 in the United states in 2019 [4]. Though most of bladder cancers do not invade the muscle wall of bladder, nearly 25% of patients inevitably progress into muscle-invasive bladder cancer (MIBC), associated with much worse prognosis [5,6]. Patients with non-muscle invasive urothelial carcinoma were often treated with transurethral resection of bladder tumor (TURBT) followed by intravesical instillation of Bacillus Calmette-Guerin (BCG) to prevent recurrence [7,8]. For muscle invasive cases, neoadjuvant chemotherapy using a cisplatin combination regimen plus with radical cystectomy are preferred and the chemotherapy may be chosen as the mainstream treatment for patients with advanced metastasis [9,10]. However, the efficacy of surgical intervention is limited, and chemotherapy is shown to have multiple side effects, especially the obvious toxicity.
Based on the rapid progression of cancer immune-related therapies during these years, inhibitors of targeted sites in the immune pathway such as programmed death 1 (PD-1) antibody or cytotoxic T-lymphocyte-associated antigen 4 (CTLA-4) antibody has brought about a major breakthrough in the treatment of locally advanced and metastatic bladder cancer [11,12]. Currently, multi-centers with large samples of clinical trials have proved the exact efficacy of PD-1/PDL-1 antibody. The American Society of Clinical Oncology (ASCO) in 2017 has declared the superior clinical outcome of pembrolizumab and recommended it as the first-line in treating locally advanced or stage IV metastatic cases to replace traditional cis-platinum regimen, which was released as the guideline by The National Comprehensive Cancer Network (NCCN) in 2018 [13,14]. Besides, other investigators found that some urinary cytokines may provide additional value to predict responses to immune drugs in patients with NMIBC which shed lights on the importance of feasible immune biomarkers [12,15,16]. However, there existed a proportion of BLCA patients revealed limited responses to immunotherapy, indicating the potential heterogeneity in immune treatment across patients. Clinical markers currently used to predict the responsive efficacy of immunotherapy included the expression level of PD-1/PD-L1, luminal or basal subtypes, tumor mutation burden or ECOG scores [17,18]. However, it is difficult to implement, and the feasibility is limited [19,20]. Therefore, it is significant to identify robust genes that possessing predictive values for BLCA patients and even served as potential targets for immune therapy.
CIBERSORT was utilized to estimate the proportions of 22 immune cell subtypes using gene expression profiling, which was used in various tumor samples. In our research, we combined the transcriptome data and corresponding clinical information of patients from TCGA-BLCA cohort and GEO databases to construct and confirm a Tumor Infiltrating Immune Cells Scores (TIICS) model consisted of 6 prognostic tumor immune cells. We systematically assessed the prognostic value of TIICS and the relationships with independent clinical characteristics. Besides, we also investigated and identified the potential TIICS-related immune signature associated with immune infiltrates and survival outcomes. Hence, our analysis aimed to provide a comprehensive landscape of prognostic immune infiltration cells with risk immune signature for prediction and offered a foundation in subsequent individualized treatment of BLCA patients.
Methods and materials
Data acquisition and processing
Transcriptome profiling raw data with corresponding clinical information were downloaded from TCGA (https://cancergenome.nih.gov/) and the GEO (https://www.ncbi.nlm.nih.gov/geo/) databases. From TCGA, we obtained 408 BLCA and 25 normal tissues using the GDC tool, in which the mRNA-seq data were processed as the FPKM values. We normalized the RNA expression profiles, and the differential genes analysis was performed by the “edgeR” package. Besides, GSE13507 series consisted of 188 BLCA matched with 68 normal tissues, and we downloaded the series matrix files to conduct normalization of raw data using the “limma” package. In addition, the immune related genes were downloaded and summarized from the Immunology Database and Analysis Portal (ImmPort), which updating and sharing data on immunology research timely. These genes were identified and chosen to further investigate the underlying relationships with tumor immune infiltrates.
Estimated abundance of immune cells and prognostic analysis
CIBERSORT is an advanced method to infer the specific abundances of immune cells based on expression data. We obtained the “CIBERSORT” R script (https://cibersort.stanford.edu/) and conducted the deconvolution algorithm based on the transcriptome data of 408 BLCA samples. The algorithm estimated the fraction of 22 tumor infiltrating immune cells in BLCA. The results were shown in a matrix and the sum of all immune cells equaled 100% in each sample. Meanwhile, univariate Cox regression model and Least Absolute Shrinkage and Selection Operator (LASSO) method were conducted by “survival” and “rms” packages to identify hub prognostic immune cells in BLCA. Multivariate Cox model was used to calculate the coefficients (βi) of each prognostic immune cells. Then, Tumor Infiltrating Immune Cells Scores (TIICS) was established as: TIICS = Σ (βi*Fractioni). Furthermore, Receiver Operating Characteristic (ROC) curve were used to confirm the predictive significance of prognostic cells and survival analysis was conducted to compare the differential prognosis in patients in two TIICS levels. The distribution of 22 immune cells were shown in heatmap plot via “heatmap” package and the correlation among cells were calculated by “corrplot” package. In addition, Wilcox rank-sum test was conducted to confirm the various infiltrations of cells in two TIICS levels quantitatively. The survival plots of immune cells were drawn by “survival” package.
Correlation analysis
We extracted several independent risk clinical features from included patients, including tumor grades and TNM stages. The Wilcox rank-sum test was selected only to compare the distributions of TIICSs in two groups, while Kruskal-Wallis (K-W) test was used in three or more groups. We regarded that P<0.05 was statistically significant.
Differential analysis, functional pathways, and gene set enrichment analysis (GSEA)
Differentially expressed genes analysis was conducted to identify TIICS related signature between two groups by “limma” packages. The |log (Fold Change)| >1 and false discovery rate (FDR) <0.05 as set as the threshold. Then, we searched the differential immune signature and univariate Cox analysis was utilized to select significantly prognostic ones. The intersect genes were visualized via “Venn Diagram” package. Moreover, the Gene Ontology (GO) and Kyoto Encyclopedia of Genes and Genomes (KEGG) analysis for differential signature were shown in dot plot with various packages consisted of “org.Hs.eg.db”, “cluster Profiler”, “enrich plot” and “ggplot2” packages. Last, GSEA was performed between high- and low TIICS phenotypes (http://software.broadinstitute.org/gsea/index.jsp) to analyze the immune-related pathways between two groups. We downloaded the “c2.cp.kegg.v6.2.symbols.gmt gene sets” from the MSigDB (http://software.broadinstitute.org/gsea/downloads.jsp) as the reference gene sets. In addition, the enriched gene sets were considered to be significant when FDR was less than 0.25 and the P value was less than 0.05.
TIMER database
TIMER (https://cistrome.shinyapps.io/timer/) is a comprehensive immunological resource including more than 10,000 samples across various cancer types from TCGA, mainly focusing on the analysis of tumor immune infiltrates. The abundances of six infiltrated immune cells could be estimated by the database, which is confirmed in well accordance with flow cytometry results. Hence, we further analyzed the relationships between expression of the prognostic immune related genes (IRGs) with the infiltrating abundance of six hub immune cells. The Spearman’s correlation coefficient and the estimated statistical significance were calculated. The gene expression level was represented with log2 RSEM at the y axis. Furthermore, we assessed the mutants of key immune genes with immune infiltrations in BLCA based on the on the “SCNA” module (https://cistrome.shinyapps.io/timer/). The differential infiltrating levels was compared using Wilcox rank-sum test.
Construction of ISPI in BLCA
Since we identified 16 hub immune infiltrating related signature, we constructed an ISPI to predict survival outcomes in BLCA as following: ISPI = Σ (βi*EXPi). Then, we classified the cohorts into two groups with low- and high ISPI. We utilized the ROC to evaluate the predictive significance of ISPI and Kaplan-Meier analysis was used to confirm the prognosis difference between two groups. Meanwhile, The ISPI model was further validated in GSE13507.
Statistical analysis
LASSO regression analysis, Cox regression model or Kaplan-Meier analysis were conducted by “glmnet” and “survival” packages. The Student’s t test was used to compare the clinical variables, and Chi-square test was suitable for categorical variables. Wilcoxon rank-sum test was used for comparisons between two groups. The Pearson coefficients were used to determine the correlation between two variables. All statistical analysis was conducted in R studio (version 3.5.3), and the P<0.05 was regarded to be significant.
Results
Identification of prognostic tumor immune infiltrating cells in BLCA
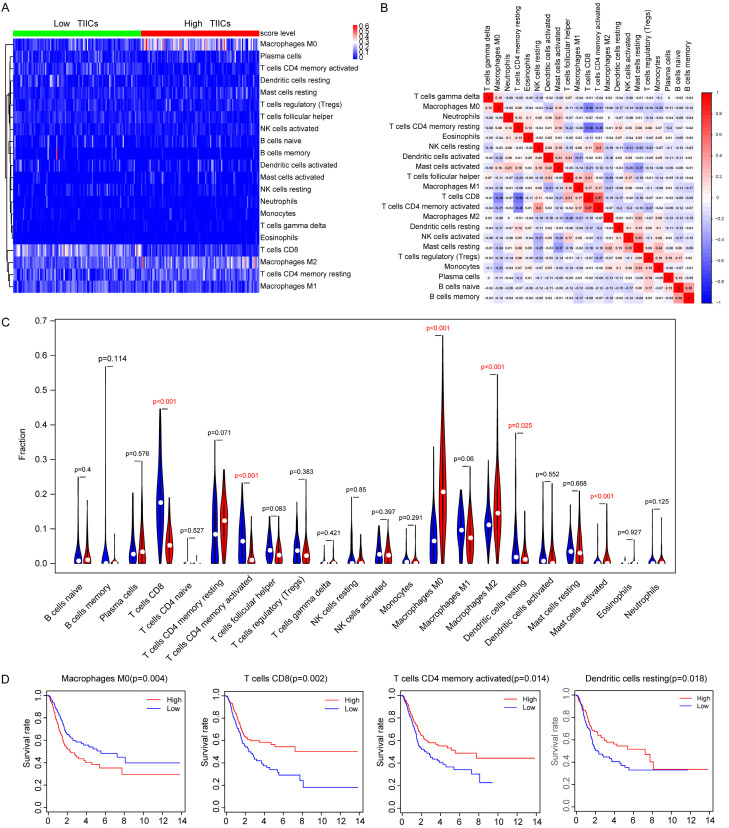
The clinical baseline characteristics of included BLCA cohorts were shown in Table 1. We calculated the fractions of 22 tumor infiltrating immune cells in 408 BLCA samples using the gene transcriptome data (Figure 1A; Table S1). Then, the LASSO regression analysis screened 6 survival-related immune cells, including M0 Macrophages, M2 Macrophages, CD8+ T cells, memory activated CD4+ T cells, resting Dendritic cells and activated Dendritic cells (Figure 1B, 1C). Univariate Cox analysis revealed that higher infiltrating M0 Macrophages (HR=5.042, P=0.001), M2 Macrophages (HR=4.643, P=0.043) and Neutrophils (HR=3.902, P=0.01) were hazard factors, while CD8+ T cells (HR=0.093, P=0.004) and memory activated CD4+ T cells (HR=0.075, P=0.060) were protective factors (Table 2; Figure 1D). Though no significant difference of infiltrating levels of Dendritic cells in univariate Cox analysis, the subsequent Kaplan-Meier analysis suggested that lower infiltrating level of Dendritic cells predicted poor survival outcomes (P=0.018). We finally integrated 6 immune cells into the final model consisted of M0 Macrophages, M2 Macrophages, CD8+ T cells, memory activated CD4+ T cells, resting Dendritic cells and activated Dendritic cells. TIICS was calculated by multivariate Cox results and divided the 408 patients into high- and low-TIICS groups (Table S2). Area Under Curve (AUC) of the ROC plot was 0.653, and patients with higher TIICS level revealed poor survival outcomes in Kaplan-Meier curve (P=1e-05, Figure 1E, 1F). To further investigate the differential levels of immune cells in two groups, the heatmap illustrated that M0 Macrophages, M2 Macrophages showed advanced infiltration in high-TIICS group, while memory activated CD4+ T cells, CD8+ T cells were lower infiltrating in low-TIICS group (Figure 2A). In addition, the correlation heatmap indicated the coincident and exclusive relationships among immune cells in Figure 2B, in which green represented the co-occurrence and red represented the mutually exclusive associations.
Table 1.
Clinical baseline of all 577 BLCA patients from TCGA cohort and GSE13507
| Variables | Training group (n=412) | Validation group (n=165) | Entire group (n=577) |
|---|---|---|---|
| Status | |||
| Alive | |||
| Dead | 156 (38.5) | 69 (41.8) | 225 (43.3) |
| Age | 68±10.57 | 65.18±11.97 | 67.19±11.06 |
| Gender | |||
| Female | 106 (26.2) | 30 (18.2) | 136 (23.9) |
| Male | 299 (73.8) | 135 (81.8) | 434 (76.1) |
| Race | |||
| White | 334 (82.5) | NA | NA |
| Asian | 43 (10.6) | NA | NA |
| Black or African | 28 (6.9) | NA | NA |
| AJCC-T | |||
| T0/Ta | 1 (0.2) | 24 (14.5) | 25 (4.4) |
| T1 | 3 (0.8) | 80 (48.5) | 83 (14.6) |
| T2 | 117 (28.9) | 31 (18.8) | 148 (25.9) |
| T3 | 193 (47.7) | 9 (5.5) | 212 (37.2) |
| T4 | 58 (14.3) | 11 (6.7) | 69 (12.1) |
| unknown | 33 (8.1) | 0 (0.0) | 33 (5.8) |
| AJCC-N | |||
| N0 | 235 (58.0) | 149 (90.3) | 384 (67.4) |
| N1 | 46 (11.4) | 8 (4.9) | 54 (9.5) |
| N2 | 75 (18.5) | 6 (3.6) | 81 (14.2) |
| N3 | 7 (1.7) | 1 (0.6) | 8 (1.4) |
| unknown | 42 (10.4) | 1 (0.6) | 43 (7.5) |
| AJCC-M | |||
| M0 | 195 (48.1) | 158 (95.8) | 353 (61.9) |
| M1 | 11 (2.7) | 7 (4.2) | 18 (3.2) |
| Mx | 199 (49.2) | NA | NA |
| Pathologic stage | |||
| I & II | 130 (32.1) | NA | NA |
| III & IV | 273 (67.4) | NA | NA |
| unknown | 2 (0.5) | NA | NA |
| Tumor grade | |||
| G1/G2 | 20 (5.0) | 105 (63.6) | 125 (21.9) |
| G3/G4 | 382 (94.3) | 60 (36.4) | 442 (77.6) |
| unknown | 3 (0.7) | NA | NA |
| TIICS level | |||
| Low | 203 (50.1) | 82 (50.0) | 285 (50.0) |
| High | 202 (49.9) | 83 (50.0) | 285 (50.0) |
Figure 1.
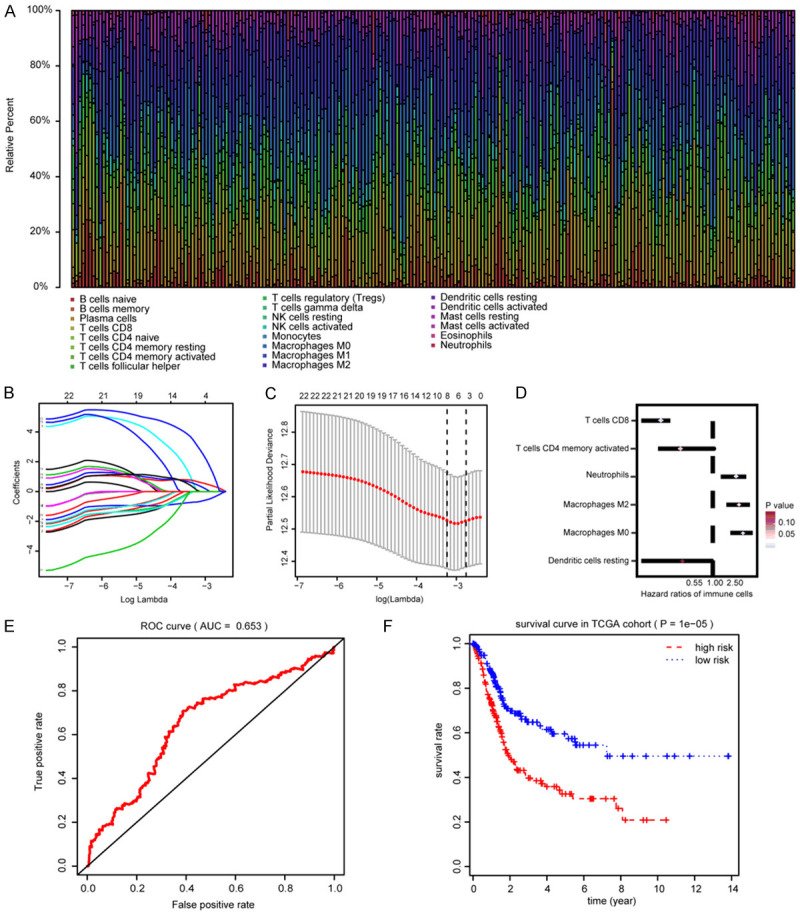
Identification of hub prognostic immune infiltrating cells and construction of TIICS model. A. Summary of 22 inferred immune cell subtypes by CIBERSORT algorithm. Bar charts exhibit the cell proportions and various annotated colors represent 22 immune cells. B. Cross-validation was performed for tuning parameter selection in the LASSO regression model. C. Illustration for LASSO coefficient profiles of 22 immune cells. LASSO, least absolute shrinkage and selection operator. D. Hazard ratios of 6 prognostic immune cells associated with OS by univariate Cox analysis. E. ROC curve of TIICS model for assessment of predictive accuracy. F. Comparisons of differential survival outcomes between two TIICS levels via Kaplan-Meier analysis with log-rank test.
Table 2.
Univariate Cox analysis for 22 immune infiltration cells in BLCA
| Cell type | HR | Lower bund (95% CI) | Upper bound (95% CI) | P value |
|---|---|---|---|---|
| Macrophages M0 | 5.042 | 2.631 | 8.514 | 0.001 |
| T cells CD8 | 0.093 | 0.013 | 0.282 | 0.004 |
| Neutrophils | 3.902 | 1.471 | 5.263 | 0.010 |
| Macrophages M2 | 4.643 | 1.549 | 7.234 | 0.043 |
| T cells CD4 memory activated | 0.075 | 0.012 | 1.032 | 0.060 |
| T cells follicular helper | 0.087 | 0.022 | 1.093 | 0.106 |
| T cells regulatory (Tregs) | 0.131 | 0.021 | 1.216 | 0.132 |
| T cells CD4 naive | 34.949 | 0.812 | 53.193 | 0.140 |
| Dendritic cells resting | 0.221 | 0.023 | 1.072 | 0.152 |
| Mast cells resting | 5.370 | 0.917 | 10.329 | 0.192 |
| B cells memory | 0.070 | 0.011 | 1.215 | 0.277 |
| NK cells resting | 0.142 | 0.027 | 1.201 | 0.360 |
| T cells gamma delta | 96.105 | 0.971 | 183.427 | 0.394 |
| Eosinophils | 0.118 | 0.002 | 1.936 | 0.646 |
| Dendritic cells activated | 0.680 | 0.241 | 1.254 | 0.712 |
| Plasma cells | 0.808 | 0.671 | 2.103 | 0.825 |
| NK cells activated | 0.670 | 0.304 | 1.214 | 0.828 |
| Mast cells activated | 1.479 | 0.751 | 3.019 | 0.835 |
| B cells naïve | 0.853 | 0.613 | 1.273 | 0.889 |
| Macrophages M1 | 1.126 | 0.271 | 3.067 | 0.913 |
| Monocytes | 1.060 | 0.439 | 2.107 | 0.982 |
| T cells CD4 memory resting | 1.002 | 0.701 | 2.051 | 0.998 |
Figure 2.
Depiction and distributions of immune cells in two TIICs groups. A. Differential abundance of immune cells in two TIICS groups in heatmap plot. B. Correlation heatmap represents the coincident and exclusive associations across 22 immune cells, where blue represents the mutual exclusion and red represents the consistence ranging from -1 to 1. C. Differential density of immune cells in two TIICS groups was compared by Wilcox rank-sum test. D. Survival analysis of immune cells was conducted, where higher level of M0 macrophage correlated with poor outcomes and lower level of CD8+ T cell, memory activated CD4+ T cells, resting Dendritic cells were associated with worse prognosis.
The subsequent results of Wilcox rank-sum test and Kaplan-Meier analysis were in line with the previous analysis, in which M0 Macrophages showed higher infiltration in high-TIICS group suggesting poor outcomes, but higher infiltrating level of memory activated CD4+ T cells, CD8+ T cells were protective factors (Figure 2C, 2D).
TIICS correlated with clinical characteristics and validation in another cohort
The Wilcox rank-sum test or Kruskal-Wallis (K-W) test showed that high infiltrating levels of TIICS correlated with higher AJCC-TNM stages and advanced tumor grades in TCGA cohort (Figure 3A-D). To validate the significantly risk immune cells and TIICS, we obtained the 195 BLCA patients and constructed the TIICS through the same procedure (Table S3). In GSE13507, the TIICS level was associated with T stages (P=0.005) and tumor grades (P=0.004) (Figure 3E, 3F). Moreover, the ROC curve showed the predictive value of TIICS with AUC=0.685, and patients with high TIICS levels suffered from poor prognostic outcomes (P=0.00162), which was in line with the results in the TCGA-BLCA cohorts (Figure 3G, 3H).
Figure 3.
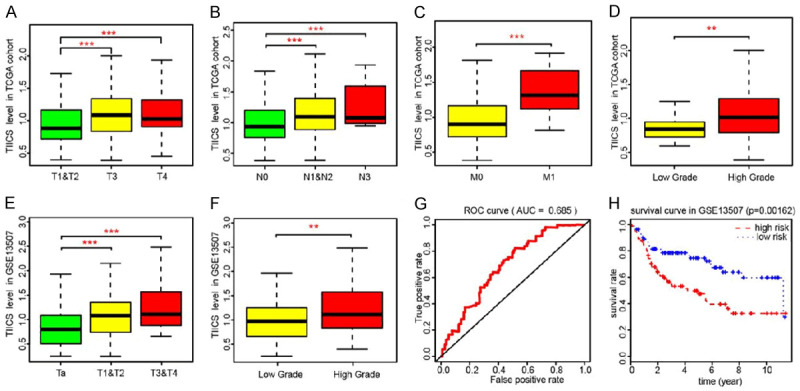
Correlation analysis of TIICS with clinical characteristics and validation in an independent dataset. A-D. Non-parametric test indicated that higher TIICS level correlated with higher AJCC-TNM stages and advanced tumor grades in TCGA cohorts. E, F. Similar results were also observed in GSE13507, where higher TIICS levels also correlated with higher T stages and tumor grades. The * represented the P<0.05. The ** represented the P<0.01, and *** represented the P<0.001. G, H. TIICS model was validated in GSE13507, of which the AUC was 0.685 and the patients with higher TIICS model showed less survival time (P=0.00162).
Identification of 16 hub tumor immune infiltrating related signature
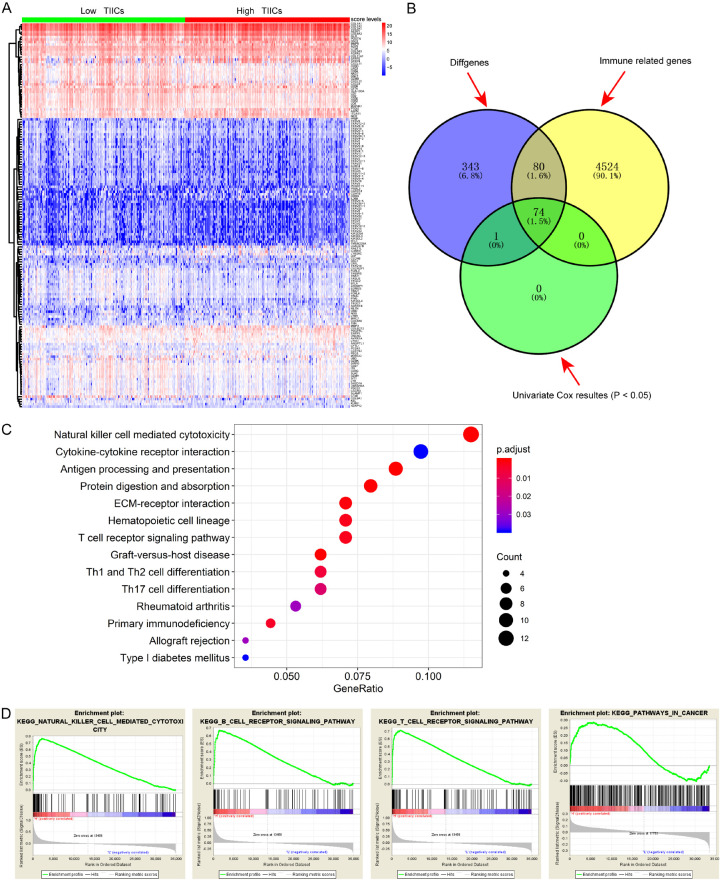
Since we investigated the prognostic immune cells in tumor microenvironment, we invented to further uncover the potential related signature that highly associated with TIICS and survival outcomes. Differential analysis between the two TIICS levels revealed a list of 497 significant genes with FDR <0.05 (Table S4; Figure 4A). Then, we screened out a total of 154 differential immune genes using the data from the ImmPort database (Figure 4B). Functional analysis based on the differentially expressed genes revealed the enriched immune-related GO items in Table 3, and the KEGG showed the top pathways that these signature might be involved in, including natural killer cell mediated cytotoxicity, cytokine-cytokine receptor interaction, and T cell receptor signaling pathways. Subsequently, the GSEA results demonstrated that there were several enriched immune-related pathways, including natural killer cell mediated cytotoxicity, B cell receptor signaling pathway, T cell receptor signaling pathway and pathways in cancer. Additionally, we utilized the univariate Cox regression method to screen the 74 significantly prognosis-related immune signature that correlated with TIICS (P<0.05). Stepwise algorithm was performed to identify the 16 key prognostic TIICS-related genes in Table 4.
Figure 4.
Identification of hub TIICS-related immune signature and functional analysis. A. Differentially expressed genes (DEGs) between two TIICS groups with |log (Fold Change)| >1 and false discovery rate (FDR) <0.05 as the cutoff value. B. Identification of hub immune signature via intersection and Cox analysis. C. Top immune-related crosstalk that these DEGs might be involved in. D. GSEA for comparing immune phenotype between high- and low-TIICS groups.
Table 3.
Significantly top 30 enriched GO items of differentially expressed genes between two TIICS levels
| Ontology | Description | P value |
|---|---|---|
| GOTERM_BP_DIRECT | T cell activation | 6.57E-07 |
| extracellular structure organization | 8.60E-07 | |
| extracellular matrix organization | 9.25E-07 | |
| T cell differentiation | 1.59E-05 | |
| collagen fibril organization | 3.50E-05 | |
| cellular defense response | 0.000134 | |
| T cell receptor signaling pathway | 0.000231 | |
| positive T cell selection | 0.000252 | |
| extracellular matrix disassembly | 0.000575 | |
| lymphocyte differentiation | 0.000696 | |
| GOTERM_MF_DIRECT | extracellular matrix structural constituent | 4.46E-10 |
| MHC protein binding | 2.85E-07 | |
| extracellular matrix structural constituent conferring tensile strength | 2.85E-07 | |
| collagen binding | 4.11E-06 | |
| serine-type peptidase activity | 4.20E-05 | |
| serine hydrolase activity | 4.29E-05 | |
| serine-type endopeptidase activity | 4.54E-05 | |
| fibronectin binding | 0.001746 | |
| metalloendopeptidase activity | 0.001746 | |
| receptor ligand activity | 0.002964 | |
| GOTERM_CC_DIRECT | endoplasmic reticulum lumen | 0.026267 |
| lysosomal lumen | 0.018802 | |
| extracellular matrix component | 0.000321 | |
| T cell receptor complex | 0.000157 | |
| complex of collagen trimers | 1.20E-05 | |
| external side of plasma membrane | 7.43E-07 | |
| collagen trimer | 6.15E-07 | |
| fibrillar collagen trimer | 3.65E-07 | |
| banded collagen fibril | 3.65E-07 | |
| collagen-containing extracellular matrix | 7.80E-08 |
Table 4.
Identification of 16 hub prognostic TIICS-related signature based on stepwise regression method
| Genesymbol | Description | coef | exp (coef) | se (coef) | P |
|---|---|---|---|---|---|
| COL1A2 | collagen type I alpha 2 chain | 0.45407 | 1.5747 | 0.19329 | 0.018815 |
| COL3A1 | collagen type III alpha 1 chain | -0.36841 | 0.69183 | 0.22804 | 0.106194 |
| CTSE | cathepsin E | -0.05875 | 0.94294 | 0.02553 | 0.021389 |
| CXCL13 | C-X-C motif chemokine ligand 13 | -0.09092 | 0.91309 | 0.05276 | 0.084821 |
| DSC1 | desmocollin 1 | 0.08462 | 1.0883 | 0.04128 | 0.040375 |
| ISLR | immunoglobulin superfamily containing leucine rich repeat | 0.1515 | 1.16358 | 0.09388 | 0.106567 |
| KLRK1 | killer cell lectin like receptor K1 | -0.24256 | 0.78462 | 0.06882 | 0.000424 |
| MAP4K1 | mitogen-activated protein kinase kinase kinase kinase 1 | -0.20795 | 0.81225 | 0.11687 | 0.075195 |
| NID2 | nidogen 2 | 0.17214 | 1.18784 | 0.10616 | 0.104912 |
| SFRP2 | secreted frizzled related protein 2 | 0.10644 | 1.11231 | 0.05029 | 0.034297 |
| UBASH3A | ubiquitin associated and SH3 domain containing A | 0.37533 | 1.45548 | 0.13421 | 0.005163 |
| CYTL1 | cytokine like 1 | 0.11834 | 1.12563 | 0.05877 | 0.044057 |
| COL1A1 | collagen type I alpha 1 chain | -0.46361 | 0.62901 | 0.24535 | 0.058809 |
| KIR2DS4 | killer cell immunoglobulin like receptor, two Ig domains and short cytoplasmic tail 4 | -0.10597 | 0.89945 | 0.06575 | 0.107022 |
| CD3G | CD3g molecule | -0.19408 | 0.82359 | 0.12124 | 0.109419 |
| CD36 | CD36 molecule | 0.05202 | 1.05339 | 0.03453 | 0.131996 |
Correlation of TIICS-related signature with infiltrating levels of immune cells
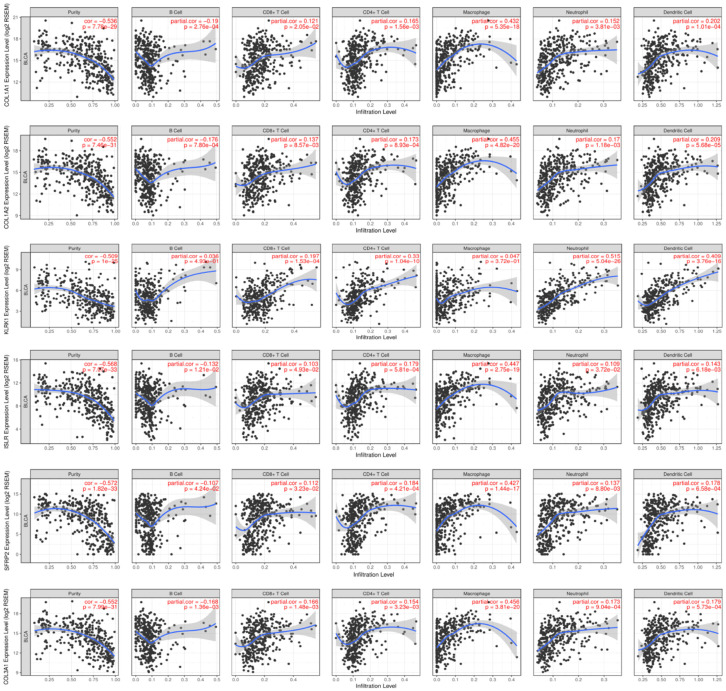
Using the TIMER database, we discussed the relationships of 16 hub signature with immune infiltration cells. From the Pearson coefficients and estimated P value, we observed that these signature were highly correlated with immune infiltration cells, especially including B cell, CD8+ T cell, CD4+ T cell, Macrophages, Neutrophil and Dendritic Cell (Figure 5). What is more, the mutants of these immune commonly led to lower infiltrating levels of immune cells consisted of CD4+ T cell, Neutrophil and Dendritic cell (Figure S1).
Figure 5.
Correlation of hub prognostic TIICS-related signature with immune infiltration level in BLCA based on TIMER database.
Assessment of TIICS-related ISPI in BLCA and validation in GSE13507
Using the stepwise regression results, we established and calculated the immune signature related Prognostic Index (PI) for BLCA cohorts. Then, we classified the cases into two groups according to the cutoff value of the median value of PI. The distributions of vital status in two groups were shown in Figure 7A. The ROC curve showed the superior predictive accuracy of PI in 3-year overall survival prediction with AUC=0.797 (Figure 7B). Patients with higher PI showed poor prognosis relative to those with low PI (P=0, Figure 7C). In the validation group, the PI was demonstrated to be an independent factor (AUC=0.673) and the P value in Kaplan-Meier analysis was 1e-05 in survival plot (Figure 7E, 7F).
Figure 7.
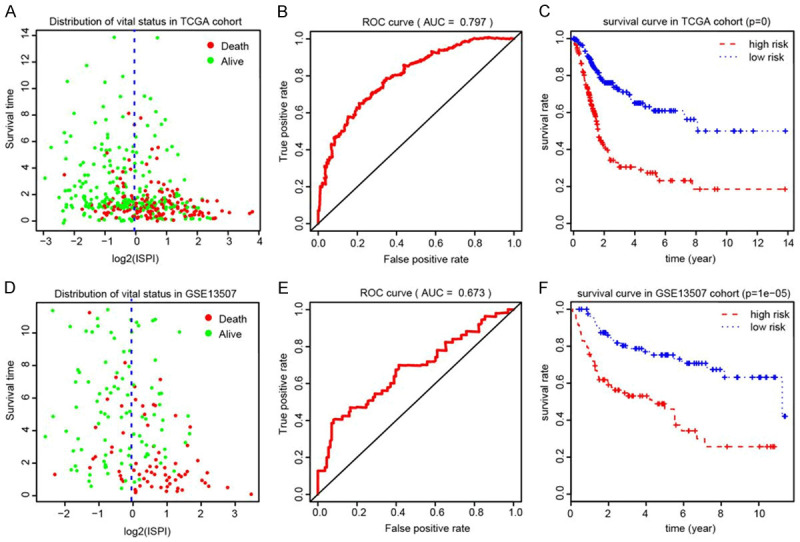
Construction and evaluation of ISPI based on 16 hub signature for BLCA. A. The distribution of vital status of patients in two ISPI groups. B. The AUC of ROC curve was 0.797 showing superior predictive accuracy. C. Patients with higher level of ISPI demonstrated poor outcomes (P<0.001). D-F. Validation of the robust ISPI model in GSE13507.
Discussion
Patients diagnosed with BLCA have a difficult decision between radical cystectomy and trimodal therapy consisted of maximal transurethral resection of tumor followed by chemotherapy, and close cystoscopic surveillance [21,22]. The current evidence showed no advantage for one or other approaches in regard to survival outcomes [23]. With the breakthrough of immune therapy in recent years, PD1/PDL-1 antibody or other novel immune drugs have been recommended for clinical use and nearly replaced chemotherapy, becoming a highly promising role in the management of high-grade non-muscle-invasive bladder cancer (NIMBC) [24]. However, there existed problems that some BLCA patients showed less effective to immunotherapy due to tumor heterogeneity or other indefinite resistant mechanisms [25-27]. Given the importance of immune environment in the promotion of tumorigenesis, it is significant to identify immune cells or related signature to predict prognosis or served as potential targets in immune treatment [28-30]. Although gene signature for prognosis of tumors based on non-coding RNAs, ceRNAs or mRNA were commonly explored and reported, characterization of prognostic immune cell subtypes combined with immune signature analysis for BLCA have been less investigated.
In our study, this is the first attempt to explore a genome-wide profiling study to uncover risk tumor infiltrating immune cells, immune signature and their clinical significance across multiple databases. We obtained mRNA profiles of 408 BLCA matched with 25 normal tissues from TCGA database and identified 6 prognostic immune infiltration cells associated with survival via LASSO method and Cox regression model. Subsequently, a robust TIICS model was constructed and differential analysis was performed between two TIICS levels to further discover significant TIICS related immune signature. Correlation analysis revealed that TIICS level was associated with higher tumor grades, advanced pathological stages and AJCC-TNM stages positively. Kaplan-Meier analysis also indicated the associations between TIICS and OS, where patients in high-risk group showed significantly worse survival outcomes than that in low-risk group. We further validated the TIICS model using the 165 BLCA patients from the GSE13507 series, in accordance with previous results. TIMER database is a web server that used to conduct comprehensive analysis of tumor-infiltrating immune cells. The Pearson coefficients between identified immune signature and hub immune cells further analyze the relationships among them. However, the specific regulations across the signature and immune cell subtypes were warranted for further experimental validation.
Numerous previous data have demonstrated that tumor associated macrophages (TAMs) density correlated with poor survival in multiple cancers, promoting tumor progression or metastasis by directly affecting the epithelial-mesenchymal transition (EMT), angiogenesis, and immune escape [31-35]. Chen C et al. have reported that LNMAT1 overexpression led to lymphatic nodes metastasis in BLCA, by inducing the recruitment of macrophage in tumor microenvironment with CCL2/TAMs axis. In our research, we identified that specific subtype M0 macrophage was associated with poor prognosis (HR=5.042, P=0.001), which especially accounted for higher fractions in tumor samples. Another immune risk cells, M0 macrophage, was also found to be related with survival (HR=4.643, P=0.043) in Cox regression analysis. However, no significance was observed in subsequent Kaplan-Meier curves and larger samples were needed to evaluate again. Additionally, it is robust to note that we also observed the CD8+ T cell and memory B cell infiltration had relationships with prognosis, where the factions of CD8+ T cell and memory activated CD4+ T cells showed lower infiltrates in tumor samples versus normal and indicated poor survival outcomes. CD8+ T cell and activated CD4+ T cells were already acknowledged as important components in cellular immunity and plays a major suppressor role in various tumor micro-environment, including breast cancer, clear cell renal cell carcinoma or colorectal cancer. Moreover, Fu H et al. have recently confirmed five significant immune infiltrates (CD8+ T cell, Macrophage, NK, Treg, Mast Cell) and successfully classified the patients into A and B immunotypes using the LASSO method based on TCGA cohort plus with 258 MIBC patients from local hospital. In accordance with these researches, our results predicted that higher infiltrating density of CD8+ T cell and activated CD4+ T cells conferred prolonged OS and better prognosis, providing a future therapeutic target in BLCA.
Apart from the detailed assessment of immune infiltration in BLCA, we also discussed the TIICS related immune signature for OS prediction consisted of 16 prognostic immune genes (KLRK1, UBASH3A, COL1A2, CTSE, SFRP2, DSC1, CYTL1, COL1A1, MAP4K1, CXCL13, NID2, COL3A1, ISLR, KIR2DS4, CD3G, CD36). Among these identified genes, we found that most of them were cytokines or chemokines, functioning as vital components in tumor immunity. COL1A1, COL1A2, COL3A1 were members of collagen factors and they were commonly reported, especially the COL1A1, in promotion of tumorigenesis or metastasis across multiple tumors including breast cancer, gastric cancer and cervical cancer. Functional analysis suggested that differentially expressed genes might be involved in cytokine-cytokine receptor interaction, natural killer cell mediated cytotoxicity, ECM-receptor interaction and other important immune crosstalk. Besides, the GSEA and mutation analysis of signature based on TIMER database further strengthened the tight relationships between signature and immune infiltrates, especially CD4+ T cell, neutrophil and dendritic cell (Figure 4D; Figure S1). Kaplan-Meier analysis demonstrated the prognostic value of immune signature and we selected some to exhibit in Figure 6. It is worthy to note that these genes possessed well predictive value, and the PI showed robust stability in discovery and validation group. Given the potential associations with immune infiltrates, these genes deserved for further functional validation and exploration on therapeutic targets.
Figure 6.
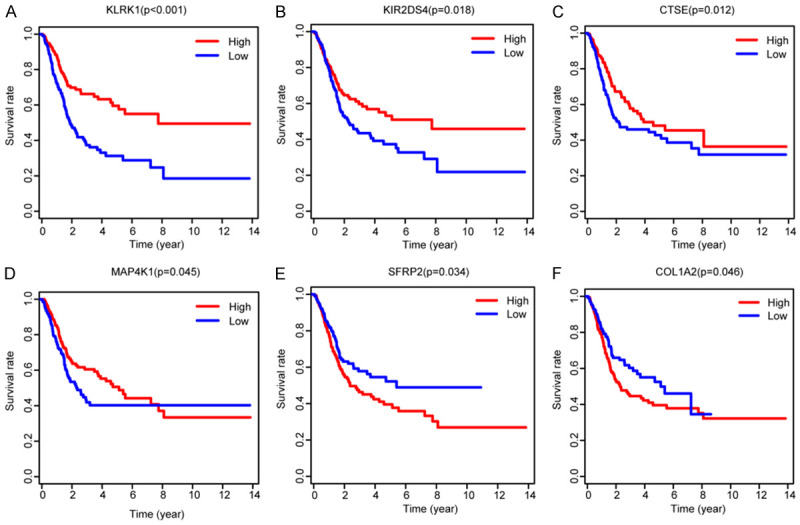
Kaplan-Meier analysis with log-rank test of hub immune signature and selected some to exhibit.
However, there are still several defects in our research that need to be further improved. First, the modest inconsistent results of Cox regression analysis versus Kaplan-Meier analysis of M2 Macrophages, memory activated CD4+ T cells and resting Dendritic cells might need larger samples to further investigate. Secondly, since we have identified the relationships between TIICS related signature with immune infiltrates, the functional analysis should be added to uncover underlying specific regulatory mechanisms. In addition, although we utilized the GSE13507 cohort as the validation group, there is still a lack of multi-center large clinical samples to make sure the predictive accuracy of TIICS model. Last, flow cytometry might be warranted to further evaluate the fractions of immune cells, which was an important supplementary work for CIBERSORT algorithm.
Taken together, immune research has already attracted the intensive attention in cancer study. The present work including 573 BLCA samples have identified a robust TIICS model consisted of 6 immune cells and discussed the TIICS-related immune signature for OS prediction. This is our first attempt to implement the integrated omic analysis of immune landscape from genomic signature to immune infiltrates based on high throughput data with corresponding clinical information from large samples, which providing valuable suggestions on risk prediction or individualized immunotherapy.
Acknowledgements
This study was supported by the Guangdong Provincial Natural Science Foundation (2018-A030313434), The Guangdong Provincial Medical Science Research Foundation (A2018259), and the Guangzhou Municipal Science and Technology Program (201904010006).
Disclosure of conflict of interest
None.
Table S1
Tables S2, S4 and Figure S1
Table S3
References
- 1.Bidnur S, Savdie R, Black PC. Inhibiting immune checkpoints for the treatment of bladder cancer. Bladder Cancer. 2016;2:15–25. doi: 10.3233/BLC-150026. [DOI] [PMC free article] [PubMed] [Google Scholar]
- 2.Fakhrejahani F, Tomita Y, Maj-Hes A, Trepel JB, De Santis M, Apolo AB. Immunotherapies for bladder cancer: a new hope. Curr Opin Urol. 2015;25:586–596. doi: 10.1097/MOU.0000000000000213. [DOI] [PMC free article] [PubMed] [Google Scholar]
- 3.Carneiro BA, Meeks JJ, Kuzel TM, Scaranti M, Abdulkadir SA, Giles FJ. Emerging therapeutic targets in bladder cancer. Cancer Treat Rev. 2015;41:170–178. doi: 10.1016/j.ctrv.2014.11.003. [DOI] [PubMed] [Google Scholar]
- 4.Anantharaman A, Friedlander T, Lu D, Krupa R, Premasekharan G, Hough J, Edwards M, Paz R, Lindquist K, Graf R, Jendrisak A, Louw J, Dugan L, Baird S, Wang YP, Dittamore R, Paris PL. Programmed death-ligand 1 (PD-L1) characterization of circulating tumor cells (CTCs) in muscle invasive and metastatic bladder cancer patients. BMC Cancer. 2016;16:744. doi: 10.1186/s12885-016-2758-3. [DOI] [PMC free article] [PubMed] [Google Scholar]
- 5.Chism DD. Urothelial carcinoma of the bladder and the rise of immunotherapy. J Natl Compr Canc Netw. 2017;15:1277–1284. doi: 10.6004/jnccn.2017.7036. [DOI] [PubMed] [Google Scholar]
- 6.Ferreira-Teixeira M, Paiva-Oliveira D, Parada B, Alves V, Sousa V, Chijioke O, Münz C, Reis F, Rodrigues-Santos P, Gomes C. Natural killer cell-based adoptive immunotherapy eradicates and drives differentiation of chemoresistant bladder cancer stem-like cells. BMC Med. 2016;14:163. doi: 10.1186/s12916-016-0715-2. [DOI] [PMC free article] [PubMed] [Google Scholar]
- 7.Choudhury NJ, Kiyotani K, Yap KL, Campanile A, Antic T, Yew PY, Steinberg G, Park JH, Nakamura Y, O’Donnell PH. Low T-cell receptor diversity, high somatic mutation burden, and high neoantigen load as predictors of clinical outcome in muscle-invasive bladder cancer. Eur Urol Focus. 2016;2:445–452. doi: 10.1016/j.euf.2015.09.007. [DOI] [PubMed] [Google Scholar]
- 8.Kardos J, Chai S, Mose LE, Selitsky SR, Krishnan B, Saito R, Iglesia MD, Milowsky MI, Parker JS, Kim WY, Vincent BG. Claudin-low bladder tumors are immune infiltrated and actively immune suppressed. JCI Insight. 2016;1:e85902. doi: 10.1172/jci.insight.85902. [DOI] [PMC free article] [PubMed] [Google Scholar]
- 9.Zhou TC, Sankin AI, Porcelli SA, Perlin DS, Schoenberg MP, Zang X. A review of the PD-1/PD-L1 checkpoint in bladder cancer: from mediator of immune escape to target for treatment. Urol Oncol. 2017;35:14–20. doi: 10.1016/j.urolonc.2016.10.004. [DOI] [PubMed] [Google Scholar]
- 10.Ghasemzadeh A, Bivalacqua TJ, Hahn NM, Drake CG. New strategies in bladder cancer: a second coming for immunotherapy. Clin Cancer Res. 2016;22:793–801. doi: 10.1158/1078-0432.CCR-15-1135. [DOI] [PMC free article] [PubMed] [Google Scholar]
- 11.Chen X, Jin Y, Gong L, He D, Cheng Y, Xiao M, Zhu Y, Wang Z, Cao K. Bioinformatics analysis finds immune gene markers related to the prognosis of bladder cancer. Front Genet. 2020;11:607. doi: 10.3389/fgene.2020.00607. [DOI] [PMC free article] [PubMed] [Google Scholar]
- 12.Goodwin Jinesh G, Willis DL, Kamat AM. Bladder cancer stem cells: biological and therapeutic perspectives. Curr Stem Cell Res Ther. 2014;9:89–101. doi: 10.2174/1574888x08666131113123051. [DOI] [PubMed] [Google Scholar]
- 13.Kates M, Sopko NA, Matsui H, Drake CG, Hahn NM, Bivalacqua TJ. Immune checkpoint inhibitors: a new frontier in bladder cancer. World J Urol. 2016;34:49–55. doi: 10.1007/s00345-015-1709-y. [DOI] [PubMed] [Google Scholar]
- 14.Piao XM, Byun YJ, Kim WJ, Kim J. Unmasking molecular profiles of bladder cancer. Investig Clin Urol. 2018;59:72–82. doi: 10.4111/icu.2018.59.2.72. [DOI] [PMC free article] [PubMed] [Google Scholar]
- 15.Chen JB, Zhu YW, Guo X, Yu C, Liu PH, Li C, Hu J, Li HH, Liu LF, Chen MF, Chen HQ, Xiong-Bing Z. Microarray expression profiles analysis revealed lncRNA OXCT1-AS1 promoted bladder cancer cell aggressiveness via miR-455-5p/JAK1 signaling. J Cell Physiol. 2019;234:13592–13601. doi: 10.1002/jcp.28037. [DOI] [PubMed] [Google Scholar]
- 16.Kim J, Akbani R, Creighton CJ, Lerner SP, Weinstein JN, Getz G, Kwiatkowski DJ. Invasive bladder cancer: genomic insights and therapeutic promise. Clin Cancer Res. 2015;21:4514–4524. doi: 10.1158/1078-0432.CCR-14-1215. [DOI] [PMC free article] [PubMed] [Google Scholar]
- 17.Le Goux C, Damotte D, Vacher S, Sibony M, Delongchamps NB, Schnitzler A, Terris B, Zerbib M, Bieche I, Pignot G. Correlation between messenger RNA expression and protein expression of immune checkpoint-associated molecules in bladder urothelial carcinoma: a retrospective study. Urol Oncol. 2017;35:257–263. doi: 10.1016/j.urolonc.2017.01.014. [DOI] [PubMed] [Google Scholar]
- 18.Masson-Lecomte A, Rava M, Real FX, Hartmann A, Allory Y, Malats N. Inflammatory biomarkers and bladder cancer prognosis: a systematic review. Eur Urol. 2014;66:1078–1091. doi: 10.1016/j.eururo.2014.07.033. [DOI] [PubMed] [Google Scholar]
- 19.Sjödahl G, Lövgren K, Lauss M, Chebil G, Patschan O, Gudjonsson S, Månsson W, Fernö M, Leandersson K, Lindgren D, Liedberg F, Höglund M. Infiltration of CD3(+) and CD68(+) cells in bladder cancer is subtype specific and affects the outcome of patients with muscle-invasive tumors. Urol Oncol. 2014;32:791–797. doi: 10.1016/j.urolonc.2014.02.007. [DOI] [PubMed] [Google Scholar]
- 20.Kates M, Nirschl T, Sopko NA, Matsui H, Kochel CM, Reis LO, Netto GJ, Hoque MO, Hahn NM, McConkey DJ, Baras AS, Drake CG, Bivalacqua TJ. Intravesical BCG induces CD4(+) T-cell expansion in an immune competent model of bladder cancer. Cancer Immunol Res. 2017;5:594–603. doi: 10.1158/2326-6066.CIR-16-0267. [DOI] [PMC free article] [PubMed] [Google Scholar]
- 21.Huang J, Lo UG, Wu S, Wang B, Pong RC, Lai CH, Lin H, He D, Hsieh JT, Wu K. The roles and mechanism of IFIT5 in bladder cancer epithelial-mesenchymal transition and progression. Cell Death Dis. 2019;10:437. doi: 10.1038/s41419-019-1669-z. [DOI] [PMC free article] [PubMed] [Google Scholar]
- 22.Mo Q, Nikolos F, Chen F, Tramel Z, Lee YC, Hayashi K, Xiao J, Shen J, Chan KS. Prognostic power of a tumor differentiation gene signature for bladder urothelial carcinomas. J Natl Cancer Inst. 2018;110:448–459. doi: 10.1093/jnci/djx243. [DOI] [PMC free article] [PubMed] [Google Scholar]
- 23.Rosenberg JE, Hoffman-Censits J, Powles T, van der Heijden MS, Balar AV, Necchi A, Dawson N, O’Donnell PH, Balmanoukian A, Loriot Y, Srinivas S, Retz MM, Grivas P, Joseph RW, Galsky MD, Fleming MT, Petrylak DP, Perez-Gracia JL, Burris HA, Castellano D, Canil C, Bellmunt J, Bajorin D, Nickles D, Bourgon R, Frampton GM, Cui N, Mariathasan S, Abidoye O, Fine GD, Dreicer R. Atezolizumab in patients with locally advanced and metastatic urothelial carcinoma who have progressed following treatment with platinum-based chemotherapy: a single-arm, multicentre, phase 2 trial. Lancet. 2016;387:1909–1920. doi: 10.1016/S0140-6736(16)00561-4. [DOI] [PMC free article] [PubMed] [Google Scholar]
- 24.Pettenati C, Ingersoll MA. Mechanisms of BCG immunotherapy and its outlook for bladder cancer. Nat Rev Urol. 2018;15:615–625. doi: 10.1038/s41585-018-0055-4. [DOI] [PubMed] [Google Scholar]
- 25.Long X, Xiong W, Zeng X, Qi L, Cai Y, Mo M, Jiang H, Zhu B, Chen Z, Li Y. Cancer-associated fibroblasts promote cisplatin resistance in bladder cancer cells by increasing IGF-1/ERbeta/Bcl-2 signalling. Cell Death Dis. 2019;10:375. doi: 10.1038/s41419-019-1581-6. [DOI] [PMC free article] [PubMed] [Google Scholar]
- 26.Pichler R, Fritz J, Zavadil C, Schafer G, Culig Z, Brunner A. Tumor-infiltrating immune cell subpopulations influence the oncologic outcome after intravesical bacillus calmette-guerin therapy in bladder cancer. Oncotarget. 2016;7:39916–39930. doi: 10.18632/oncotarget.9537. [DOI] [PMC free article] [PubMed] [Google Scholar]
- 27.Ratner M. Genentech’s PD-L1 agent approved for bladder cancer. Nat Biotechnol. 2016;34:789–790. doi: 10.1038/nbt0816-789. [DOI] [PubMed] [Google Scholar]
- 28.Wu L, Zhang M, Qi L, Zu X, Li Y, Liu L, Chen M, Li Y, He W, Hu X, Mo M, Ou Z, Wang L. ERalpha-mediated alterations in circ_0023642 and miR-490-5p signaling suppress bladder cancer invasion. Cell Death Dis. 2019;10:635. doi: 10.1038/s41419-019-1827-3. [DOI] [PMC free article] [PubMed] [Google Scholar]
- 29.Ren R, Tyryshkin K, Graham CH, Koti M, Siemens DR. Comprehensive immune transcriptomic analysis in bladder cancer reveals subtype specific immune gene expression patterns of prognostic relevance. Oncotarget. 2017;8:70982–71001. doi: 10.18632/oncotarget.20237. [DOI] [PMC free article] [PubMed] [Google Scholar]
- 30.Knollman H, Godwin JL, Jain R, Wong YN, Plimack ER, Geynisman DM. Muscle-invasive urothelial bladder cancer: an update on systemic therapy. Ther Adv Urol. 2015;7:312–330. doi: 10.1177/1756287215607418. [DOI] [PMC free article] [PubMed] [Google Scholar]
- 31.Sfakianos JP, Galsky MD. Neoadjuvant chemotherapy in the management of muscle-invasive bladder cancer: bridging the gap between evidence and practice. Urol Clin North Am. 2015;42:181–187. doi: 10.1016/j.ucl.2015.01.002. [DOI] [PubMed] [Google Scholar]
- 32.Zhang H, Prado K, Zhang KX, Peek EM, Lee J, Wang X, Wang X, Huang J, Li G, Pellegrini M, Chin AI. Biased expression of the FOXP3delta3 isoform in aggressive bladder cancer mediates differentiation and cisplatin chemotherapy resistance. Clin Cancer Res. 2016;22:5349–5361. doi: 10.1158/1078-0432.CCR-15-2581. [DOI] [PubMed] [Google Scholar]
- 33.Lázaro M, Gallardo E, Doménech M, Pinto Á, González-del-Alba A, Del Alba AG, Puente J, Fernández O, Font A, Lainez N, Vázquez S. SEOM clinical guideline for treatment of muscle-invasive and metastatic urothelial bladder cancer (2016) Clin Transl Oncol. 2016;18:1197–1205. doi: 10.1007/s12094-016-1584-z. [DOI] [PMC free article] [PubMed] [Google Scholar]
- 34.Singh P, Black P. Emerging role of checkpoint inhibition in localized bladder cancer. Urol Oncol. 2016;34:548–555. doi: 10.1016/j.urolonc.2016.09.004. [DOI] [PubMed] [Google Scholar]
- 35.Mitra AP, Lerner SP. Potential role for targeted therapy in muscle-invasive bladder cancer: lessons from the cancer genome atlas and beyond. Urol Clin North Am. 2015;42:201–215. doi: 10.1016/j.ucl.2015.01.003. [DOI] [PubMed] [Google Scholar]
Associated Data
This section collects any data citations, data availability statements, or supplementary materials included in this article.


