Abstract
This study aimed to explore immune-related lncRNAs for predicting the overall survival of patients with colon adenocarcinoma. RNA-sequencing data were downloaded from the TCGA data portal. The immune-related lncRNAs with differential expression were identified with Cox and LASSO regression analysis. With the stepwise regression analysis, a seven lncRNA signature was established for calculating the Risk Score with following formula: Risk Score = [Expression level of AC027307.2 * (0.156)] + [Expression level of AC074117.1 * (0.294)] + [Expression level of AC103702.2 * (-0.025)] + [Expression level of CYTOR * (0.205)] + [Expression level of LINC02381 * (0.251)] + [Expression level of MIR200CHG * (0.052)] + [Expression level of SNHG16 * (-0.101)]. The Risk Score was validated with survival analysis, achieving moderate area under the curve (AUC) of receiver operating characteristic (ROC) curve over 0.7. GSEA and immune-cell abundance analysis further supported the involved lncRNAs were immune-relevant. Finally, the prognosis prediction efficacy was verified with clinical samples with an AUC of 0.674 in ROC curve. Both the Risk Score and involved immune-related lncRNAs presented promising clinical significance.
Keywords: LncRNA, overall survival, colon cancer, immune-related gene
Introduction
Based on the World Health Organization reports, colorectal cancer (CRC) has been one of the most common cancers all around the world, with an incidence of over 9% in all cancer types [1]. The epidemiology analysis revealed that the development of CRC was causally associated with genetic, nutritional and environmental factors [2-4]. CRC presented high incidence and mortality in both developed and developing countries [5].
The burden of CRC can be effectively lowered via early diagnosis and timely intervention. The CRC related morbidity and mortality can be substantially reduced with targeted screening, such as the early screening conducted in high-risk population before clinical symptoms. The therapy would be easier and more economic, with higher success rate [6,7]. The epidemical analysis revealed some characteristics of high-risk CRC patients, such as increasing age (older than 40 years), male, and a family history of CRC [8]. However, epidemiological investigation based on patients characteristics was too general and lack of accuracy, while the specific test such as colorectal polyps pathological examination [9] would be more practical. The examination based on CRC specific biomarkers has become another appropriate option [10].
Long non-coding RNAs (LncRNAs) are a series of non-coding RNA molecules with the length of longer than 200 nucleotides. LncRNAs have been proved to participate in cell differentiation and development [11]. LncRNAs have also been intensively involved in the cancer progression. Several reviews have summarized the cancer associated lncRNAs, as well as their roles and functions [12]. The main function of lncRNAs seemed to regulate the transcription of protein coding genes, via changing chromatin state [12]. Another interesting function of lncRNA was the involvement of competitive endogenous RNA (ceRNA) regulation network, in which lncRNAs competed with another RNA or protein for combining with its natural target [13]. The regulatory effects of lncRNAs have been investigated in various malignancies [12]. LncRNAs have been proposed as good biomarkers in cancer diagnosis and therapeutics [10,14]. Immune-related genes (IRGS), including both immune-related mRNA and lncRNAs, have participated in the regulation of systemic immune response. IRGs provided innovative insight in exploring the mechanism of cancer immunotherapy. Some IRGs have been verified as promising biomarkers for predicting the treatment efficacy of cancer [15,16].
Colon adenocarcinoma (COAD) is a type of cancer that started in the colon and rectum. There are different types of colon and rectal cancer, but adenocarcinoma is the most observed CRC, presented malignance and poor prognosis. Adenocarcinoma was the precursor of CRC. This study aimed to explore immune-related lncRNA signature for survival prediction in patients with COAD. Firstly, with the RNA-sequencing data obtained from TCGA, the immune-related mRNAs were screened. Based on the co-expression analysis, immune-related mRNAs with significantly differential expression were screened. Secondly, the clinical information was also obtained for patients with COAD. They were divided in Training and Test cohorts. In the Train cohort, the overall survival (OS)-associated lncRNAs were identified with univariate Cox analysis and followed by LASSO regression analysis. The stepwise regression analysis was then applied to further determine the model of Risk Score, which can be calculated by the formula consist of the involved lncRNAs and their coefficients. Thirdly, the Risk Score was validated to show practical significance in survival analysis. The Risk Score was further supported by its relationship with clinicopathological factors, the GSEA analysis and immune cells abundance analysis. Finally, the seven immune-related lncRNA signature was validated with the clinical COAD specimens.
Materials and methods
Data resource
Transcriptome RNA-sequencing data of TCGA-COAD were downloaded from the TCGA data portal, including 473 cases of COAD tumor tissues and 41 cases of normal tissues. The Fragments per Kilobase Million (FPKM) expression profiling data was applied for analysis. The clinical data and demographic information were obtained from the TCGA database. Expression profiling matrix of both encoding gene and lncRNA were extracted with Perl.
Identification of survival associated lncRNAs
Differentially expressed lncRNAs and immune-related lncRNAs
Differentially expressed lncRNAs between COAD and normal control were screened with Limma package and presented with Pheatmap package in R software. The differentially expressed lncRNAs were determined with the following cutoff value: false discovery rate = 0.05, log2 |fold change| = 1. The immune-related mRNAs were firstly identified from the background gene set list of two immune-related pathways (Immune_Response.gmt and Immune_System_process.gmt) from Molecular Signatures Database V7.0. A total of 332 immune-related mRNAs were included in the obtained immune-gene list. The expression profiling matrix of the 332 IRGs was extracted with R software. LncRNAs with average expression less than 0.5 was removed previously with Limma package in R software. Then, the correlation test between immune-related mRNAs and lncRNAs was performed with Cor.test in R software. The lncRNAs were included (Pearson correlation coefficient > 0.3, P < 0.001). The finally immune-related lncRNAs with differential expression were identified combining the differentially expressed lncRNAs and immune-related lncRNAs.
Train cohort and test cohort
The OS was taken as the endpoint for indicating the prognostic outcome. Only cases with follow-up period longer than 30 days were included. In the 421 cases of COAD samples, 417 samples were finally included with a follow-up ranged 30~3042 days. All the patients were randomly grouped into Train cohort (n = 293) and Test (n = 124) cohort according to a ratio of 7:3 with caret package in R software. In the Train cohort, univariate Cox analysis was applied to evaluate OS related lncRNAs, with P < 0.01. The hazard ratios (HRs) were calculated and expressed with forest plot. LASSO regression analysis was further performed to explore the key lncRNAs.
Construction of risk score calculation formula
After the survival-associated IRGs were screened by univariate Cox analysis and LASSO regression analysis, the stepwise regression analysis was further applied to construct the survival prediction signature with the R software (direction = “both”). In the optimized model, the lncRNAs and corresponding coefficients were presented and the formula for calculating the prognostic index based on immune-related lncRNAs (designated as Risk Score) was obtained. The HRs and P values of all included survival associated lncRNAs were also provided and presented with forest plot.
Validation of risk score
Survival analysis (train and test cohorts)
For the patients in both Train cohort and Test cohort, the Risk Score was calculated based on the expression level of included immune-related lncRNAs and their corresponding coefficients. The patients could be classified as high-risk and low-risk groups. The survival analysis of patients in high-risk and low-risk groups was performed with survival package in R software. The 5-year receiver operating curve (ROC) curve was plotted. Area under curve (AUC) of the ROC curve was calculated. The independent prognostic analysis was performed in both Train and Test cohorts. The univariate and multivariate regression analysis was applied to evaluate the correlation between OS and age, gender, stage, TNM (Tumor, Lymph node, Metastasis) and Risk Score, using survival package in R software. The HR was calculated and expressed with forest plot.
Relationships with clinicopathological factors
The bee swarm package and T test in R software was involved to explore the relationships between the Risk Score and clinical general characteristics, including age, gender, stage, and TNM. The association between single gene and above clinical characteristics was also analyzed. P < 0.05 indicated statistical significance.
GSEA analysis
The Gene Set Enrichment Analysis was performed with GSEA 4.0.1 for investigating the potential mechanisms involved in high-risk and low-risk groups. The background gene set was obtained from Immune_Response.gmt and Immune_System_process.gmt.
Immune cells abundance
The infiltration levels of 22 kinds of immune cells in high-risk and low-risk COAD patients were calculated with cibersort package in R software. After excluding samples with P ≥ 0.05, 85 low-risk and 107 high-risk samples were included in the analysis of immune cell content.
Exploration of lncRNA function
Immune-related lncRNAs based regulatory network
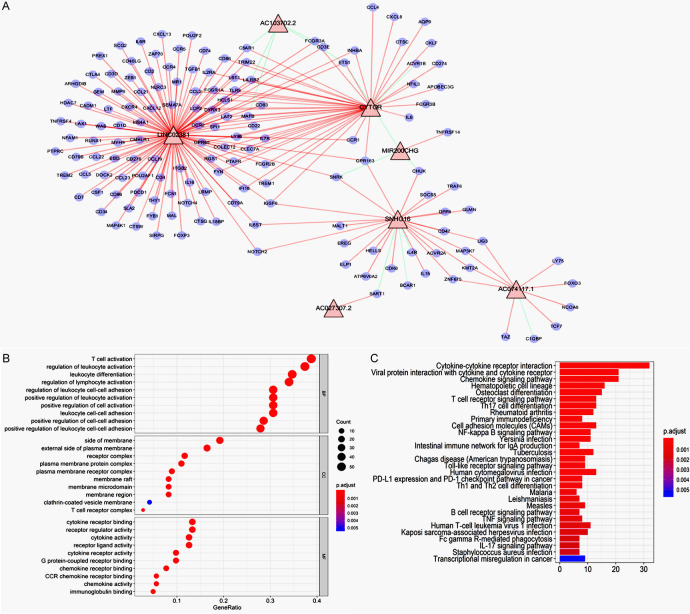
The co-expression analysis between lncRNAs included in the Risk Score calculation and 332 immune-related mRNAs was performed with the function of Cor.test in R software. The mRNA with Pearson coefficient > 0.3 and P < 0.05 was screened. The co-expression network between identified mRNAs and lncRNAs was performed with Cytoscape 3.7.0 software. Red line and green line indicated positive and negative correlation, respectively.
GO and KEGG enrichment
Gene functional analyses were performed via the GO and KEGG pathways enrichments with clusterprofiler package in R software.
Validation of 7 immune-related lncRNA signatures with clinical specimens
The prognostic prediction significance of Risk Score was further verified in clinical samples collected in Department of General Surgery, Shengjing Hospital, China Medical University. Eighty (80) samples were collected between 2016~2019, from patients pathologically diagnosed with COAD. The tumor and adjacent normal tissues were obtained during the tumor resection surgery. All the tissues were retrospectively analyzed with rt-PCR using primers of identified lncRNAs (sequence provided in Supplementary Materials). The rt-PCR was also performed on 31 pairs of tumor and adjacent normal tissues. The expression levels of lncRNAs were normalized with that of the internal control gene. Then, the Risk Score of these patients were calculated with the formula and classified as high and low risk (with the median value as cutoff value). Kaplan-Meier survival analysis was performed. The 3-year ROC curve was plotted, and AUC of ROC was calculated with the survival ROC package in R software. The inform consent has been obtained from all participants.
Results
Data processing
The bioinformatic analysis was performed according to the flow chart (Scheme 1). Firstly, RNA-sequencing data of COAD was obtained from TCGA database, as well as the clinical data and demographic information. Secondly, the differentially expressed immune-related lncRNAs were screened combining the differentially expressed lncRNAs and immune-related lncRNAs. Thirdly, the COAD cases were divided in Train cohort and Test cohort. In the Train cohort, the OS-associated lncRNAs were sequentially screened with univariate Cox regression and LASSO regression. The Risk Score was calculated with the model constructed in stepwise regression analysis, consisting of both survival-associated lncRNAs and corresponding coefficient. Thirdly, the Risk Score was verified with survival analysis both in Train and Test cohorts. In addition, the results were supported by independent prognostic analysis, the relationship between Risk Score with clinicopathological factors, the GSEA analysis and immune cells abundance analysis. Finally, the immune-related lncRNA signature was validated with clinical cases of COAD collected in our hospital.
Scheme 1.
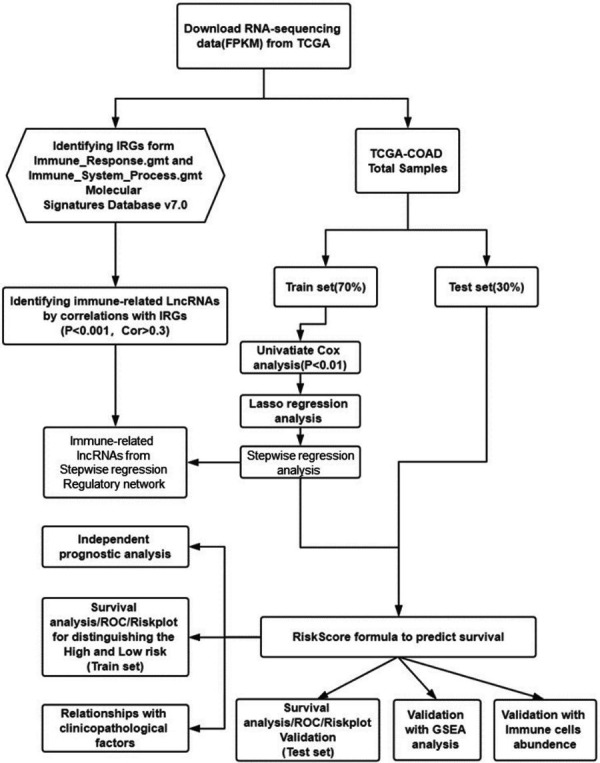
The bioinformatic analysis process.
Survival associated lncRNAs
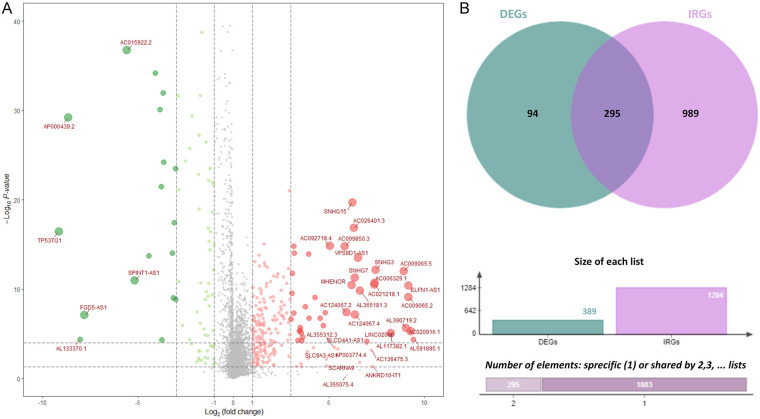
The RNA-sequencing data of COAD was downloaded from TCGA database. Three hundred-eighty-nine (389) differentially expressed lncRNAs were firstly screened (Figure 1A). Then the immune-related lncRNAs were identified. The immune-related mRNAs were obtained from the shared background gene set list of Immune_Response.gmt and Immune_System_process.gmt. A total of 332 immune-related mRNAs were obtained. The expression profiling matrix of the 332 IRGs was extracted with R software. Correlation test was performed for identifying lncRNAs associated with immune-related mRNAs, with correlation coefficient > 0.3 and P < 0.001. A total of 1284 immune-related lncRNAs were identified. Then, 295 shared immune-related lncRNAs with differential expression were screened combining 389 differentially expressed lncRNAs and 1284 immune-related lncRNAs (Figure 1B).
Figure 1.
Immune-related lncRNAs with differential expression. A. LncRNAs with differential expression. Green bubbles represented down-regulated lncRNAs and red bubbles represented up-regulated lncRNAs. The diameter of bubbles reflected the fold change. B. The combination of differentially expressed lncRNAs and immune-related lncRNAs. There were 295 differentially expressed immune-related lncRNAs.
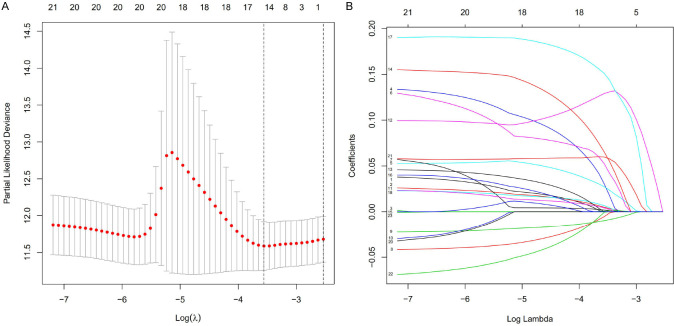
The 295 immune-related lncRNAs was further screened with univariate Cox analysis. OS was taken as the endpoint for indicating the prognostic outcome. For the 421 COAD cases, 417 cases were finally included, with the follow-up ranged 30~3042 days. The 417 cases were randomly grouped into Train cohort (n = 293) and Test cohort (n = 124) according to a ratio of 7:3. In the Train cohort, 295 immune-related lncRNAs with differential expression were further filtered with univariate Cox analysis for identifying OS related lncRNAs (Figure 2). A total of 23 lncRNAs significantly correlated with survival time were screened (P < 0.05). LASSO regression analysis was further performed and 15 key lncRNAs were identified (Figure 3).
Figure 2.
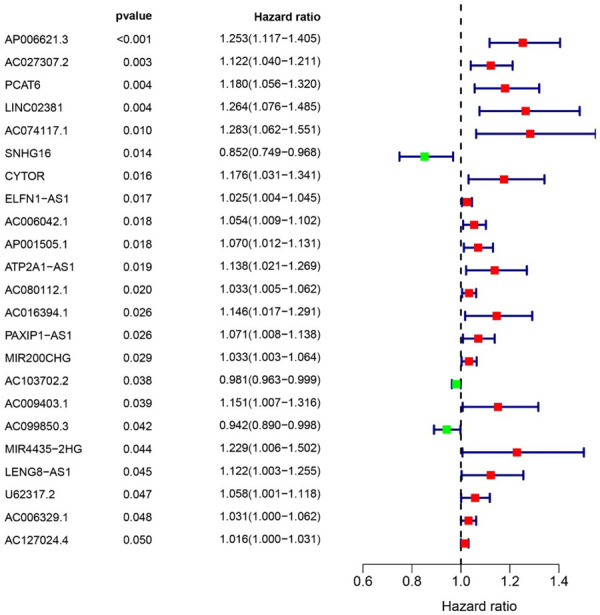
Univariate Cox analysis of survival associated immune-related lncRNAs with differential expression. Left: There were 23 lncRNAs significant in univariate Cox analysis (P < 0.05). Right: The HRs of lncRNAs. Red dot indicated HR was greater than 1.0, and green dot indicated HR was less than 1.0.
Figure 3.
LASSO regression analysis of OS-associated immune-related lncRNAs with differential expression. A. Selection of tuning parameter (lambda). The dashed lines on the left and right indicated the “lambda.min” and “lambda.1se” criteria. B. Dynamic LASSO coefficient profiling.
Identification of lncRNAs based risk score
For the 15 identified key lncRNAs, the model was further established with the step wise regression analysis (Figure 4). In the optimized model, the AIC was 592.27 and Concordance index was 0.7 (P < 0.001). Seven immune-related lncRNAs were finally included in the model (designated as Risk Score), and their corresponding coefficients were presented (Table 1). The Risk Score was calculated with the following formula: Risk Score = [Expression level of AC027307.2 * (0.156)] + [Expression level of AC074117.1 * (0.294)] + [Expression level of AC103702.2 * (-0.025)] + [Expression level of CYTOR * (0.205)] + [Expression level of LINC02381 * (0.251)] + [Expression level of MIR200CHG * (0.052)] + [Expression level of SNHG16 * (-0.101)] (P < 0.01). Corresponding HRs and P value for each included gene was also provided. The P value for AC027307.2, AC074117.1, AC103702.2, CYTOR, LINC02381 and MIR200CHG was less than 0.05 (Table 1). The result indicated that the six lncRNAs were also significantly independent prognostic indicators.
Figure 4.
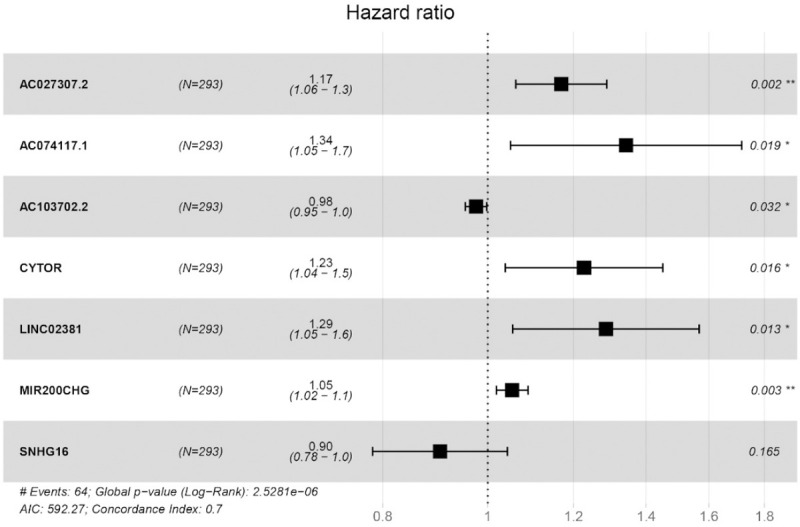
Stepwise regression analysis of survival associated immune-related lncRNAs and a total of seven lncRNAs were included in the obtained model. In the optimized model, the AIC was 592.27 and Concordance index was 0.7 (P < 0.001).
Table 1.
The identified survival associated immune-related lncRNAs with respective coefficient
| LncRNA | coefficient | HR | HR.95L | HR.95H | p value |
|---|---|---|---|---|---|
| AC027307.2 | 0.1563 | 1.1692 | 1.0615 | 1.2877 | 0.0015 |
| AC074117.1 | 0.2941 | 1.3419 | 1.0495 | 1.7157 | 0.0190 |
| AC103702.2 | -0.0248 | 0.9755 | 0.9537 | 0.9979 | 0.0322 |
| CYTOR | 0.2047 | 1.2271 | 1.0381 | 1.4506 | 0.0165 |
| LINC02381 | 0.2512 | 1.2856 | 1.0544 | 1.5675 | 0.0130 |
| MIR200CHG | 0.0520 | 1.0533 | 1.0184 | 1.0895 | 0.0025 |
| SNHG16 | -0.1014 | 0.9036 | 0.7830 | 1.0428 | 0.1654 |
Validation of prognostic prediction of risk score
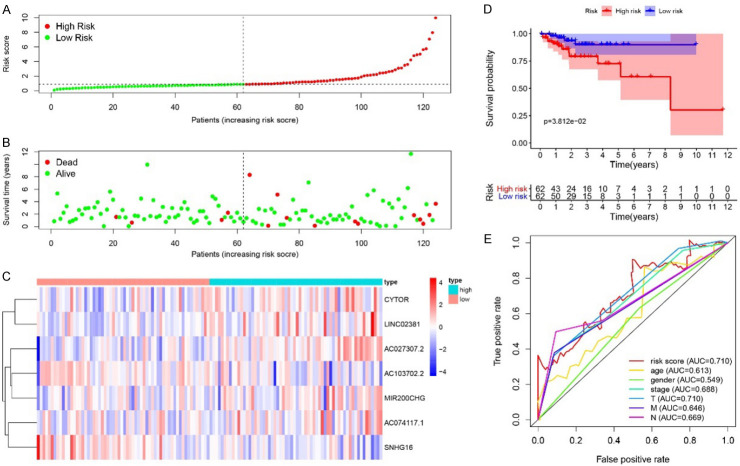
For the patients in Train cohort, Risk Score was calculated with above formula, based on the expression levels of seven involved lncRNAs. With the median Risk Score as cutoff, the patients in Train cohort can be classified into high-risk and low-risk groups (Figure 5A). The distribution of survival status of all cases was also presented (Figure 5B). The heatmap displayed expression profiles of 7 lncRNAs in high-risk and low-risk patients. The expression tendency of 7 lncRNAs were consistent with their corresponding coefficients in Risk Score calculation formula. The Risk Score was elevated with increased expression levels of AC027307.2, AC074117.1, CYTOR, LINC02381 and MIR200CHG, while it was declined with increased expression levels of AC103702.2 and SNHG16 (Figure 5C). Kaplan-Meier survival analysis of the Risk Score indicated that the survival probability of patients in high-risk and low-risk groups can be significantly distinguished (P < 0.001) (Figure 5D). Further, 5-year ROC curves of Risk Score, age, gender, stage, and TNM were applied to evaluate the prognostic prediction efficiency. Risk Score showed an AUC of 0.844, which was higher than that of other indicators, indicating better prognostic prediction effectiveness (Figure 5E). The Risk Score was validated in the patients in Test cohort, similar results can be obtained (Figure 6).
Figure 5.
Risk Score in Train cohort. A. The rank of calculated Risk Score. B. The survival status and survival time. C. Heatmap of expression of 7 lncRNAs. D. Kaplan-Meier survival curve of the patients in high-risk and low-risk groups. E. 5-year ROC curve of Risk Score, age, gender, stage, TNM. With the increased Risk Score, the mortality rate was increased. The KM survival curves of the high-risk and low-risk groups were significantly different. CYTOR, LINC02381, AC027307.2, MIR200CHG, AC074117.1 were up-regulated in the high-risk group, and SNHG16, AC103702.2 were down-regulated in the high-risk group. The 5-year ROC indicated an AUC of 0.844 for the Risk Score in risk prediction, which was better than that of age, gender, stage, and TNM.
Figure 6.
Risk Score in Test cohort. A. The rank of calculated Risk Score. B. The survival status and survival time. C. Heatmap of expression of 7 lncRNAs. D. Kaplan-Meier survival curve of the patients in high-risk and low-risk groups. E. 5-year ROC curve of Risk Score, age, gender, stage, TNM. With the increased Risk Score, the mortality rate was increased. The KM survival curves of the high-risk and low-risk groups were significantly different. CYTOR, LINC02381, AC027307.2, MIR200CHG, AC074117.1 were up-regulated in the high-risk group, and SNHG16, AC103702.2 were down-regulated in the high-risk group. The 5-year ROC indicated an AUC of 0.710 for the Risk Score in risk prediction, which was better than that of age, gender, stage, and TNM.
The independent prognostic prediction efficacy of Risk Score was evaluated (Figure 7). Patients in both Train and Test cohorts were divided by clinical characteristics, including age, gender, stage, TNM, respectively. Both the univariate Cox analysis and multivariate Cox analysis indicated that Risk Score could be significantly related to OS, independent of age, gender, stage and TNM (P < 0.05 for all). The Risk Score was verified as independent predictor for good prognosis, irrespective of clinical characteristics.
Figure 7.
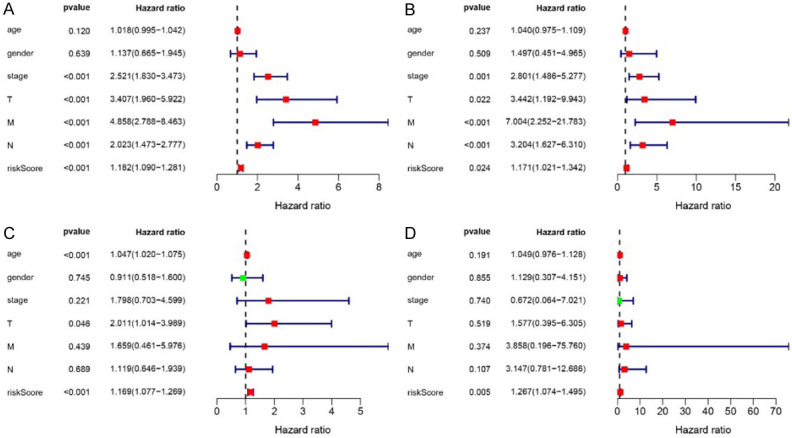
Independent prognostic analysis of Risk Score. Univariate (A, B) and multivariate survival analysis (C, D) of Train and Test cohorts. In both Train and Test cohorts, the Risk Score was significant in univariate (P < 0.001) and multivariate survival analysis (P = 0.005). It was an independent prognostic factor independent of age, gender, stage, and TNM.
Besides of the synthetic Risk Score, the relationship between each involved lncRNA and clinical characteristics was also evaluated. The included clinical characteristics were age, gender, stage, TNM. T test was conducted to find the relationships between lncRNAs and each clinical character (Table 2). Based on the results, the expression level of AC027307.2 and AC074117.1 was negatively associated with T, N and M (P < 0.05 for all). The level of AC103702.2 was negatively associated with gender (P < 0.05). The level of LINC02381 was positively related to age while negatively related to T (P < 0.05). The level of SNHG16 was negatively associated with age while positively associated with N (P < 0.05). Finally, the Risk Score itself was significantly and negatively associated with stage and T, while positively related to N (P < 0.05 for all).
Table 2.
Relationships of lncRNAs with clinicopathological factors
| LncRNA | Age | Gender | Stage | T | M | N |
|---|---|---|---|---|---|---|
| AC027307.2 | -0.845 (0.398) | -0.26 (0.795) | -3.017 (0.003)* | 0.133 (0.894) | -2.431 (0.017)* | -2.347 (0.019)* |
| AC074117.1 | 1.771 (0.078) | -0.769 (0.443) | -2.915 (0.004)* | -1.104 (0.272) | -2.858 (0.006)* | -2.739 (0.007)* |
| AC103702.2 | -0.269 (0.788) | -1.984 (0.048)* | -0.127 (0.899) | -0.241 (0.810) | -1.151 (0.253) | 0.366 (0.714) |
| CYTOR | -1.688 (0.092) | 0.095 (0.925) | -1.323 (0.187) | -0.846 (0.400) | -0.599 (0.551) | -1.755 (0.080) |
| LINC02381 | 2.117 (0.036)* | 0.761 (0.447) | -1.199 (0.231) | -2.15 (0.033)* | -0.855 (0.396) | -1.601 (0.110) |
| MIR200CHG | -1.066 (0.287) | -0.011 (0.991) | 0.765 (0.445) | -0.373 (0.710) | 0.841 (0.403) | 0.451 (0.653) |
| SNHG16 | -2.178 (0.030)* | -0.738 (0.461) | 1.812 (0.071) | 1.63 (0.106) | 0.994 (0.323) | 2.311 (0.021)* |
| riskScore | 0.833 (0.406) | -0.487 (0.627) | -1.989 (0.048)* | -2.082 (0.038)* | -1.403 (0.166) | -2.041 (0.043)* |
indicated P < 0.05.
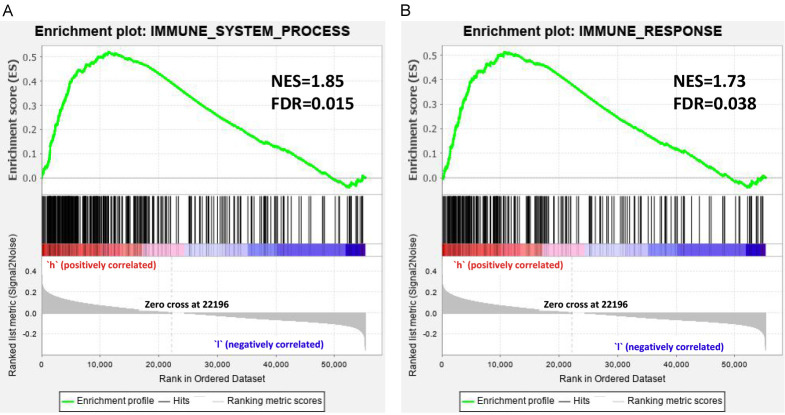
The GSEA was conducted for further investigating potential biological functions. The GSEA was performed in high-risk and low-risk patients, with the background gene sets of immune_response and immune_system_process (Figure 8). For both two gene sets, enrichment was more obvious in high-risk patients than that of in low-risk patients. In the gene sets of immune_response, the Normalized enrichment score (NES) was 1.85 and false discovery rate (FDR) was 0.015. In gene sets of immune_system_process, NES was 1.73 and FDR was 0.038. The results indicated that the two immune-associated gene-sets were more active in high-risk patients.
Figure 8.
Gene Set Enrichment Analysis for high-risk and low-risk patients classified with Risk Score. The results of GSEA indicated that Immune_response and immune_system_process was more active in the high-risk group (FDR < 0.05). NES: Normalized enrichment score; FDR: false discovery rate.
The infiltration levels of 22 types of immune cells were calculated and the samples with P ≥ 0.05 was removed. The infiltration levels of 22 types of immune cells in 85 low-risk patients and 107 high-risk patients were compared. In the high-risk group, T cells CD4 memory resting was significantly decreased (P = 0.005), Dendritic cells activated was significantly decreased (P = 0.026), Mast cells resting was increased significantly (P = 0.027), and Mast cells activated was significantly decreased (P = 0.031) (Figure 9).
Figure 9.
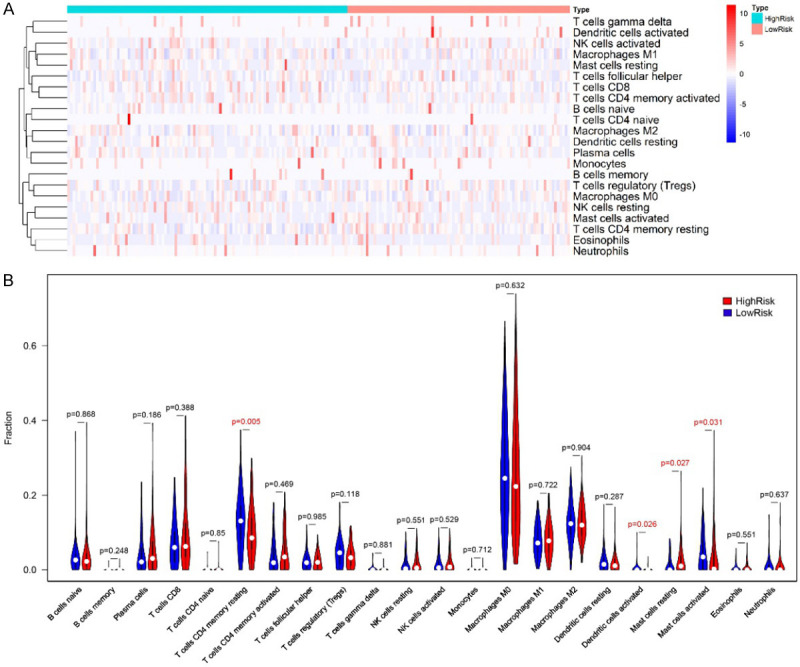
The infiltration levels comparison of 22 types of immune cells in high-risk and low-risk patients. (A) Heatmap, (B) violin plot. In the high-risk group, the infiltration level of T cells CD4 memory resting was significantly decreased (P = 0.005), Dendritic cells activated was significantly decreased (P = 0.026), Mast cells resting was increased significantly (P = 0.027), and Mast cells activated was significantly decreased (P = 0.031), compared to that of in low-risk group.
Exploration of lncRNA function
LncRNA/mRNA co-expression network provided information for understanding the interaction network between lncRNA and mRNA, which helped us further exploring the significant target biomarkers. The co-expression network was constructed between 7 lncRNAs and 332 immune-related mRNAs. The obtained network included 198 connections between 7 lncRNAs and 147 immune-related mRNAs (Figure 10A). LINC02381 showed most connections with included immune-related mRNAs, which may play an important role. The GO and KEGG analysis of 147 involved immune-related mRNAs was performed (Figure 10B, 10C). The most enriched GO terms were: T cell activation, side of membrane and cytokine receptor binding for biological process, cellular component, and molecular function. The top three enriched KEGG pathways included cytokine-cytokine receptor interaction, viral protein interaction with cytokine and cytokine receptor and T cell receptor signaling pathway.
Figure 10.
(A) The construction of co-expression network of survival associated Immune-related lncRNAs. Note: blue cycle indicated immune-related genes, red triangle indicated the 7 identified survival associated Immune-related lncRNAs. Red line indicated positive correlation and green line indicated negative correlation. GO (B) and KEGG (C) analysis of 147 involved genes co-expressed with the 7 identified lncRNAs.
Validation of prognostic prediction of risk score in clinical specimens
The prognostic prediction significance of Risk Score was further verified in clinical samples collected in our hospital during 2016~2019. Eighty (80) cancerous samples were retrospectively analyzed with rt-PCR (Figure 11A). The patients were divided into high-risk and low-risk groups with the median Risk Score as cutoff. Compared to low-risk cases, the expression levels of AC103702.2 and SNHG16 in cancerous tissues was significantly lower in high-risk cases, while the expression levels of AC027307.2, CYTOR, LINC02381 and MIR200CHG were significantly higher (P < 0.05). The expression tendency of the six differentially expressed lncRNAs in high-risk and low-risk cases was consistent with their coefficients in Risk Score calculation formula. Then, the Risk Scores of these patients were calculated with the formula based on the determined expression levels. Kaplan-Meier analysis was performed, and the 80 patients can be significantly classified as high-risk and low-risk groups. The 3-year ROC curve was plotted, and the AUC was calculated as 0.674, indicating a good efficacy in prognostic prediction. The expression levels of 7 lncRNAs were also detected in 31 pairs of tumor and adjacent normal tissues. Compared to normal tissues, the expression levels were significantly higher for AC027307.2 (P < 0.01), AC074117.1 (P < 0.05), CYTOR (P < 0.01), MIR200CHG (P < 0.05) and SNHG16 (P < 0.01) in tumor tissues (Figure 12). Except for SNHG16, the expression tendency of the other lncRNAs with significantly differential expression was consistent with their coefficients in Risk Score calculation formula.
Figure 11.
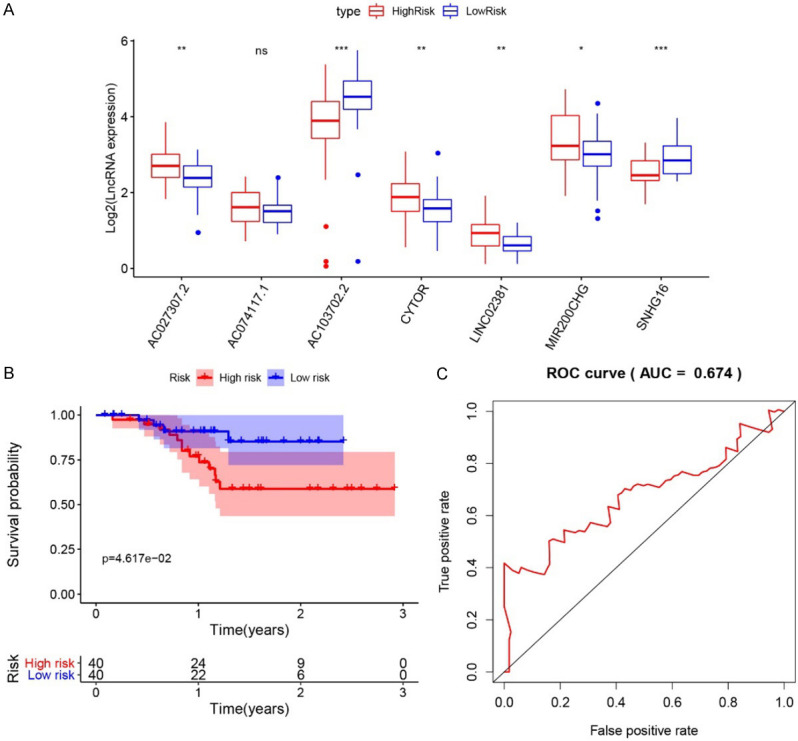
A. The expression level of seven identified lncRNAs in tissues of high-risk and low-risk patients. Note: * indicated P < 0.05; ** indicated P < 0.01, and *** indicated P < 0.001; “ns” indicated not significant. B. Kaplan-Meier survival analysis of the low-risk and high-risk groups. C. 3-year ROC curve.
Figure 12.
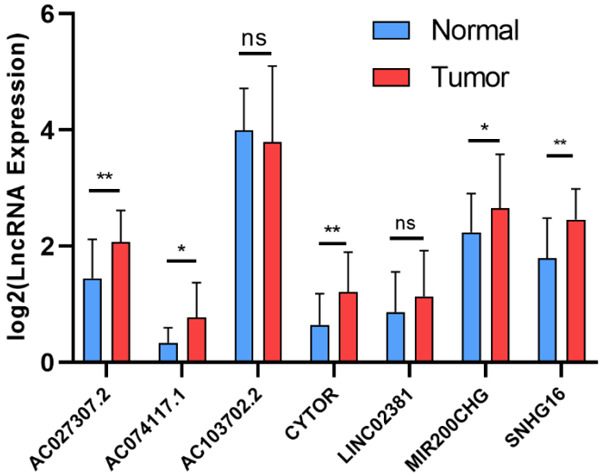
The expression level of seven identified lncRNAs in tumors and adjacent normal tissues. Note: * indicated P < 0.05; ** indicated P < 0.01, and *** indicated P < 0.001; “ns” indicated not significant.
Discussion
Biomarkers have been a series of molecules intrinsically associated with the tumorgenesis and cancer progression, including biochemical small molecule, protein, nucleic acid and so on. These biomarkers can be applied in tumor classification, treatment response assessment and prognostic prediction [17]. Some CRC specific biomarkers have been applied in non-invasive tests, including blood CEA, CA 19-9, CA 72-4 etc. The newfound prognostic biomarkers have been mainly applied in tumor molecular analysis, including MSI, chromosome 18q loss of heterozygosity, p53, KRAS, BRAF, NRAS, PIK3CA mutations, PTEN expression, UGT1A1 gene polymorphism, and ezrin protein [18]. The NCCN Clinical Practice Guidelines in Oncology for CRC have incorporated the genetic biomarkers for clinical management of patients with CRC [19]. The mismatch repair (MMR) protein, KRAS mutational analysis and BRAF mutational analysis have been such emerging biomarkers. Considering the complexity of CRC, various kinds of markers would be also necessary. The molecular biomarkers for evaluating CRC have been updated by expert consensus in 2017 [20]. Some developing biomarkers with significant association with clinical end point were included in randomized clinical study, such as gene expression profile in tumorous tissues and circulating tumor cells in peripheral blood [17]. In short, the validated biomarkers specific for CRC have been still limited, which may be not sufficient for supporting the diagnosis and therapeutic requirements.
Some lncRNAs based molecule diagnostic approaches have been explored in recent years. In a study based on feature selection procedure and classification model, eight lncRNAs of XXbac-B476C20.9, PP7080, CDKN2B-AS1, LINC00092, CA3-AS1, HAND2-AS1, CTD-2269F5.1, and LINC01082 were selected as optimal biomarkers for the diagnosis of COAD [21]. Another study conducted with Cox regression and Robust likelihood-based survival model explored prognostic signature of CRC, and a seven-lncRNA signature was established to predict prognosis of patients with CRC, in which the involved lncRNAs were CTD-2354A18.1, NR2F1-AS1, AC073283.1, MIR31HG, AL132709.8, RP11-834C11.4 and AC069278.4 [22]. Different from previous studies, our study focused on the immune-related lncRNAs. The univariate Cox analysis, LASSO regression analysis and stepwise regression analysis were conducted for synthetically screening the survival-associated lncRNAs. Finally, a survival associated signature consisted of 7 lncRNAs was constructed for patients with COAD, including AC027307.2, AC074117.1, AC103702.2, CYTOR, LINC02381, MIR200CHG, and SNHG16. A formula was established for obtaining the Risk Score for evaluating the survival risk of patients, as follows: Risk Score = [Expression level of AC027307.2 * (0.156)] + [Expression level of AC074117.1 * (0.294)] + [Expression level of AC103702.2 * (-0.025)] + [Expression level of CYTOR * (0.205)] + [Expression level of LINC02381 * (0.251)] + [Expression level of MIR200CHG * (0.052)] + [Expression level of SNHG16 * (-0.101)].
Further, among the 7 lncRNAs, AC027307.2, AC074117.1, AC103702.2, CYTOR, LINC02381 and MIR200CHG have been evaluated as the independent prognostic indicators for survival. These lncRNAs may make unique effects in the CRC progression. Among the six lncRNAs, LINC02381 showed most connections with included immune-related mRNAs in the regulatory network (Figure 10). The roles and functions of LINC02381 have been explored. LINC02381 was reported to down-regulate in tissues of CRC [23]. It was consistent with the result of our study. The high levels of LINC02381 uplifted the Risk Score of patients with COAD. Accordingly, the levels of LINC02381 would be affected with de-methylation and chemotherapy. The in vitro results reported that silencing LINC02381 functioned as a tumor suppressor by regulating PI3K-Akt signaling pathway [23]. Another study on neuroblastoma indicated that LINC02381 was also upregulated in late stage of patients with neuroblastoma, which was associated with survival of neuroblastoma [24]. AC074117.1 has been firstly reported as the highest ranked candidate prognostic indicator in an eXtreme Gradient Boosting machine learning framework. AC074117.1 was the target of several cancer-related miRNAs and interacted with multiple protein coding genes, which may be involved in a cancer-associated ceRNA network [25].
CYTOR has been one of the most mentioned lncRNAs played oncogenic roles in multiple cancers. CYTOR was reported to function in CRC progression and formed a complex with nucleolin and KHDRBS1 through EXON1. Based on these interactions, CYTOR can also be a treatment target for CRC besides of being biomarker of recurrence and prognosis [26]. Another mechanism study explored that CYTOR promoted CRC metastasis via interacting with β-catenin in Wnt/β-Catenin signaling, which may also be a target of metastasis management [27]. CYTOR also functioned in other cancers. It was reported to enhance chemo-resistance in breast cancer cells via sponging miR-125a-5p [28], modulate progression in non-small cell lung cancer cells via sponging miR-195 [29] and promote metastasis in nasopharyngeal carcinoma via miR-613 [30].
AC027307.2 and AC103702.2 were new targets firstly reported by our study. AC027307.2 showed limited connection with immune-related mRNAs and it was significantly associated with stage and TM of COAD patients, which provided information for further relevant studies. AC103702.2 showed negative connection with immune-related mRNAs in the regulatory network, while it also presented a negative coefficient in the formula of Risk Score. AC103702.2 could be further explored as a potential suppressive target in CRC.
Until now, no study was performed on the roles of MIR200CHG (MIR200C and MIR141 Host Gene) in CRC. However, MIR200CHG was included in a four-lncRNA based Risk Score evaluation model for prognosis prediction in bladder urothelial carcinoma [31]. Limited study was performed on MIR200CHG. As the host gene of MIR200C and MIR141, it may function through miR-200c and miR141-mediated lncRNA-mRNA crosstalks [32]. The ceRNA network provided abundant information for further function verification and pathway exploration of a certain lncRNAs.
The prognostic prediction efficacy of Risk Score was validated from several aspects. Firstly, the survival analysis was performed in both Training and Testing groups. Kaplan-Meier survival curve indicated that the survival probability of patients in high-risk and low-risk groups could be significantly classified. ROC curved proved that Risk Score can provide a better AUC compared to that of other clinical features. Secondly, the association between Risk Score and clinical characteristics was comprehensively analyzed. Although it was an independent prognostic indicator irrespective of other clinical symptoms, the patients divided by Risk Score showed significantly different characters. The GSEA result suggested that two immune-associated gene sets were more active in high-risk patients. In the analysis of 22 kinds of immune cells, it observed that, the levels of T cells CD4 memory, Dendritic cells and Mast cells were significantly varied in high-risk cases. It suggested the potential cellular mechanism. Above results further verified the survival risk evaluation efficacy of immune-related lncRNAs based Risk Score. As we known, the lncRNAs functioned by interacting with miRNAs and mRNAs, thus forming ceRNA networks. The mRNAs co-expressed with the identified 7 lncRNAs were further filtered and analyzed. The GO and KEGG analysis indicated that immune-related pathways were most enriched. Finally, the Risk Score was validated with follow-up data of clinical samples, which were obtained in our hospital. In the Kaplan-Meier survival analysis, the patients can be clearly classified into high-risk and low-risk groups. The AUC of ROC was 0.674, indicating a moderate efficacy in prognostic prediction. However, the limitation of this study was the small number of clinical samples for validating the prognostic prediction efficacy of Risk Score. Well-designed and controlled study should be performed, and more samples should be included in the further validation.
In conclusion, our study explored a 7 immune-related lncRNAs based signature for predicting OS of patients with COAD. The lncRNAs were identified sequentially with univariate Cox analysis, LASSO regression analysis and stepwise regression analysis. Risk Score can be calculated with the expression levels of involved lncRNAs and their respective coefficients. Both the Risk Score and involved lncRNAs could be prognostic indicators. Further, the identified immune-related lncRNAs may also be promising candidates as therapeutic targets.
Disclosure of conflict of interest
None.
Supporting Information
References
- 1.Parkin D, Whelan S, Ferlay J, Teppo L, Thomas D. World Health Organization cancer incidence in five continents Lyon. World Health Organ Int Agency Res Cancer. 2002;8:1–771. [Google Scholar]
- 2.World Cancer Research Fund and American Institute for Cancer Research. Food, nutrition, physical activity, and the prevention of cancer: a global perspective. Amer Inst for Cancer Research. 2007 [Google Scholar]
- 3.Boyle P, Langman MJ. ABC of colorectal cancer: epidemiology. BMJ. 2000;321:805–8. doi: 10.1136/bmj.321.7264.805. [DOI] [PMC free article] [PubMed] [Google Scholar]
- 4.Haggar FA, Boushey RP. Colorectal cancer epidemiology: incidence, mortality, survival, and risk factors. Clin Colon Rectal Surg. 2009;22:191–197. doi: 10.1055/s-0029-1242458. [DOI] [PMC free article] [PubMed] [Google Scholar]
- 5.Boyle P, Leon ME. Epidemiology of colorectal cancer. Br Med Bull. 2002;64:1–25. doi: 10.1093/bmb/64.1.1. [DOI] [PubMed] [Google Scholar]
- 6.Torre LA, Bray F, Siegel RL, Ferlay J, Lortet-Tieulent J, Jemal A. Global cancer statistics, 2012. CA Cancer J Clin. 2015;65:87–108. doi: 10.3322/caac.21262. [DOI] [PubMed] [Google Scholar]
- 7.Schreuders EH, Ruco A, Rabeneck L, Schoen RE, Sung JJ, Young GP, Kuipers EJ. Colorectal cancer screening: a global overview of existing programmes. Gut. 2015;64:1637–1649. doi: 10.1136/gutjnl-2014-309086. [DOI] [PubMed] [Google Scholar]
- 8.Thrumurthy SG, Thrumurthy SS, Gilbert CE, Ross P, Haji A. Colorectal adenocarcinoma: risks, prevention and diagnosis. BMJ. 2016;354:i3590. doi: 10.1136/bmj.i3590. [DOI] [PubMed] [Google Scholar]
- 9.Song M, Emilsson L, Bozorg SR, Nguyen LH, Joshi AD, Staller K, Nayor J, Chan AT, Ludvigsson JF. Risk of colorectal cancer incidence and mortality after polypectomy: a Swedish record-linkage study. Lancet Gastroenterol Hepatol. 2020;5:537–547. doi: 10.1016/S2468-1253(20)30009-1. [DOI] [PMC free article] [PubMed] [Google Scholar]
- 10.Zhang Z, Qian W, Wang S, Ji D, Wang Q, Li J, Peng W, Gu J, Hu T, Ji B, Zhang Y, Wang S, Sun Y. Analysis of lncRNA-associated ceRNA network reveals potential lncRNA biomarkers in human colon adenocarcinoma. Cell Physiol Biochem. 2018;49:1778–1791. doi: 10.1159/000493623. [DOI] [PubMed] [Google Scholar]
- 11.Fatica A, Bozzoni I. Long non-coding RNAs: new players in cell differentiation and development. Nat Rev Genet. 2014;15:7–21. doi: 10.1038/nrg3606. [DOI] [PubMed] [Google Scholar]
- 12.Spizzo R, Almeida MI, Colombatti A, Calin GA. Long non-coding RNAs and cancer: a new frontier of translational research? Oncogene. 2012;31:4577–4587. doi: 10.1038/onc.2011.621. [DOI] [PMC free article] [PubMed] [Google Scholar]
- 13.Karreth FA, Pandolfi PP. ceRNA cross-talk in cancer: when ce-bling rivalries go awry. Cancer Discov. 2013;3:1113–1121. doi: 10.1158/2159-8290.CD-13-0202. [DOI] [PMC free article] [PubMed] [Google Scholar]
- 14.Shi X, Sun M, Liu H, Yao Y, Song Y. Long non-coding RNAs: a new frontier in the study of human diseases. Cancer Lett. 2013;339:159–166. doi: 10.1016/j.canlet.2013.06.013. [DOI] [PubMed] [Google Scholar]
- 15.Prat A, Navarro A, Paré L, Reguart N, Galván P, Pascual T, Martínez A, Nuciforo P, Comerma L, Alos L, Pardo N, Cedrés S, Fan C, Parker JS, Gaba L, Victoria I, Viñolas N, Vivancos A, Arance A, Felip E. Immune-related gene expression profiling after PD-1 blockade in non-small cell lung carcinoma, head and neck squamous cell carcinoma, and melanoma. Cancer Res. 2017;77:3540–3550. doi: 10.1158/0008-5472.CAN-16-3556. [DOI] [PubMed] [Google Scholar]
- 16.Jiang B, Sun Q, Tong Y, Wang Y, Ma H, Xia X, Zhou Y, Zhang X, Gao F, Shu P. An immune-related gene signature predicts prognosis of gastric cancer. Medicine (Baltimore) 2019;98:e16273. doi: 10.1097/MD.0000000000016273. [DOI] [PMC free article] [PubMed] [Google Scholar]
- 17.Kelley RK, Wang G, Venook AP. Biomarker use in colorectal cancer therapy. J Natl Compr Canc Netw. 2011;9:1293–1302. doi: 10.6004/jnccn.2011.0105. [DOI] [PMC free article] [PubMed] [Google Scholar]
- 18.Lech G, Słotwiński R, Słodkowski M, Krasnodębski IW. Colorectal cancer tumour markers and biomarkers: recent therapeutic advances. World J Gastroenterol. 2016;22:1745. doi: 10.3748/wjg.v22.i5.1745. [DOI] [PMC free article] [PubMed] [Google Scholar]
- 19.Network, N.C.C., NCCN practice guidelines in oncology: CRC. [Google Scholar]
- 20.Sepulveda AR, Hamilton SR, Allegra CJ, Grody W, Cushman-Vokoun AM, Funkhouser WK, Kopetz SE, Lieu C, Lindor NM, Minsky BD, Monzon FA, Sargent DJ, Singh VM, Willis J, Clark J, Colasacco C, Rumble RB, Temple-Smolkin R, Ventura CB, Nowak JA. Molecular biomarkers for the evaluation of colorectal cancer: guideline from the American Society for Clinical Pathology, College of American Pathologists, Association for Molecular Pathology, and American Society of Clinical Oncology. J. Clin. Oncol. 2017;35:1453–1486. doi: 10.1200/JCO.2016.71.9807. [DOI] [PubMed] [Google Scholar]
- 21.Huang W, Liu Z, Li Y, Liu L, Mai G. Identification of long noncoding RNAs biomarkers for diagnosis and prognosis in patients with colon adenocarcinoma. J Cell Biochem. 2019;120:4121–4131. doi: 10.1002/jcb.27697. [DOI] [PubMed] [Google Scholar]
- 22.Huang R, Zhou L, Chi Y, Wu H, Shi L. LncRNA profile study reveals a seven-lncRNA signature predicts the prognosis of patients with colorectal cancer. Biomark Res. 2020;8:1–16. doi: 10.1186/s40364-020-00187-3. [DOI] [PMC free article] [PubMed] [Google Scholar]
- 23.Jafarzadeh M, Soltani BM, Soleimani M, Hosseinkhani S. Epigenetically silenced LINC02381 functions as a tumor suppressor by regulating PI3K-Akt signaling pathway. Biochimie. 2020;171:63–71. doi: 10.1016/j.biochi.2020.02.009. [DOI] [PubMed] [Google Scholar]
- 24.Meng X, Fang E, Zhao X, Feng J. Identification of prognostic long noncoding RNAs associated with spontaneous regression of neuroblastoma. Cancer Med. 2020;9:3800–3815. doi: 10.1002/cam4.3022. [DOI] [PMC free article] [PubMed] [Google Scholar]
- 25.Zhang X, Li T, Wang J, Li J, Chen L, Liu C. Identification of cancer-related long non-coding RNAs using XGBoost with high accuracy. Front Genet. 2019;10:735. doi: 10.3389/fgene.2019.00735. [DOI] [PMC free article] [PubMed] [Google Scholar]
- 26.Wang X, Yu H, Sun W, Kong J, Zhang L, Tang J, Wang J, Xu E, Lai M, Zhang H. The long non-coding RNA CYTOR drives colorectal cancer progression by interacting with NCL and Sam68. Mol Cancer. 2018;17:110. doi: 10.1186/s12943-018-0860-7. [DOI] [PMC free article] [PubMed] [Google Scholar]
- 27.Yue B, Liu C, Sun H, Liu M, Song C, Cui R, Qiu S, Zhong M. A positive feed-forward loop between LncRNA-CYTOR and Wnt/β-catenin signaling promotes metastasis of colon cancer. Mol Ther. 2018;26:1287–1298. doi: 10.1016/j.ymthe.2018.02.024. [DOI] [PMC free article] [PubMed] [Google Scholar]
- 28.Liu Y, Li M, Yu H, Piao H. lncRNA CYTOR promotes tamoxifen resistance in breast cancer cells via sponging miR-125a-5p. Int J Mol Med. 2020;45:497–509. doi: 10.3892/ijmm.2019.4428. [DOI] [PMC free article] [PubMed] [Google Scholar]
- 29.Zhang J, Li W. Long noncoding RNA CYTOR sponges miR-195 to modulate proliferation, migration, invasion and radiosensitivity in nonsmall cell lung cancer cells. Biosci Rep. 2018;38:BSR20181599. doi: 10.1042/BSR20181599. [DOI] [PMC free article] [PubMed] [Google Scholar]
- 30.Chen W, Du M, Hu X, Ma H, Zhang E, Wang T, Yin L, He X, Hu Z. Long noncoding RNA cytoskeleton regulator RNA promotes cell invasion and metastasis by titrating miR-613 to regulate ANXA2 in nasopharyngeal carcinoma. Cancer Med. 2020;9:1209–1219. doi: 10.1002/cam4.2778. [DOI] [PMC free article] [PubMed] [Google Scholar]
- 31.He RQ, Huang ZG, Li TY, Wei YP, Chen G, Lin XG, Wang QY. RNA-sequencing data reveal a prognostic four-lncRNA-based risk score for bladder urothelial carcinoma: an in silico update. Cell Physiol Biochem. 2018;50:1474–1495. doi: 10.1159/000494647. [DOI] [PubMed] [Google Scholar]
- 32.Liu G, Chen Z, Danilova IG, Bolkov MA, Tuzankina IA, Liu G. Identification of miR-200c and miR141-mediated lncRNA-mRNA crosstalks in muscle-invasive bladder cancer subtypes. Front Genet. 2018;9:422. doi: 10.3389/fgene.2018.00422. [DOI] [PMC free article] [PubMed] [Google Scholar]
Associated Data
This section collects any data citations, data availability statements, or supplementary materials included in this article.


