Abstract
The purpose of this study was to identify key autophagy-related genes (ARGs) in patients with renal cancer (RC) by bioinformatics analysis, and to clarify their potential prognostic value. Thirty-eight differentially expressed ARGs were identified between RC and normal tissues based on The Cancer Genome Atlas database. Functional enrichment analysis suggested that autophagy may play a tumor-promoting role in the initiation of RC. We established a prognostic model with two ARGs (CASP4 and BIRC5) demonstrating significant correlations in expression levels with patient overall survival (OS). Multivariate Cox regression analysis showed that age and the autophagy genes prognostic model were independent prognostic factors for patients with RC. Considering the known prognostic significance of clinical stage in RC, we constructed a nomogram based on age, clinical stage, and the prognostic model. The prognostic model was verified in a separate validation set and external cohort of patients from Beijing Hospital. Patients of low and high risk were defined based on the median risk value calculated by the model and the high risk appeared associated with a significant shorter OS (P < 0.01). Overall, our findings reveal that ARGs have potential prognostic value in patients with RC, providing new directions for targeted therapy.
Keywords: Autophagy, BIRC5, CASP4, renal cancer
Introduction
Autophagy is an important conserved biological process by which eukaryotic cells maintain cellular homeostasis through the degradation and disposal of damaged cytoplasmic components, including macromolecules and organelles [1,2]. Autophagy is associated with several critical molecular pathways and a variety of physiological and pathological processes, including the inflammatory response, acquired immunity, immune surveillance, and development of malignant tumors. Accordingly, abnormal autophagy activity is considered to play a key role in tumorigenesis, tumor progression, patient survival, and the therapeutic response [3].
Nevertheless, the detailed role of autophagy in cancer development remains unclear. It has been reported that autophagy functions in tumor inhibition by maintaining genomic integrity, and by preventing proliferation and inflammation during the initial stage of cancer development [4]. However, following tumor initiation, cancer cells may use autophagy to promote their survival in an unfavorable microenvironment [5]. As autophagy has a complex function in cancer, further study of the relationship between autophagy and tumor cells, as well as the potential biological processes involved, is expected to yield valuable information for the development of novel treatment approaches.
Renal cancer (RC) is a most common urinary malignancy, accounting for approximately 3% of all malignant tumors in adults. From 2009 to 2013, the incidence of RC in men in the United States was 21.7 per 100,000, and the mortality rate was 5.6 per million [6]. In China, the incidence of RC has been increasing at an average annual rate of 6.5% over the past 20 years, and RC is now the most common type of cancer in urinary tumor-related deaths. Approximately, 20-30% of patients are diagnosed with RC at an advanced stage, which seriously affects the quality of life and survival time of these patients.
Autophagy has been reported as a potential cell survival mechanism for RC cells, which suggests a new direction for the clinical treatment of RC [7,8]. Santoni et al. [9] reported that polymorphisms in autophagy-related genes (ARGs) were associated with the risk of progression and the poor prognosis of patients with clear cell renal cell carcinoma. In addition, many pathways were shown to participate in the proliferation of renal tumor cells by affecting the regulation of autophagy [10]. Therefore, it is reasonable to speculate that autophagy is an important process involved in RC development, maintenance of homeostasis in RC cells, and the pathogenesis of RC disease and progression.
Owing to the limited predictive power of traditional clinical information, second-generation sequencing technology and gene expression database analysis have been widely used to explore valuable therapeutic genes, identify promising prognostic factors, and analyze the molecular mechanisms underlying various cancers. For example, using the data for hepatocellular carcinoma patients in The Cancer Genome Atlas (TCGA) database, Long et al. [11] demonstrated that the prognosis of patients with elevated expression levels of CENPA, HOXD9, MAGEB6, and SPP1 was relatively poor, suggesting that second-generation sequencing methods and gene database analysis can identify clinical biomarkers of cancer. Therefore, exploration of molecular markers related to autophagy is critical for improving our understanding of the initiation and development of RC, predicting the risk of RC progression, and developing novel treatment approaches.
In the present study, we analyzed data from 879 patients with RC from TCGA dataset, which were randomly divided into training and test datasets. By analyzing the correlation between the expression profiles of ARGs and clinical outcomes, a prognostic model based on ARGs was developed to predict the overall survival (OS). We then verified the results of the training set by applying the prognostic model based on ARGs to the test set and compared with the immunohistochemical results from RC specimens of patients at our hospital. Our prognostic model, combined with further data regarding ARG expression and clinical characteristics, may improve the prognostic prediction and management of patients with RC.
Materials and methods
Data sources
RNA sequencing data on ARGs and clinical information from patients diagnosed of RC were obtained from TCGA database. All ARG-related data were downloaded from the Human Autophagy Database (HADb, http://www.autophagy.lu/index.html), which is a database dedicated to the documentation of human genes involved in autophagy.
The clinical and pathological data of patients undergoing nephrectomy at Beijing Hospital were collected retrospectively, and further screened and analyzed as an external validation cohort (hereafter referred to as the BJH set). The inclusion criteria were as follows: (1) the patient underwent nephrectomy at Beijing Hospital between October 2012 and April 2019; (2) a pathological diagnosis of RC was confirmed at Fuhrman grade III or above; (3) the patient was aged ≥ 16 years; and (4) provided informed consent. The exclusion criteria were as follows: (1) paraffin-embedded tissue sections were not available or were of poor quality; and (2) incomplete follow-up data. Samples from a total of 35 patients with RC were selected for immunohistochemical staining, and patient survival information was followed up over telephone. Signed informed consent was obtained from all patients and all protocols were approved by the Research Ethics Committee of Beijing Hospital (2020BJYYEC-074-01).
Identification of differentially expressed ARGs and enrichment analysis
The DESeq R package was used to calculate the differential expression levels of ARGs between RC and normal tissues. The ARGs in the dataset with an absolute log2 fold change (FC) > 1 and an adjusted P value of < 0.001 were considered eligible for subsequent analysis. A parallel box diagram was used to visualize these data.
To better understand the role of differentially expressed ARGs, we use the R “cluster Profiler” package for enrichment analysis. Visualization and integrated discovery bioinformatics tools and the “GOplot” package were then used to visualize the results.
Establishment of the gene-related prognostic model
For the training set, univariate, Lasso, and multivariate Cox regression analyses were performed to investigate the correlation between OS and expression levels of ARGs in patients with RC. First, significant correlation was considered if P < 0.05 in univariate Cox regression analysis. Then, these significant survival-related genes were analyzed by Lasso regression analysis to further screen genes with high correlation, eliminate false positives, and prevent overfitting of the model, as described previously [11]. Next, multivariate Cox regression analysis was performed to identify genes that could independently predict patient survival, and the Oncome database (https://www.oncome.org/resource/login.html) was used to explore the mRNA expression levels. Finally, the obtained ARGs were used to establish a prognostic model, in which the relative expression level of ARGs was multiplied by the linear combination of regression coefficients (β) from the multivariate Cox regression model as follows:
Prognostic model/Risk score = βgene (1) × ARGs expression (1) + βgene (2) × ARGs expression (2) +···+βgene (n) × ARGs expression (n)
Establishing the survival and risk curve
For patients with RC from Beijing Hospital, low and high risk were defined based on the median value of the immunohistochemical score. Patients with RC in the training and test sets were also divided into low- and high-risk groups according to the median value of the risk score. The Kaplan-Meier plots method was used to demonstrate the difference in OS between two groups. A risk curve was established to better visualized the risk value, survival status, and gene expression levels of patients within the two groups. A time-dependent receiver operating characteristic (ROC) curve analysis was conducted to further evaluate the predictive value of the prognostic model.
Independence of the prognostic model
To establish that the prognostic model is independent of other clinical variables (e.g., age, sex, histologic grade, and clinical stage), we performed univariate and multivariate Cox regression analyses using the prognostic model and clinical information as independent variables with OS as the dependent variable. The 95% confidence intervals (CIs) and the hazard ratios (HRs) were calculated.
To determine the relationship between the prognostic model and clinical characteristics, differences in risk scores between different groups were explored using age, sex, pathological grade, and clinical staging system of patients with RC in the test set as classification variables.
Building and validating the nomogram
Featured by simplifying the statistical predictive model using a single number to estimate the probability of an event, nomograms emerge as a widely tool for clinical prediction of prognosis of cancer patients, mainly because they can (such as death or recurrence) [12]. In this study, all independent prognostic factors obtained from multivariate Cox regression analysis were selected to construct the nomogram and evaluate the probability of 3-year and 5-year OS in patients with RC; this nomogram was then verified. By drawing the relationship between nomogram predictive probability and observation rate, the calibration curve of the nomogram was graphically evaluated. Overlap with the reference line suggested that the model was in perfect agreement.
Statistical analysis
All statistical analyses were performed using SPSS 22.0 (Chicago, IL, USA) and R 3.6.1 (https://www.r-project.org/). The Wilcoxon rank-sum test was used to analyze the difference of gene expression levels between tumor and normal tissues. Univariate, Lasso, and multivariate Cox regression analyses were used to screen genes included in the prognostic model. RC patients from different datasets were divided into high-risk and low-risk groups according to the median risk score or histochemistry score, and the OS of patients was analyzed by the Kaplan-Meier method. The “survivalROC” package in R software was used to generate the ROC curve and the corresponding area under the ROC curve (AUC) value. Student’s t-test was used to compare the correlation between the prognostic model and clinicopathological variables. A two sided P < 0.05 was considered statistically significant.
Results
Differentially expressed ARGs in RC and functional enrichment analysis
RNA-seq and clinical data from 893 RC tissue samples and 128 non-tumor tissue samples were downloaded from TCGA. Gene expression and clinical follow-up data from 879 patients with primary RC were selected for analysis. Using an FDR < 0.001 and log2 (FC) > 1 as the standard, 38 ARGs were obtained, 33 of which were upregulated and 5 were downregulated (Figure 1A, 1B).
Figure 1.
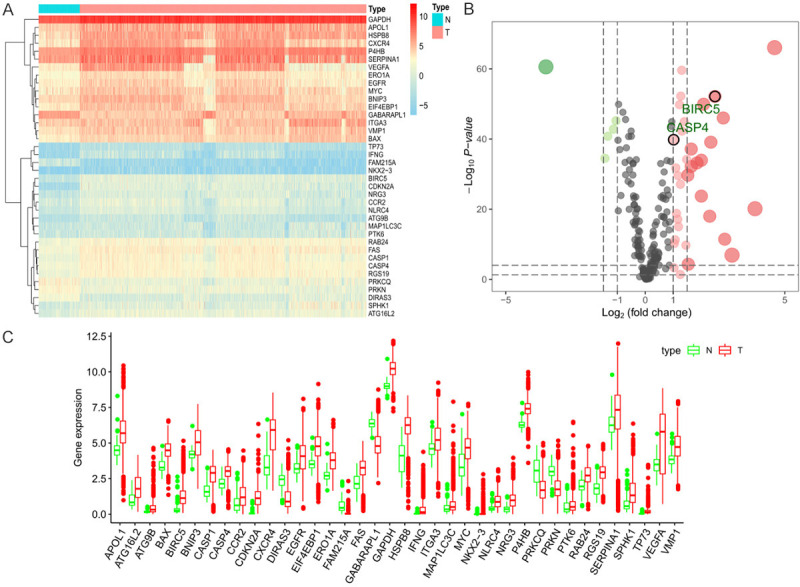
Differences in autophagy-related gene (ARG) expression between renal cancer (RC) and normal tissues. A. Expression heatmap of differentially expressed ARGs in The Cancer Genome Atlas (TCGA) dataset. B. Volcano plots of the differentially expressed ARGs in TCGA dataset. Red and green nodes represent gene expression upregulation and downregulation, respectively. C. Visualization of 38 differentially expressed ARGs in the form of a box diagram.
The box diagram in Figure 1C shows the expression patterns of the 38 differentially expressed ARGs in RC and non-tumor tissues. The 33 upregulated genes were APOL1, ATG16L2, ATG9B, BAX, BIRC5, BNIP3, CASP1, CASP4, CCR2, CDKN2A, CXCR4, EGFR, EIF4EBP1, ERO1A, FAS, GAPDH, HSPB8, IFNG, ITGA3, MAP1LC3C, MYC, NKX2-3, NLRC4, NRG3, P4HB, PTK6, RAB24, RGS19, SERPINA1, SPHK1, TP73, VEGFA, and VMP1, and the 5 downregulated genes were DIRAS3, FAM215A, GABARAPL1, PRKCQ, and PRKN.
To clarify the functional characteristics of differentially expressed ARGs, we performed enrichment analyses of Gene Ontology (GO) and Kyoto Encyclopedia of Genes and Genomes (KEGG) pathways, which can provide a basis for further exploration of the biological roles of these genes. The significantly enriched GO terms and KEGG pathways of these differentially expressed ARGs are listed in detail in Supplementary Figures 1 and 2.
Random grouping of patients and construction of a prognostic model
The correlation between 38 differentially expressed ARGs and OS expression profiles was obtained from 879 patients with RC using data downloaded from TCGA. These patients were randomly divided into a training set (n = 440) and a test set (n = 439).
Univariate Cox regression analysis was used to investigate the correlation between the differentially expressed ARGs and OS in the training set of patients with RC. A significant correlation with OS was found in 24 genes (P < 0.05). Subsequently, these genes were analyzed by Lasso regression analysis to further narrow the scope of our selected mRNAs and screen genes with higher correlations in patients with RC. Finally, two genes, CASP4 and BIRC5, were selected to construct the predictive model by multivariate Cox regression analysis.
The predictive model was based on the linear combination of the expression levels of the two genes weighted by the relative coefficients in multiple Cox regression, as follows: prognostic model/risk score = (0.1379 × expression level of CASP4) + (0.1152 × expression level of BIRC5). Both genes showed a positive coefficient in the Cox regression analysis, indicating that these two genes have high-risk characteristics, as their elevated expression is associated with shorter OS.
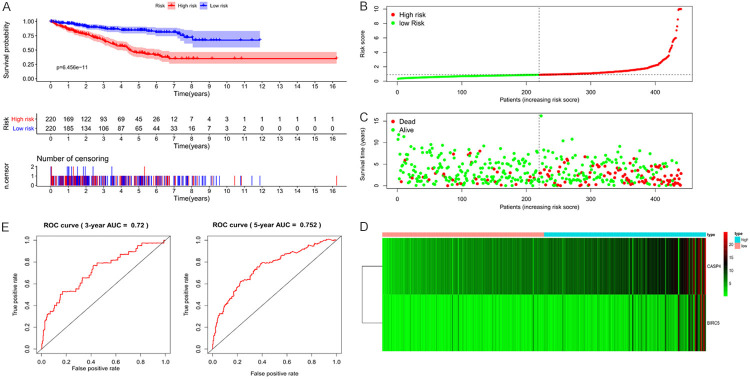
Based on the prognostic model we obtained, patients in the training set were divided into high- and low-risk groups according to the median value of the risk score. A Kaplan-Meier plot demonstrated that patients in the high-risk group had significantly shorter OS than those in the low-risk group (P < 0.001; Figure 2A). The distribution of patients by risk stratification within training set, the number of patients within two risk groups, and a heatmap of the expression profiles of the CASP4 and BIRC5 genes are shown in Figure 2B-D.
Figure 2.
Visualization of the prognostic model in training set patients. A. In the training set, high-risk patients were associated with significantly shorter overall survival. B. Distribution of risk values in training set patients. C. The survival status of training set patients with high and low risk values. D. Heatmap of expression profiles of two key genes in training set patients. E. Time-dependent receiver operating characteristic (ROC) curve analysis for survival prediction by the prognostic model based on the training set.
To evaluate the prognostic efficacy of the model, time-dependent ROC curve analysis was performed. The 3-year and 5-year AUC value of the prognostic model was 0.72 and 0.752, respectively (Figure 2E), indicating good prognostic efficacy. Univariate and multivariate Cox regression analyses were then performed on 123 patients with RC with complete clinical data in the training set to assess the independent predictive value of the clinical data and prognostic model. Age, stage, and prognostic model were considered as continuous variables. Specifically, stage was coded as I = 1, II = 2, III = 3, and IV = 4. Male sex was included as a known risk factor. Univariate Cox regression analysis showed that age, clinical stage, pathological grade, T, N, M, and our prognostic model were all significantly related to survival. Multivariate Cox regression analysis demonstrated that age and our prognostic model independently associated with OS (Figure 3).
Figure 3.

Univariate and multivariate Cox regression analyses demonstrated that age and the prognostic model were independently associated with the overall survival of patients with renal cancer.
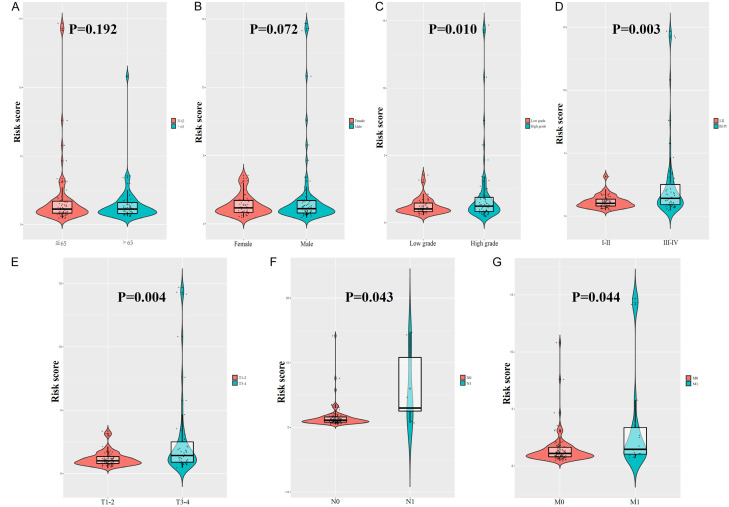
We also investigated the relationship between clinicopathological parameters and our prognostic model. No differences in risk score were observed based on age (P = 0.192, Figure 4A) or sex (P = 0.072, Figure 4B). In addition, the risk score of patients with high-grade pathologies was higher than that of patients with low-grade pathologies (P = 0.010, Figure 4C). Furthermore, the risk score for clinical stages III-IV was higher than that for stages I-II (P = 0.003, Figure 4D), higher for T3-4 than that for T1-2 (P = 0.004, Figure 4E), higher for N1 than that for N0 (P = 0.043, Figure 4F), and higher for M1 than that for M0 (P = 0.044, Figure 4G).
Figure 4.
Clinicopathological significance of risk score in renal cancer. Risk score according to (A) age, (B) gender, (C) histological grade, (D) clinical stage, (E) T stage, (F) N stage, and (G) M stage.
Construction and verification of the nomogram
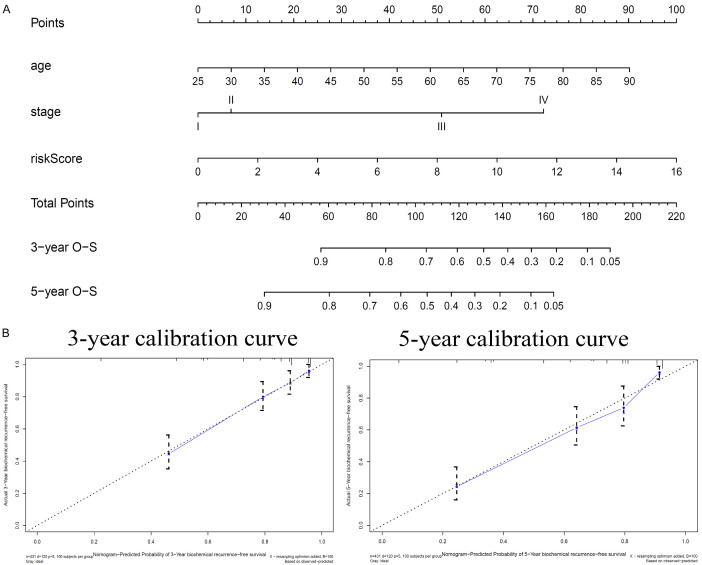
To establish an applicable method to predict the survival probability of patients with RC in clinically practice, a nomogram was developed based on the TCGA data to predict the probability of 3-year and 5-year OS. Considering the prognostic significance of clinical stage for patients with RC, we constructed a nomogram based on age, clinical stage, and our prognostic model based on the two ARGs. The nomogram predicted survival based on two independent prognostic factors (age, prognostic model) and clinical stage (Figure 5A). A calibration plot was used to visualize the performance of the nomogram in which the 45° line represents the best prediction, demonstrating that the nomogram performed well (Figure 5B).
Figure 5.
A. Nomogram predicts the probability of 3-year and 5-year overall survival (OS) in patients with renal cancer (RC). B. Calibration plots for the nomogram at different time points.
Verification of the predictive model using other datasets
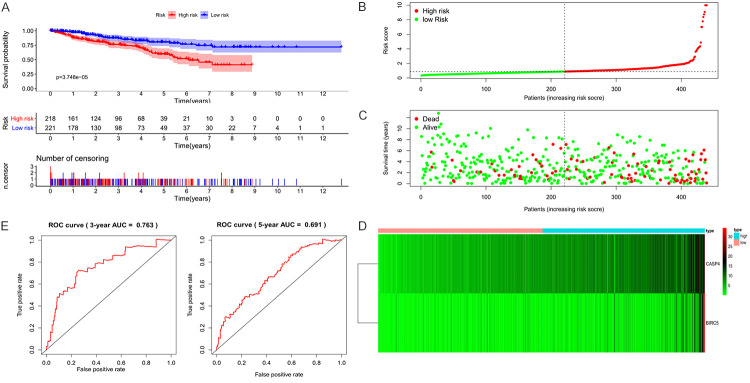
To evaluate the predictive value of the prognostic model, we used an internal dataset (test set from TCGA) and an external dataset (BJH set) for verification. Patients in the test set were also divided into low- and high-risk groups according to the median risk score, and the data for both groups were visualized (Figure 6A-D). The results were consistent with those of the training set. In the test set, the OS of patients of high risk was significantly lower (P < 0.001), and the 3-year and 5-year AUC was 0.763 and 0.691, respectively (Figure 6E).
Figure 6.
Visualization of the prognostic model in test set patients. A. In the test set, high-risk patients were associated with significantly shorter overall survival. B. Distribution of risk values in test set patients. C. The survival status of test set patients with high and low risk values. D. Heatmap of expression profiles of two key genes in test set patients. E. Time-dependent receiver operating characteristic (ROC) curve analysis for survival prediction by the prognostic model based on the test set.
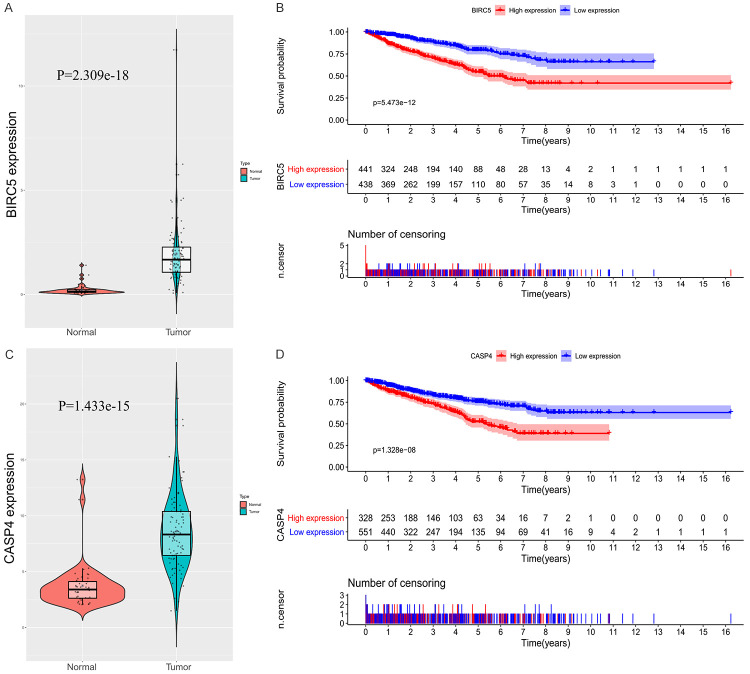
To verify the elevated protein expression of CASP4 and BIRC5 in RC, immunohistochemistry was performed in 35 paired RC and adjacent normal tissues from the BJH set (Figure 7A-F). For BJH patients, patients of low and high risk were then defined according to the median histochemistry score (H-Score) and a Kaplan--Meier plot was generated (Figure 8A, 8B). The H-Score was calculated as described previously [13,14]. The Kaplan-Meier plot showed that elevated expression of CASP4 and BIRC5 was associated with a relatively poor prognosis in patients with RC (P = 0.031, P = 0.021). In addition, the expression levels of CASP4 and BIRC5 in RC tissues were found statistically higher than those in normal tissues after a searching in Oncomine database (Supplementary Figure 3). The above results are consistent with our results from the TCGA database (Figure 9).
Figure 7.
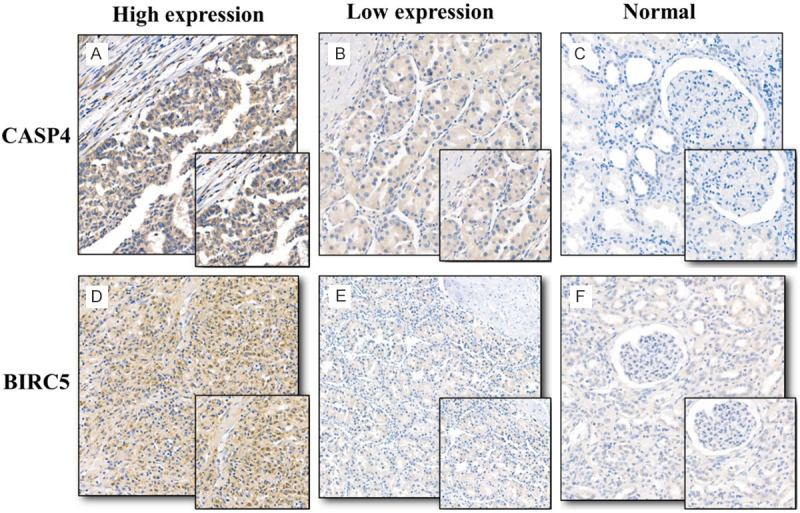
Immunochemical staining of CASP4 and BIRC5 in paired renal cancer (RC) and adjacent normal tissues. A. High expression of CASP4 in RC tissues. B. Low expression of CASP4 in RC tissues. C. Low expression of CASP4 in adjacent normal tissues. D. High expression of BIRC5 in RC tissues. E. Low expression of BIRC5 in RC tissues. F. Low expression of BIRC5 in adjacent normal tissues.
Figure 8.

Samples from patients with renal cancer (RC) from Beijing Hospital were divided into high- and low-risk groups according to the H-Score, and the differences in overall survival (OS) between the two groups were determined. A. Based on the H-Score of CASP4, high-risk patients were associated with significantly shorter overall survival (P = 0.031). B. Based on the H-Score of BIRC5, high-risk patients were associated with significantly shorter overall survival (P = 0.021).
Figure 9.
Differential expression of two key genes and their relationship with prognosis in patients with renal cancer (RC) in The Cancer Genome Atlas (TCGA) database. A. Differences in BIRC5 expression between RC and normal tissues in TCGA database. B. Overall survival (OS) of patients with elevated expression of BIRC5 in TCGA database was significantly lower than that of patients with low expression. C. Differences in CASP4 expression between RC and normal tissues in TCGA database. D. OS of patients with high expression of CASP4 in TCGA database was significantly lower than that of patients with low expression.
Discussion
The initiation and development of RC result from the activation of proto-oncogenes and the inactivation of tumor suppressor genes. As RC is a heterogeneous tumor, the clinical outcome of patients with RC varies substantially. At present, progress in molecular targeted therapy is stagnant and no optimal molecular biomarker exists for monitoring the prognosis of patients with RC. Thus, there is an urgent need to further explore the molecular mechanisms underlying RC. Recent studies have demonstrated that autophagy plays an important role in the initiation and development of RC [9]; therefore, increasing our understanding of this process can provide valuable insights for the diagnosis and treatment of RC.
We used the TCGA database to investigate the differences in ARG expression between RC and adjacent non-tumor tissues to identify potential gene biomarkers. We screened 38 differentially expressed ARGs between RC and non-tumor tissues. Considering that these genes may be closely related to the development and growth of RC, we performed GO and KEGG enrichment analyses. The results suggested that the differentially expressed ARGs may play a tumor-promoting role in RC.
The role of autophagy in cancer is complex, and it is still controversial to adopt a treatment that involves inducing or inhibiting autophagy in a clinical setting [15]. Wang et al. [16] reported that ARGs may play a role as tumor suppressor genes in the occurrence of bladder cancer. Another group reported that the overexpression of ARGs in lung cancer tissue could promote cancer progression [17]. In addition, Degenhardt et al. [18] demonstrated that autophagy increases in the anoxic regions of tumors and can promote the survival of tumor cells under a variety of stress conditions such as nutritional deprivation and hypoxia. In mouse models, the deletion of an autophagy gene was suggested to lead to tumorigenesis [19]. Therefore, the role of autophagy may vary among different types of tumors.
We screened the ARGs by univariate, Lasso, and multivariate Cox regression analyses to establish a model to predict the prognosis of patients with RC. We identified two key ARGs, CASP4 and BIRC5, that are associated with a poor prognosis when overexpressed in patients with RC. The AUC value of the prognosis model based on these two ARGs was 0.72, indicating good predictive efficiency. According to the risk score prognosis model, patients with RC were divided into high- and low-risk groups. Clinicians can adjust the treatment plan of patients with RC according to the predicted results of the model, enabling more individualized treatment. For high-risk patients, more active treatment strategies should be developed, and patients should be followed-up more frequently. In addition, the prognostic model can be used as a reference for organ allocation in patients with RC who need kidney transplantation after nephrectomy.
We also confirmed that our prognostic model is an independent prognostic factor for patients with RC using a test dataset. Further exploration of the expression levels of the two ARGs in the BJH dataset confirmed that samples with a high H-score tended to be from high-risk patients, as the overexpression of CASP4 and BRIC5 was associated with a poor prognosis of RC patients.
A nomogram is a statistical tool that provides an overall probability of a specific outcome for an individual patient. We constructed a nomogram to accurately predict the likelihood of OS in patients with RC, which included our prognostic model based on the two ARGs. The calibration plot showed a close relationship between the actual and predicted survival, indicating a good predicted value of the nomogram.
Caspase 4 (CASP4) is a member of the caspase (aspartate-specific cysteinyl proteinase) family of proteins, which plays a role in immunity, inflammation, and the coordination of cellular processes, including cell homeostasis and apoptosis. Previous studies have found that the expression level of CASP4 may be associated with the initiation and development of many kinds of cancers, including colorectal cancer and esophageal squamous cell carcinoma, suggesting that CASP4 may be a potential cancer biomarker [20-22]. In addition, by silencing the expression of CASP4, Papoff et al. [23] found that its expression level was closely related to the invasive ability of epithelial cancer cells. However, there are only a few reports on the function of CASP4 in urological tumors; thus, further investigations on the role of CASP4 in RC are warranted.
BIRC5/survivin, a member of the inhibitor of apoptosis protein family, plays a dual role in inhibiting apoptosis proteins, namely in preventing apoptosis and in regulating cell mitosis. Caspase cascade activation and protein cleavage form the core mechanism of apoptosis. Survivin can directly act on caspase-3 and caspase-7 to inhibit their activity, thus regulating the process of apoptosis [24]. Survivin is significantly overexpressed in most human malignant tumors and is regarded as a prognostic marker of RC [25-27]. In addition, two meta-analyses showed that elevated expression of survivin is associated with a poor prognosis and more advanced pathological stage, and that it can be used as a biomarker for disease management [28,29]. Due to the selectively high expression of survivin in malignant tumors, its inhibition is frequently sufficient to induce spontaneous apoptosis in tumor cells, a feature that most other anti-apoptotic genes lack. Therefore, gene therapy targeting survivin may become one of the important new directions in the treatment of urinary tumors in the future.
In routine clinical diagnosis and treatment, tumor staging is a key factor used to determine the prognosis of patients with RC. However, the clinical results of patients at the same stage may vary, which indicates that the current staging system is not sufficient to accurately predict the prognosis. The current staging system is based entirely on the anatomical degree of the disease and does not fully reflect the biological heterogeneity of patients with RC. The present nomogram was constructed based on the clinical stage, age, and prognostic model, combining gene expression and clinical data to improve predictive accuracy. We believe that this nomogram can be a valuable reference for clinical decision-making.
This study has several limitations. First, it was a retrospective study, which may be prone to selective bias. Second, the number of patients in the BJH set was quite small, and the use of paraffin sections for immunohistochemistry is not very accurate. Additional research including a larger sample size should be conducted, and experiments using RC tissues are needed to further verify our findings. In addition, the molecular mechanisms underlying the role of the key autophagy genes identified need to be further explored.
Conclusions
Through a comprehensive analysis of ARG expression profiles and clinical features, we identified two key genes (CASP4 and BIRC5) related to tumor progression and prognosis. Our results show that both CASP4 and BIRC5 are overexpressed in RC, and their overexpression is associated with a poor prognosis. The prognostic model we established based on the expression levels of these two genes provides a reliable tool for predicting OS in patients with RC. In addition, the nomogram constructed, which includes the prognostic model, may help clinicians choose personalized treatments for patients with RC.
Acknowledgements
This work was supported by the National Key R&D Program of China [grant number 2018YFC2002202].
Disclosure of conflict of interest
None.
Supporting Information
References
- 1.Rao S, Yang H, Penninger JM, Kroemer G. Autophagy in non-small cell lung carcinogenesis: a positive regulator of antitumor immunosurveillance. Autophagy. 2014;10:529–531. doi: 10.4161/auto.27643. [DOI] [PMC free article] [PubMed] [Google Scholar]
- 2.Xu X, Araki K, Li S, Han JH, Ye L, Tan WG, Konieczny BT, Bruinsma MW, Martinez J, Pearce EL, Green DR, Jones DP, Virgin HW, Ahmed R. Autophagy is essential for effector CD8(+) T cell survival and memory formation. Nat Immunol. 2014;15:1152–1161. doi: 10.1038/ni.3025. [DOI] [PMC free article] [PubMed] [Google Scholar]
- 3.Hanahan D, Weinberg R. Hallmarks of cancer: the next generation. Cell. 2011;144:646–674. doi: 10.1016/j.cell.2011.02.013. [DOI] [PubMed] [Google Scholar]
- 4.Cheng Y, Ren X, Hait WN, Yang JM. Therapeutic targeting of autophagy in disease: biology and pharmacology. Pharmacol Rev. 2013;65:1162–1197. doi: 10.1124/pr.112.007120. [DOI] [PMC free article] [PubMed] [Google Scholar]
- 5.Bishop E, Bradshaw TD. Autophagy modulation: a prudent approach in cancer treatment. Cancer Chemother Pharmacol. 2018;82:913–922. doi: 10.1007/s00280-018-3669-6. [DOI] [PMC free article] [PubMed] [Google Scholar]
- 6.Siegel R, Miller K, Jemal A. Cancer statistics, 2017. CA Cancer J Clin. 2017;67:7–30. doi: 10.3322/caac.21387. [DOI] [PubMed] [Google Scholar]
- 7.Singla M, Bhattacharyya S. Autophagy as a potential therapeutic target during epithelial to mesenchymal transition in renal cell carcinoma: an in vitro study. Biomed Pharmacother. 2017;94:332–340. doi: 10.1016/j.biopha.2017.07.070. [DOI] [PubMed] [Google Scholar]
- 8.Haas NB, Appleman LJ, Stein M, Redlinger M, Wilks M, Xu X, Onorati A, Kalavacharla A, Kim T, Zhen CJ, Kadri S, Segal JP, Gimotnd Amarty PA, Davis LE, Amaravadi RK. Autophagy inhibition to augment mTOR inhibition: a phase I/II trial of everolimus and hydroxychloroquine in patients with previously treated renal cell carcinoma. Clin Cancer Res. 2019;25:2080–2087. doi: 10.1158/1078-0432.CCR-18-2204. [DOI] [PMC free article] [PubMed] [Google Scholar]
- 9.Santoni M, Piva F, De Giorgi U, Mosca A, Basso U, Santini D, Buti S, Lolli C, Terrone C, Maruzzo M, Iuliani M, Bersanelli M, Conti A, Mazzucchelli R, Montironi R, Burattini L, Berardi R. Autophagic gene polymorphisms in liquid biopsies and outcome of patients with metastatic clear cell renal cell carcinoma. Anticancer Res. 2018;38:5773–5782. doi: 10.21873/anticanres.12916. [DOI] [PubMed] [Google Scholar]
- 10.Sourbier C, Lindner V, Lang H, Agouni A, Schordan E, Danilin S, Rothhut S, Jacqmin D, Helwig JJ, Massfelder T. The phosphoinositide 3-kinase/Akt pathway: a new target in human renal cell carcinoma therapy. Cancer Res. 2006;66:5130–5142. doi: 10.1158/0008-5472.CAN-05-1469. [DOI] [PubMed] [Google Scholar]
- 11.Long J, Zhang L, Wan X, Lin J, Bai Y, Xu W, Xiong J, Zhao H. A four-gene-based prognostic model predicts overall survival in patients with hepatocellular carcinoma. J Cell Mol Med. 2018;22:5928–5938. doi: 10.1111/jcmm.13863. [DOI] [PMC free article] [PubMed] [Google Scholar]
- 12.Iasonos A, Schrag D, Raj GV, Panageas KS. How to build and interpret a nomogram for cancer prognosis. J. Clin. Oncol. 2008;26:1364–70. doi: 10.1200/JCO.2007.12.9791. [DOI] [PubMed] [Google Scholar]
- 13.Yeo W, Chan SL, Mo FK, Chu CM, Hui JW, Tong JH, Chan AW, Koh J, Hui EP, Loong H, Lee K, Li L, Ma B, To KF, Yu SC. Phase I/II study of temsirolimus for patients with unresectable hepatocellular carcinoma (HCC)- a correlative study to explore potential biomarkers for response. BMC Cancer. 2015;15:395. doi: 10.1186/s12885-015-1334-6. [DOI] [PMC free article] [PubMed] [Google Scholar]
- 14.Azim HA, Peccatori FA, Brohée S, Branstetter D, Loi S, Viale G, Piccart M, Dougall WC, Pruneri G, Sotiriou C. RANK-ligand (RANKL) expression in young breast cancer patients and during pregnancy. Breast Cancer Res. 2015;17:24. doi: 10.1186/s13058-015-0538-7. [DOI] [PMC free article] [PubMed] [Google Scholar]
- 15.Cirone M, Montani MSG, Granato M, Garufi A, Faggioni A, D’Orazi G. Autophagy manipulation as a strategy for efficient anticancer therapies: possible consequences. J Exp Clin Cancer Res. 2019;38:262. doi: 10.1186/s13046-019-1275-z. [DOI] [PMC free article] [PubMed] [Google Scholar]
- 16.Wang SS, Chen G, Li SH, Pang JS, Cai KT, Yan HB, Huang ZG, He RQ. Identification and validation of an individualized autophagy-clinical prognostic index in bladder cancer patients. Onco Targets Ther. 2019;12:3695–712. doi: 10.2147/OTT.S197676. [DOI] [PMC free article] [PubMed] [Google Scholar]
- 17.Sun S, Wang Z, Tang F, Hu P, Yang Z, Xue C, Gong J, Shi L, Xie C. ATG7 promotes the tumorigenesis of lung cancer but might be dispensable for prognosis predication: a clinicopathologic study. Onco Targets Ther. 2016;9:4975–4981. doi: 10.2147/OTT.S107876. [DOI] [PMC free article] [PubMed] [Google Scholar]
- 18.Degenhardt K, Mathew R, Beaudoin B, Bray K, Anderson D, Chen G, Mukherjee C, Shi Y, Gélinas C, Fan Y, Nelson DA, Jin S, White E. Autophagy promotes tumor cell survival and restricts necrosis, inflammation, and tumorigenesis. Cancer Cell. 2006;10:51–64. doi: 10.1016/j.ccr.2006.06.001. [DOI] [PMC free article] [PubMed] [Google Scholar]
- 19.Kimmelman AC, White E. Autophagy and tumor metabolism. Cell Metabolism. 2017;25:1037–1043. doi: 10.1016/j.cmet.2017.04.004. [DOI] [PMC free article] [PubMed] [Google Scholar]
- 20.Flood B, Oficjalska K, Laukens D, Fay J, O’Grady A, Caiazza F, Heetun Z, Mills KHG, Sheahan K, Ryan EJ, Doherty GA, Kay E, Creagh EM. Altered expression of caspases-4 and -5 during inflammatory bowel disease and colorectal cancer: diagnostic and therapeutic potential. Clin Exp Immunol. 2015;181:39–50. doi: 10.1111/cei.12617. [DOI] [PMC free article] [PubMed] [Google Scholar]
- 21.Shibamoto M, Hirata H, Eguchi H, Sawada G, Sakai N, Kajiyama Y, Mimori K. The loss of CASP4 expression is associated with poor prognosis in esophageal squamous cell carcinoma. Oncol Lett. 2017;13:1761–1766. doi: 10.3892/ol.2017.5646. [DOI] [PMC free article] [PubMed] [Google Scholar]
- 22.Soung YH, Jeong EG, Ahn CH, Kim SS, Song SY, Yoo NJ, Lee SH. Mutational analysis of caspase 1, 4, and 5 genes in common human cancers. Hum Pathol. 2008;39:895–900. doi: 10.1016/j.humpath.2007.10.015. [DOI] [PubMed] [Google Scholar]
- 23.Papoff G, Presutti D, Lalli C, Bolasco G, Santini S, Manelfi C, Fustaino V, Alemà S, Ruberti G. CASP4 gene silencing in epithelial cancer cells leads to impairment of cell migration, cell-matrix adhesion and tissue invasion. Sci Rep. 2018;8:17705–17705. doi: 10.1038/s41598-018-35792-8. [DOI] [PMC free article] [PubMed] [Google Scholar]
- 24.Tamm I, Wang Y, Sausville E, Scudiero DA, Vigna N, Oltersdorf T, Reed JC. IAP-family protein survivin inhibits caspase activity and apoptosis induced by Fas (CD95), Bax, caspases, and anticancer drugs. Cancer Res. 1998;58:5315–5320. [PubMed] [Google Scholar]
- 25.Mahotka C, Krieg T, Krieg A, Wenzel M, Suschek CV, Heydthausen M, Gabbert HE, Gerharz CD. Distinct in vivo expression patterns of survivin splice variants in renal cell carcinomas. Int J Cancer. 2002;100:30–36. doi: 10.1002/ijc.10450. [DOI] [PubMed] [Google Scholar]
- 26.Lei Y, Geng Z, Guo-Jun W, He W, Jian-Lin Y. Prognostic significance of survivin expression in renal cell cancer and its correlation with radioresistance. Mol Cell Biochem. 2010;344:23–31. doi: 10.1007/s11010-010-0525-3. [DOI] [PubMed] [Google Scholar]
- 27.Wang GC, Hsieh PS, Hsu HH, Sun GH, Nieh S, Yu CP, Jin JS. Expression of cortactin and survivin in renal cell carcinoma associated with tumor aggressiveness. World J Urol. 2009;27:557–563. doi: 10.1007/s00345-009-0376-2. [DOI] [PubMed] [Google Scholar]
- 28.Xiong C, Liu H, Chen Z, Yu Y, Liang C. Prognostic role of survivin in renal cell carcinoma: A system review and meta-analysis. Eur J Int Med. 2016;33:102–107. doi: 10.1016/j.ejim.2016.06.009. [DOI] [PubMed] [Google Scholar]
- 29.Xie Y, Ma X, Gu L, Li H, Chen L, Li X, Gao Y, Fan Y, Zhang Y, Yao Y, Zhang X. Prognostic and clinicopathological significance of survivin expression in renal cell carcinoma: a systematic review and meta-analysis. Sci Rep. 2016;6:29794–29794. doi: 10.1038/srep29794. [DOI] [PMC free article] [PubMed] [Google Scholar]
Associated Data
This section collects any data citations, data availability statements, or supplementary materials included in this article.


