Abstract
The aim of this study was to develop and validate a simulation platform that generates photon-counting CT images of voxelized phantoms with detailed modeling of manufacturer-specific components including the geometry and physics of the x-ray source, source filtrations, anti-scatter grids, and photon-counting detectors. The simulator generates projection images accounting for both primary and scattered photons using a computational phantom, scanner configuration, and imaging settings. Beam hardening artifacts are corrected using a spectrum and threshold dependent water correction algorithm. Physical and computational versions of a clinical phantom (ACR) were used for validation purposes. The physical phantom was imaged using a research prototype photon-counting CT (Siemens Healthcare) with standard (macro) mode, at four dose levels and with two energy thresholds. The computational phantom was imaged with the developed simulator with the same parameters and settings used in the actual acquisition. Images from both the real and simulated acquisitions were reconstructed using a reconstruction software (FreeCT). Primary image quality metrics such as noise magnitude, noise ratio, noise correlation coefficients, noise power spectrum, CT number, in-plane modulation transfer function, and slice sensitivity profiles were extracted from both real and simulated data and compared. The simulator was further evaluated for imaging contrast materials (bismuth, iodine, and gadolinium) at three concentration levels and six energy thresholds. Qualitatively, the simulated images showed similar appearance to the real ones. Quantitatively, the average relative error in image quality measurements were all less than 4% across all the measurements. The developed simulator will enable systematic optimization and evaluation of the emerging photon-counting computed tomography technology.
Keywords: computed tomography, simulation, photon-counting, photon-counting computed tomography, virtual clinical trial, computational phantoms
1. Introduction
Over the past several decades, computed tomography (CT) imaging has been extensively advanced to improve patient outcome by providing higher image quality at lower radiation risk. These developments include spiral imaging, multi-row detectors, higher rotation speed, dual-energy systems, and novel reconstruction algorithms.
A recent technological development in CT is the use of photon-counting detectors (PCD) [1–5], replacing conventional energy-integrating detectors (EID). PCDs are energy-sensitive detectors that directly convert an x-ray photon to electrical signal proportional to its energy [1]. Compared with EID-CT, recent studies on prototype PCD-CT systems have shown superior performance in terms of image noise, spatial resolution, contrast to noise ratio (CNR), artifacts, and material decomposition [6–15].
To bring the PCD-CT into clinical practice and to further enhance its performance, this technology still needs comprehensive assessments and application-based optimizations. These evaluations, ideally, need large scale application-based trials on actual patient images. However, such trials are challenging, considering the limited numbers of prototype PCD-CT scanners and the often-unknown ground-truth in the patient images. In addition, protocol optimization needs repetitive trials with multiple acquisitions at various imaging conditions. This is impractical in the context of patient trials due to radiation safety concerns and costs.
These challenges can be overcome by utilizing virtual clinical trials (VCTs), where an imaging experiment is performed using representative computational human and imaging models. VCTs are widely developed and utilized in x-ray-based imaging [16–24]. The utility of VCTs in PCD-CT is currently limited due to the lack of a standalone CT simulator that can generate PCD-CT images of computational phantoms with realistic considerations of a particular PCD-CT system.
We have recently developed and validated an EID-CT simulator, called DukeSim, that simulates vendor-specific EID-CT images [25]. Building upon our previous work, the purpose of this study was to extend DukeSim to simulate realistic PCD-CT images of voxelized computational phantoms while accounting for manufacturer-specific components including the geometry and physics of the x-ray source, filters, anti-scatter grids, and photon-counting detectors.
2. Materials and methods
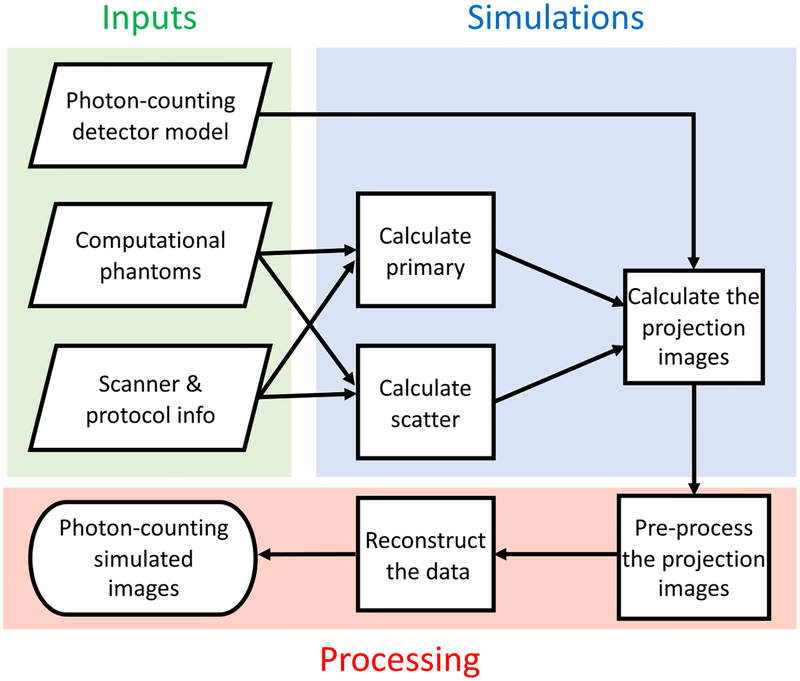
The framework for the DukeSim PCD-CT simulator is shown in figure 1. In summary, the procedure is divided into three parts: (1) inputs, (2) simulations, and (3) processing. The inputs include the computational phantoms, information regarding the scanner geometry and physics, and the PCD model. The simulations consist of calculating primary signal, scatter signal, and the final projection images. The last step performs the data pre-processing and reconstruction. The following sections further explain the details of these steps.
Figure 1.
The framework of the developed PCD-CT simulator.
2.1. Computational phantoms
The simulator works with voxelized phantoms with each structure set to a unique integer corresponding to material definitions in a material file. The density and elemental composition for each material are defined based on ICRU Report 46 [26]. A given phantom is read by the simulator and the poly-energetic linear attenuation coefficients of all the materials in the phantom are computed using tables generated from the xraylib package [27].
2.2. Scanner and protocol configurations
The scanner configuration can be setup with a user-defined focal spot size, tube photon flux spectrum (function of kV), tube current (mA), bowtie filter, beam collimation, focal spot wobbles (also known as flying focal spots), source to detector distance, source to isocenter distance, anti-scatter grids, detector size, number of detector rows and columns, detector energy thresholds, number of projections per rotation, scan range, rotation speed, and pitch. A parameter file is setup to specify these variables.
2.3. Photon-counting detector model
The simulator expects a detector response model of a prototype PCD [28–30] including the average, noise variance, and noise covariance (in case of multiple energy thresholds) signals of an incident photon hitting the detector. The implementation of the detector model in calculating the projection images is explained in the following sections.
2.4. Primary signal
Using a ray-tracing strategy, the simulator tracks the primary photons starting from the source towards each detector element. For each detector (i, j), at the projection angle α, the primary signal Npr, is calculated using the Beer-Lambert law,
| (1) |
where N0 is the number of photons at the source (post-bowtie filter), μ is the poly-energetic linear attenuation coefficient of material m (calculated using [28)), and l is the intersection length of the source-to-detector ray with the voxels of material m. To account for the finite sizes of the focal spot and detector elements, the ray-tracer calculates the intersection length K times, uniformly sampling the area of the focal spot and the detector elements. The effects of the bowtie filter (controlling N0) are modeled by attenuating the source spectrum through a bowtie filter with known geometry and material.
Using the PCD response model for a set of n energy thresholds, the primary count at each detector is estimated with a multivariate Gaussian variable with a mean vector of
| (2) |
and the covariance matrix of
| (3) |
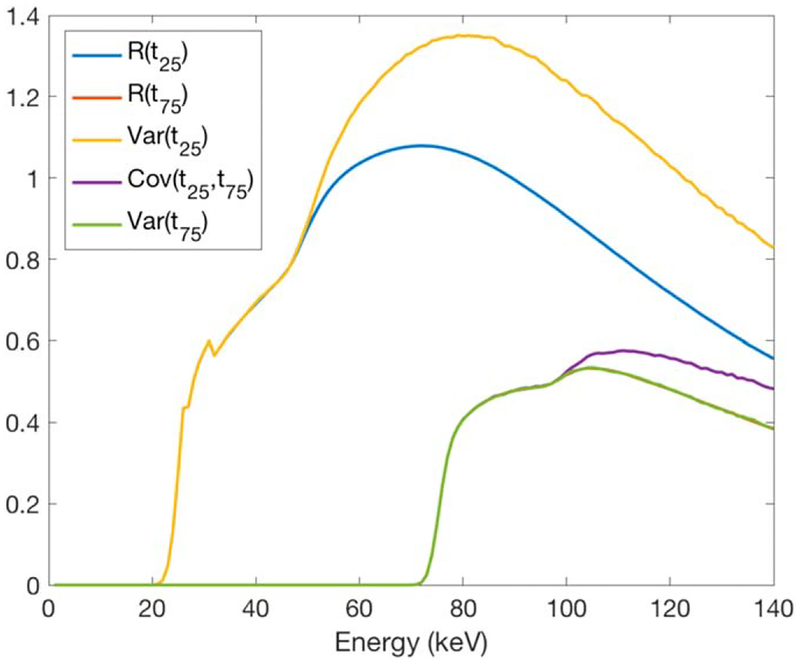
Here, R(E, tn) is the probability of an incident photon at energy bin of E being detected at the energy threshold of tn. Cov(E, tv, tw) is the covariance between the signals recorded at the energy thresholds of tv and tw for an incident photon at the energy bin E. The R(E, t) and Cov(E, tv, tw) used in this study were based on a MC simulation of a cadmium telluride (CdTe) detector with 5.86 g cm−3 density and 1.6 mm thickness. This MC simulation calculated the expected values and covariance matrix considering the x-ray effects (K escape and K reabsorption) and the electronic effects (charge sharing and electronic noise). Figure 2 shows an example of the model at the energy thresholds of 25 and 75 keV. More details on derivation of this detector model can be found in [28].
Figure 2.
The expectation, variance, and covariance values at energy thresholds of 25 and 75 keV, derived from a MC simulation [28].
2.5. Scatter signal
Since the ray-tracing module does not account for the scattered x-ray interactions, a MC tool based on the MCGPU framework [31] is used to estimate the scatter signal. The MC tool measures the scattered photons, Nsc(E, i, j, α), while rejecting the ones absorbed in the anti-scatter grids. The rejection is done using a rejection range distribution (provided by the manufacturer in this study and can also be measured empirically).
Similar to the primary signal, the scatter signal is estimated with a multivariate gaussian variable with the mean vector of
| (4) |
and the covariance matrix of
| (5) |
where R(E, t) and Cov(E, tv, tw) are the same detector response values discussed in the previous section.
The MC output for the scatter simulation has fluctuation due to the finite number of simulated histories. This effect can be reduced by simulating a large number of histories, but that is computationally expensive. Therefore, those fluctuations are smoothed using an established smoothing scatter kernel [32]. Similar to how clinical scanners typically suppress the effects of scatter, the estimated scatter signals are corrected by measuring the scatter in a row outside the collimation and subtracting it from the other rows [33].
2.6. Projection images
To add noise to the detector signals, a correlated multivariate Gaussian random number generator is used with the mean vector of M(tot) = M(pr) + M(sc) and covariance matrix of K(tot) = K(pr) + K(sc).
Similar to clinical CT scans, the final simulated projection images for each energy threshold are computed as , where Nt is the noisy and detector signal at the energy threshold of t, and N0 is the air scan in that threshold (detector unattenuated signal). For each energy bin (between two thresholds of t1 and t2), the projection images are calculated as .
2.7. Beam hardening artifact correction
The simulator reduces the beam hardening effects, caused by the poly-energetic nature of the source spectrum, by applying a polynomial water correction [34]
| (6) |
where the polynomial coefficients of bp are calculated applying the fit of poly-energetic detector signals (of water with different diameters) to ideal mono-energetic ones. The coefficients are uniquely derived for different detector channels, energy thresholds (or energy bins), source spectrums, and bowtie filters.
2.8. Computational considerations
As discussed in [25], simulations of CT projection images are computationally expensive. The simulator loads a high-resolution voxelized phantom (sub-mm voxel size) and calculates projection signals for tens of thousands of detectors, thousands of projections per rotation, and multiple rotations, across hundreds of energy bins. This can be even more challenging in PCD simulations, where each detector can have multiple signals (multiple energy thresholds). To make the program computationally efficient, it was written in C++ and linked it to the NVIDIA CUDA libraries to calculate the independent measurements in parallel (e.g., the intersection path lengths for different detector elements and projection angles), using multiple graphical processing units (GPUs).
2.9. Validation
A validation study was done to evaluate the realism of the PCD-CT simulator by comparing the image quality of simulated PCD-CT data with real data acquired using an actual prototype scanner.
A physical CT ACR phantom was imaged with macro mode (0.5 mm detector size and 32 × 0.5 mm beam collimation) at four different dose levels (36, 72, 144, 216 mAs, corresponding to 4, 8, 16, and 24 mGy), 0.5 second of rotation time, body mode (with Siemens standard ‘body’ bowtie filter), a tube voltage of 140 kV, pitch of 1.0, and energy thresholds of 25 and 75 keV using a research prototype PCD-CT scanner (Siemens Healthcare, Germany) [35, 36] at the National Institutes of Health Clinical Center.
The simulator was setup to mimic the geometry and physics of the research prototype PCD-CT scanner (information was provided by the manufacturer), including spectrum, bowtie filter, focal spot size and positions, anti-scatter grids, and the detector model. A computational model of the ACR phantom was imaged using the developed PCD-CT simulator, with similar imaging conditions used in the actual scans. In the simulations, focal spot and detector elements were uniformly sub-sampled 4 times (total of 16) to approximate their finite sizes.
Both the real and simulated projection images were reconstructed with a weighted filtered back-projection algorithm using an open source reconstruction software, FreeCT [37] with the ‘Medium’ kernel. All the reconstructed images had 512 × 512 in-plane pixels, 215 mm reconstruction field of view, and 1.5 mm slice thickness.
The simulated and real images were compared with each other in terms of fundamental image quality metrics: noise magnitude, noise ratio (between energy thresholds), noise correlation coefficients (between energy thresholds), noise power spectrum (NPS), CT number, in-plane modulation transfer function (MTF), and slice sensitivity profile.
The noise measurements were done in the uniform sections of the phantom. The noise ensemble was sampled by placing squared regions of interests (ROIs, 25 mm in size) 50 mm away from the image center. All the noise measurements were done in 11 consecutive slices where the average image of those slices was subtracted to avoid deterministic signals in the noise calculations.
For each energy threshold and energy bin, the noise magnitude was calculated as the standard deviation, measured and averaged across all the ROIs. The noise ratio was calculated by dividing the 25 keV noise magnitude by the 75 keV noise magnitude. The correlation coefficient, CC, between the thresholds 25 and 75 keV, were measured as
| (7) |
where Q is the number of ROIs (8 in this study). The NPS was measured using the algorithm explained in [38] with the same ROIs as used for noise magnitude measurements.
The in-plane MTF was measured in the edges of the high-contrast inserts (Air and Bone) using the algorithm explained in [38]. The z-resolution was evaluated measuring slice sensitivity profiles of the two tungsten carbide beads (0.28 mm in diameter) available in the ACR phantom. For measuring these pro-files, both real and simulated projection images were reconstructed with a slice thickness of 0.5 mm and overlaps of 0.1 mm. ROIs were placed around the tungsten bead and the maximum value was measured in each slice. The profile was normalized to the range of [0, 1] and plotted as a function of ‘z’ position.
The simulator was further evaluated in terms of its utility in material quantification studies. A simulation was done by replicating a previous study [39] where multiple concentrations of bismuth (5, 10, 15 mg ml−1), iodine (4, 8, 16 mg ml−1), and gadolinium (4, 8, 16 mg ml−1) were imaged at multiple energy thresholds with lower threshold of 20 keV and upper thresholds of 50, 60, 70, 80, 90 keV. The real images were acquired at 140 kV and ‘sharp’ mode (0.25 mm detector size for low-energy threshold and 0.5 mm detector size for high-energy threshold with 48 × 0.25 mm beam collimation), pitch of 1.0, using the prototype PCD-CT scanner (Siemens Healthcare, Germany), at the National Institutes of Health Clinical Center.
The simulation was setup to mimic the same scanner settings and contrast materials used in that study [39]. The linear attenuation coefficients were calculated using the xraylib package [27] and the elemental compositions for each material at each concentration levels. Both real and simulated images were reconstructed using the FreeCT [37] reconstruction software and the ‘Medium’ kernel. All the reconstructed images had 512 × 512 in-plane pixels, a 215 mm reconstruction field of view, and a 1.5 mm slice thickness. The CT values were recorded for all contrast vials in the real and simulated images and compared against each other.
3. Results
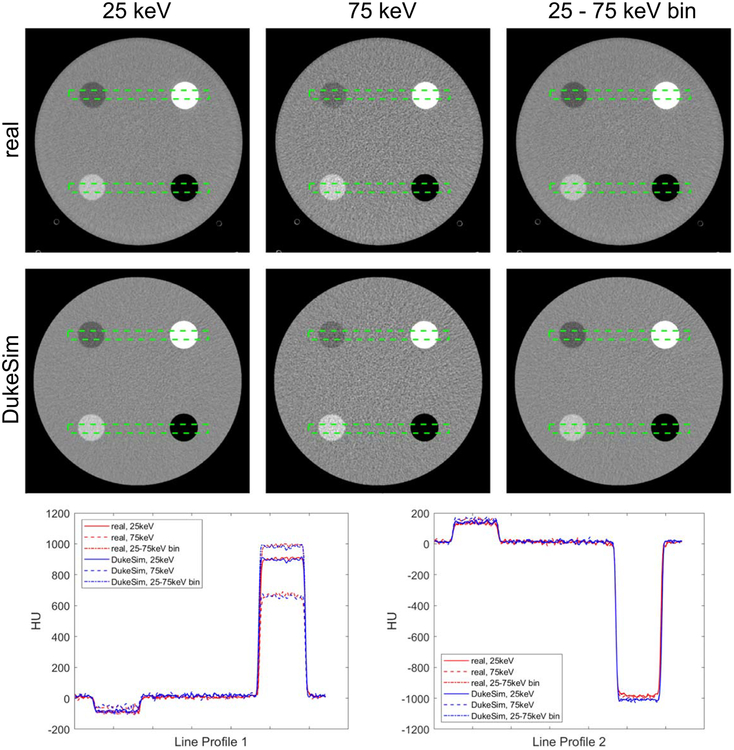
Figure 3 shows real and simulated PCD-CT images at 25 and 75 keV energy thresholds and the ‘25–75 keV’ energy bin. ‘Threshold’ images only reflect photons beyond an energy threshold, and ‘bin’ images reflect photons between two energy thresholds. With this definition, the ‘75 keV’ threshold images and the ‘75–140 keV’ bin images (140 is the tube voltage used in this study) are equivalent and thus, in this paper we referred to them as ‘75 keV’ threshold images terms.
Figure 3.
The real and simulated PCD images at 25 keV, 75 keV, and the bin between 25 and 75 keV. Two line profiles are shown comparing the intensity values. The images are shown with a window of 600 and level of 0 Hounsfield Units (HU), HU values were calculated setting the mass attenuation coefficient of water to be 0.0172 mm2 g−1.
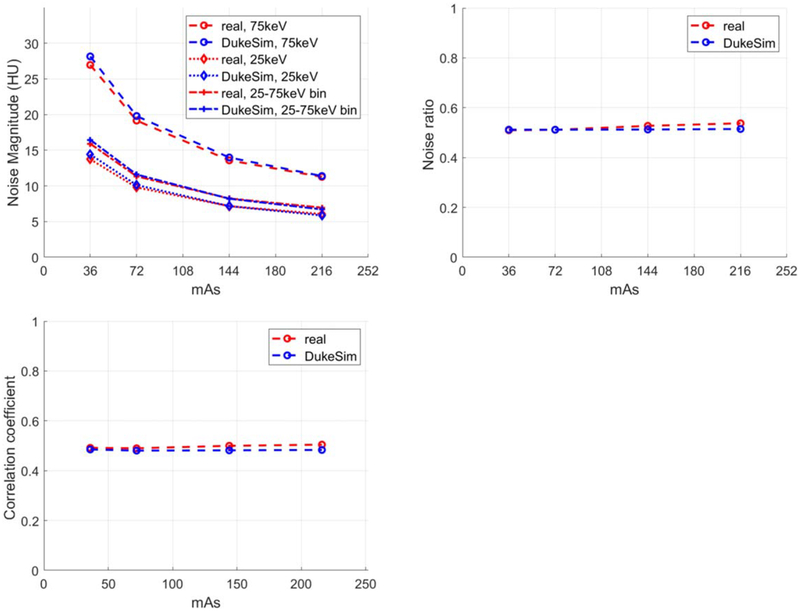
Qualitatively, the simulated and real images had similar appearances. In the lower threshold images, the images were less noisy because more photons are counted compared to the higher thresholds. The CT numbers extracted from both real and simulated cases are tabulated in table 1. Overall, the CT numbers in the simulated images are very close to real data with similar trends (changes in HU as a function of energy thresholds and bins). Minor discrepancies may be attributed to possible minor differences in the actual and simulated density values or minor unknown physical processes not explicitly modeled by the simulation. Figure 4 shows the noise magnitude, noise ratio, and noise correlation coefficient of the real and simulated images at the 4 dose levels. Results demonstrated that the simulated images had a noise magnitude similar to real images with 1.28 ± 3.6%, 3.03 ± 1.36%, and 0.44 ± 3.12% relative errors for 25 keV, 75 keV, and the ‘25–75 keV’ bin, respectively. For noise ratio, the error between real and simulations was −1.73 ± 2.26%. The correlation coefficient results demonstrate the existing correlation between the threshold images and the realistic modeling of this effect in the simulations with the relative error of −2.94 ± 2.13%. In the real data, a slight increase occurred in the noise ratio and correlation coefficient, suggesting slight non-linear effects (like dead-time losses) happening in the high dose regime.
Table 1.
CT numbers extracted from real and simulated images of ACR phantom averaged across 4 measurements (4 dose levels).
| Bone | Acrylic | Water | Polyethylene | Air | ||
|---|---|---|---|---|---|---|
| 25 keV | Real | 873.0 ± 2.4 | 121.3 ± 0.2 | −2e-9 ± 1e-7 | −96.3 ± 0.5 | −972.1 ± 1.8 |
| DukeSim | 865.9 ± 0.6 | 126.3 ± 0.3 | −4e-8 ± 9e-8 | −90.5 ± 0.0 | −999.9 ± 0.1 | |
| 75 keV | Real | 642.6 ± 1.8 | 140.0 ± 1.5 | −1e-8 ± 2e-7 | −71.3 ± 1.8 | −978.3 ± 2.1 |
| DukeSim | 631.7 ± 0.8 | 145.1 ± 0.5 | −6e-8 ± 4e-8 | −62.7 ± 0.5 | −1001 ± 0.7 | |
| 25–75 keV | Real | 956.8 ± 1.3 | 115.3 ± 0.2 | 2e-8 ± −1e-7 | −104.6 ± 0.4 | −971.3 ± 1.5 |
| DukeSim | 947.3 ± 0.9 | 121.0 ± 0.3 | 1e-8 ± 1e-7 | −98.6 ± 0.1 | −999.9 ± 0.1 |
Figure 4.
Noise magnitude (top left), noise ratio of 25 keV over 75 keV (top right), and noise correlation coefficient (bottom) measured at multiple dose levels for both real and simulated images.
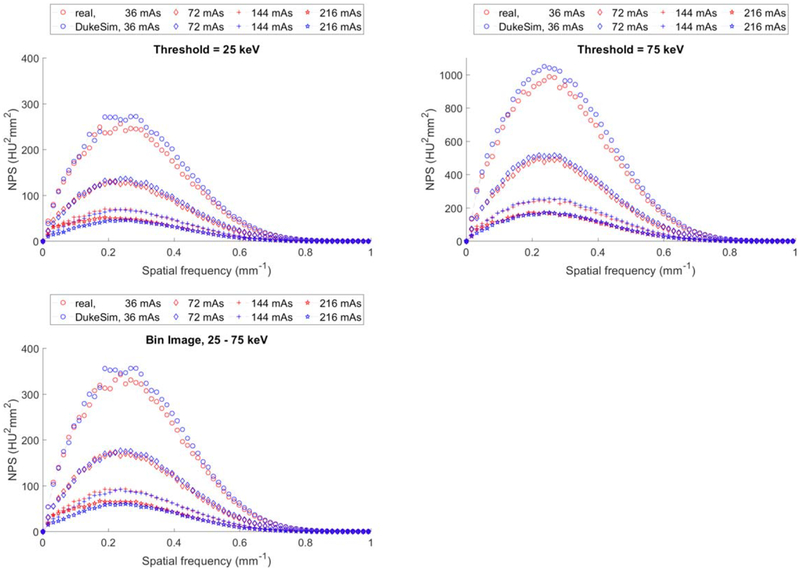
Figure 5 shows a comparison of the NPS curves for the real and simulated images. The simulations compare favorably to the real data, demonstrating that the noise texture in the simulations are similar to the noise texture in the real images. The relative errors for the average frequency of NPS curves were 4.08 ± 2.57%, 1.56 ± 1.09%, and 2.95 ± 2.01% for 25 keV, 75 keV, and the ‘25–75 keV’ bin, respectively.
Figure 5.
Noise power spectrum (NPS) measured in real (red) and simulated (blue) images at 25 keV (top-left), 75 keV (top-right), and 25–75 keV (bottom).
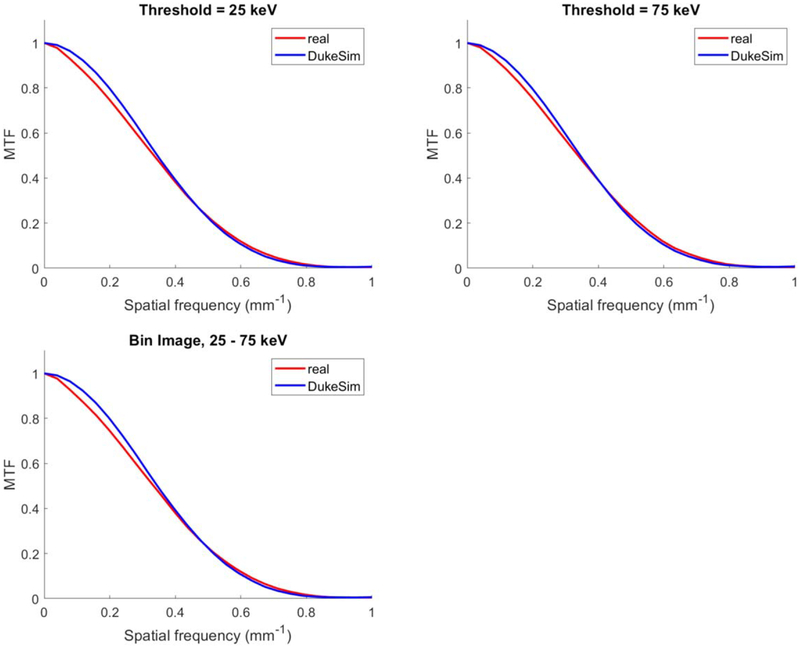
Figure 6 shows the in-plane MTF measurements for both real and simulated images. MTF curves show close agreements between the real and simulated images with relative errors in the half-value frequency listed in table 2.
Figure 6.
Modulation transfer function measured in the ‘Air’ insert in the real (red) and simulated (blue) images at 25 keV (top-left), 75 keV (top-right), and 25–75 keV (bottom).
Table 2.
Percent relative error between real and simulated images in terms of in-plane MTF half-value frequency.
| Air | Bone | |
|---|---|---|
| 25 keV | 3.01 ± 2.00% | 4.45 ± 0.44% |
| 75 keV | 1.90 ± 2.44% | 3.35 ± 2.12% |
| 25–75 keV | 3.32 ± 1.87% | 4.47 ± 0.32% |
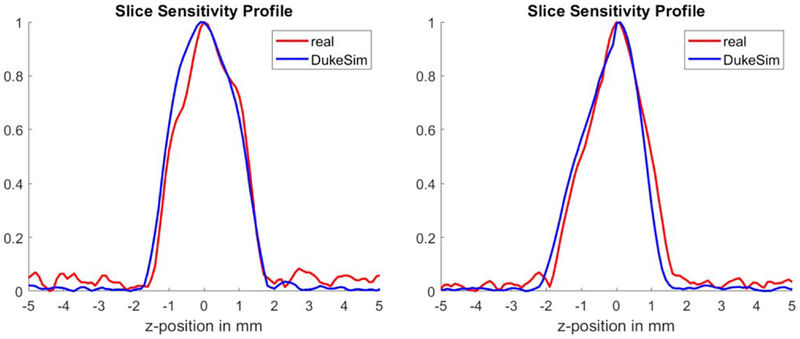
Figure 7 shows the slice sensitivity profiles for both real and simulated images, measured at the center and off-center of the phantom. The plots demonstrate that the real and simulated images have close z-resolution profiles with relative errors of 1.39% (at the center) and −0.73% (at the off-center) in terms of the full-width-at-half-maximum (FWHM). For both real and simulated cases, the FWHM was approximately 2 mm which is wider than typically expected for images with 0.5 mm slice thicknesses. This was due to the windmill artifact being present around the high contrast object (‘tungsten’) for both real and simulated images. More advanced reconstruction algorithms and more sampling in the z-direction (e.g., flying focal spots) would reduce the FHWM.
Figure 7.
Slice sensitivity profiles measured using the tungsten beads available in the center (left plot) and off-center (right plot) of the ACR phantom. Red plots are measured from the real data and blue plots are measured from simulations.
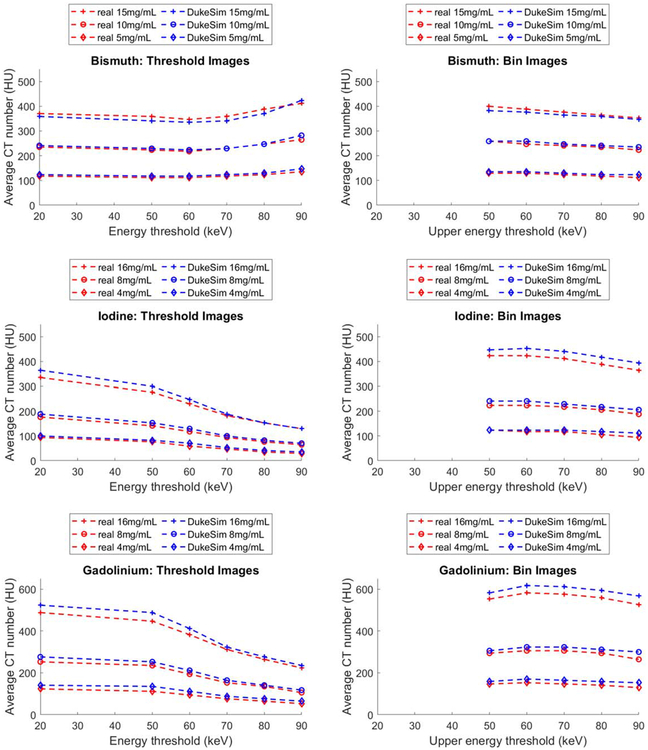
Figure 8 shows the average CT numbers for the three contrast agents at three concentration levels and six energy thresholds and corresponding energy bins for the real data and the simulations. The results demonstrate close agreement between HU values of the simulated and real images. Notably, the changes in CT numbers as a function of energy threshold and energy bin were similar for both real and simulated images. In the threshold images, for both real and simulated images, CT values decreased as a function of energy thresholds for iodine and gadolinium whereas they slightly increased for bismuth. In the energy bin images, for both real and simulated data, CT values decreased as a function of upper energy threshold (lower energy threshold was set to 20 keV), with the bismuth and gadolinium having a peak at energy bin of’20–60 keV’.
Figure 8.
Average CT numbers of Bismuth, Iodine, and Gadolinium contrast agents measured at 3 concentration levels and 6 energy thresholds in both real (red) and simulated (blue) images. For the bin images, the lower threshold was 20 keV. To convert the attenuation values to HU, the mass attenuation coefficient of water was assumed to be 0.0172 mm2 g−1.
The differences between the real and simulated images were 0.9 ± 10.2 HU (max = 17.6), 13.0 ± 9.3 HU (max = 29.4), and 20.8 ± 10.0 HU (max = 41.0) for bismuth, iodine, and gadolinium, respectively. These differences correspond to relative errors of 0.10 ± 0.84 %, 0.80 ± 0.57 %, and 1.89 ± 0.58% in the attenuation coefficient scale. Since the real and simulated results follow similar trends, these discrepancies could be due to potential minor differences between the concentrations of the real and simulated contrast agents or minor unknown physical processes not explicitly modeled by the simulation.
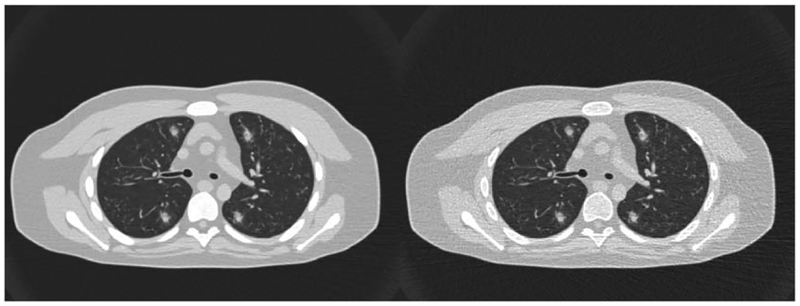
Figure 9 shows PCCT images of a computational human model (XCAT phantom) with simulated lesions inserted in the lungs, imaged with the developed PCCT simulator. This demonstrates the simulator capability in imaging human models with intra-organ heterogeneities and its utility for future virtual clinical trials.
Figure 9.
Photon-counting images an XCAT phantom with some inserted lesions, imaged with the developed simulator at images at 25 (left) and 75 (right) keV. Images are shown with a window/level of −400/1400 HU.
4. Discussion
The emerging and promising PCD-CT technology needs comprehensive evaluation and application-based optimizations to be widely used in the clinic. Realistic computer simulations can be utilized to speed up these assessments by performing relevant and large-scale experiments using representative human models and PCD-CT imaging models. In this work, we developed and validated a PCD-CT simulator that is able to image voxelized phantoms with manufacturer-specific considerations of the scanner geometry, physics of the x-ray source, filters, anti-scatter grids, and photon-counting detectors. We showed that our developed simulator can generate PCD-CT images with noise, image contrast, and resolution features similar to a research prototype scanner across multiple dose levels and energy thresholds.
To evaluate the performance of the simulator, one needs to perform one-to-one experiments using the real scanner and the simulator, and compare the results against one another. As such, the ‘object’ being imaged should be exactly the same in both real and simulated acquisitions, so any difference between the real and simulated results would be reflective of the performance of the simulator. Therefore, in the context of validating a simulator, clinical ‘patient’ images cannot be used as the exact ground truth of a given patient cannot be known. In this study, we thus deployed object of known ground truth as a basis to validate the accuracy of the simulator. Hinging on this first step, the simulator can be used to simulate imaging of computational phantoms with the confidence that the results would be reflective of images if such computational phantoms were physically imaged by the actual scanner.
Given a particular scanner configuration and detector model, the developed simulator is able to generate primary and scattered signals and model correlated noise for multiple energy thresholds. The developed simulator accounts for post-bowtie filter spectra, focal spot wobbles, finite sampling of the source and detector areas, detector response, and beam hardening correction. All of these features are developed in a modular way, so a user can adjust them based on a desired experiment. For example, if a new photon-counting detector is introduced, one can input the detector response model of that in the simulator and generate CT images for the particular detector. Or one can incorporate different bowtie filter models (e.g., with or without tin filters) depending on the study of interest.
Our simulator can be also used to optimize the imaging parameters and processing (such as spectrum, bowtie filter, focal spot wobbling, energy thresholds, detector sizes, beam hardening corrections, detector artifacts, reconstruction algorithm) in an application-specific manner.
The developed PCD-CT simulator is compatible with any given voxel phantom. This feature, not available in the surface-based simulators, would enable studying image quality using phantoms with sub millimeter voxel sizes (high-resolution) and intra-organ heterogeneities. Additionally, our simulation framework can be also used to validate the accuracy of the PCD response models against real data. For example, the detector response model used in this study, derived from (1), provided a realistic approximation of the detectors mean and variance (and covariance) in the range of 36 to 216 mAs dose levels.
This study had some limitations. The validations were done using a simplistic uniform phantom. While these validations are reflective of the accuracy of our simulator, they can be even stronger if they are done using physical heterogenous anthropomorphic phantoms (not currently available). Future work will pursue 3D printing of our recently developed anthropomorphic phantoms with the heterogenous intra-organs [40–42] for more extensive validations. The detector model used in this study did not account for pile-up effects which is a secondary effect for the phantom and conditions used in this study, as demonstrated in the validation results. Future work will be done to improve the accuracy of the detector model by incorporating pile-up effects.
The other limitation was that the validations were done using one PCD-CT mode and reconstructed with a manufacturer-generic reconstruction software. In a future study, using the modular nature of the simulator, we will model and validate our simulator against different PCD modes and scanners, and reconstruct them using manufacturer-specific reconstruction algorithms.
5. Conclusion
A realistic simulation platform for photon-counting CT paves the way towards evaluation and parameter optimizations of this promising technology. While not practical using expensive and ground truth-limited clinical trials, these studies can be explored using our developed photon-counting simulator, when combined with representative anthropomorphic phantoms.
Acknowledgments
This project was supported by a research grant from the National Institutes of Health (R01EB001838). The authors would like to thank Juan Carlos Ramirez from Siemens Healthcare for helpful discussions. The authors also acknowledge the developers of the FreeCT software which was used for the validation section of this study.
References
- [1].Taguchi K and Iwanczyk JS 2013. Vision 20/20: single photon counting x-ray detectors in medical imaging Med. Phys 40 [DOI] [PMC free article] [PubMed] [Google Scholar]
- [2].Gimenez EN et al. 2011. Characterization of Medipix3 with synchrotron radiation IEEE Trans. Nucl. Sci 58 323–32 [Google Scholar]
- [3].Gustavsson M, Amin FU, Bjorklid A, Ehliar A, Xu C and Svensson C 2012. A high-rate energy-resolving photon-counting ASIC for spectral computed tomography IEEE Trans. Nucl. Sci 59 30–9 [Google Scholar]
- [4].Iwanczyk JS, Barber W, Nygård E, Malakhov N, Hartsough N and Wessel J 2010. Photon-counting energy-dispersive detector arrays for x-ray imaging Electronics for Radiation Detection (Boca Raton, FL: CRC Press; ) pp 59–96 [DOI] [PMC free article] [PubMed] [Google Scholar]
- [5].Xu C et al. 2013. Evaluation of a second-generation ultra-fast energy-resolved ASIC for photon-counting spectral CT IEEE Trans. Nucl. Sci 60 437–45 [Google Scholar]
- [6].Baek J, Pineda AR and Pelc NJ 2013. To bin or not to bin? The effect of CT system limiting resolution on noise and detectability Physics in Medicine & Biology. 58 1433. [DOI] [PubMed] [Google Scholar]
- [7].Gutjahr R et al. 2016. Human imaging with photon-counting-based CT at clinical dose levels: contrast-to-noise ratio and cadaver studies Investigative Radiology. 51 421. [DOI] [PMC free article] [PubMed] [Google Scholar]
- [8].Leng S et al. 2017. Spectral performance of a whole-body research photon counting detector CT: quantitative accuracy in derived image sets Physics in Medicine & Biology. 62 7216. [DOI] [PMC free article] [PubMed] [Google Scholar]
- [9].Pourmorteza A, Symons R, Henning A, Ulzheimer S and Bluemke DA 2018. Dose efficiency of quarter-millimeter photon-counting computed tomography: first-in-human results Investigative radiology. 53 365–72 [DOI] [PubMed] [Google Scholar]
- [10].Pourmorteza A et al. 2017. Photon-counting ct of the brain: in vivo human results and image-quality assessment American Journal of Neuroradiology. 38 2257–63 [DOI] [PMC free article] [PubMed] [Google Scholar]
- [11].Shikhaliev PM 2005. Beam hardening artefacts in computed tomography with photon counting, charge integrating and energy weighting detectors: a simulation study Physics in Medicine & Biology. 50 5813. [DOI] [PubMed] [Google Scholar]
- [12].Symons R et al. 2016. Low-dose lung cancer screening with photon-counting CT: a feasibility study Physics in Medicine & Biology. 62 202. [DOI] [PMC free article] [PubMed] [Google Scholar]
- [13].Symons R et al. 2017. Feasibility of dose-reduced chest CT with photon-counting detectors: initial results in humans Radiology 285 980–9 [DOI] [PMC free article] [PubMed] [Google Scholar]
- [14].Yu Z et al. 2016. Evaluation of conventional imaging performance in a research whole-body CT system with a photon-counting detector array Physics in Medicine & Biology. 61 1572. [DOI] [PMC free article] [PubMed] [Google Scholar]
- [15].Willemink MJ, Persson M, Pourmorteza A, Pelc NJ and Fleischmann D 2018. Photon-counting CT: technical principles and clinical prospects Radiology 172656 [DOI] [PubMed] [Google Scholar]
- [16].Sahbaee P, Segars WP and Samei E 2014. Patient-based estimation of organ dose for a population of 58 adult patients across 13 protocol categories Med. Phys 41 072104. [DOI] [PMC free article] [PubMed] [Google Scholar]
- [17].Sahbaee P, Segars WP, Marin D, Nelson RC and Samei E 2017. The effect of contrast material on radiation dose at CT:I. Incorporation of contrast material dynamics in anthropomorphic phantoms Radiology 283 739–48 [DOI] [PMC free article] [PubMed] [Google Scholar]
- [18].Abadi E, Segars WP, Harrawood B, Kapadia A and Samei E 2018. Virtual clinical trial in action: textured XCAT phantoms and scanner-specific CT simulator to characterize noise across CT reconstruction algorithms Medical Imaging 2018: Physics of Medical Imaging (International Society for Optics and Photonics) ( 10.1117/12.2294599) [DOI]
- [19].Badano A, Badal A, Glick S, Graff CG, Samuelson F, Sharma D and Zeng R 2017. In silico imaging clinical trials for regulatory evaluation: initial considerations for VICTRE, a demonstration study Proc. SPIE 10132, Medical Imaging 2017: Physics of Medical Imaging, 1013220 (9 March 2017) ( 10.1117/12.2255746) [DOI]
- [20].Bakic PR, Pokrajac DD, De Caro R and Maidment ADA 2014. Realistic simulation of breast tissue microstructure in software anthropomorphic phantoms Breast Imaging IWDM 2014 (Lect. Notes Comput. Sci. vol 8539) ed Fujita H, Hara T and Muramatsu C (Cham: Springer; ) [Google Scholar]
- [21].Graff CG A new, open-source, multi-modality digital breast phantom Proc. SPIE 9783, Medical Imaging 2016: Physics of Medical Imaging, 978309 (22 March 2016) ( 10.1117/12.2216312)) [DOI] [Google Scholar]
- [22].Kiarashi N et al. 2015. Development of realistic physical breast phantoms matched to virtual breast phantoms based on human subject data Med. Phys 42 4116–26 [DOI] [PubMed] [Google Scholar]
- [23].Maidment AD (ed) 2014. Virtual clinical trials for the assessment of novel breast screening modalities International Workshop on Digital Mammography (Berlin: Springer; ) [Google Scholar]
- [24].Pokrajac DD, Maidment AD and Bakic PR 2012. Optimized generation of high resolution breast anthropomorphic software phantoms Med. Phys 39 2290–302 [DOI] [PMC free article] [PubMed] [Google Scholar]
- [25].Abadi E, Harrawood B, Sharma S, Kapadia A, Segars WP and Samei E 2018. DukeSim: a realistic, rapid, and scanner-specific simulation framework in computed tomography IEEE Trans. Med. Imaging [DOI] [PMC free article] [PubMed] [Google Scholar]
- [26].White D, Griffith R and Wilson I Report 46. Journal of the ICRU. 1992(1):NP-NP 10.1093/jicru/os24.1.Report46
- [27].Schoonjans T et al. 2011. The xraylib library for x-ray–matter interactions. Recent developments Spectrochim. Acta, Part B 66 776–84 [Google Scholar]
- [28].Stierstorfer K 2018. Modeling the frequency-dependent detective quantum efficiency of photon-counting x-ray detectors Med. Phys 45 156–66 [DOI] [PubMed] [Google Scholar]
- [29].Taguchi K, Stierstorfer K, Polster C, Lee O and Kappler S 2018. Spatio-energetic cross-talk in photon counting detectors: numerical detector model (Pc TK) and workflow for CT image quality assessment Med. Phys 45 1985–98 [DOI] [PubMed] [Google Scholar]
- [30].Taguchi K, Stierstorfer K, Polster C, Lee O and Kappler S 2018. Spatio-energetic cross-talk in photon counting detectors: N × N binning and sub-pixel masking Med. Phys [DOI] [PubMed] [Google Scholar]
- [31].Badal A and Badano A 2009. Accelerating Monte Carlo simulations of photon transport in a voxelized geometry using a massively parallel graphics processing unit Med. Phys 36 4878–80 [DOI] [PubMed] [Google Scholar]
- [32].Bhatia N, Tisseur D, Buyens F and Letang JM 2016. Scattering correction using continuously thickness-adapted kernels NDT & E International. 78 52–60 [DOI] [PubMed] [Google Scholar]
- [33].Petersilka M, Stierstorfer K, Bruder H and Flohr T 2010. Strategies for scatter correction in dual source CT Med. Phys 37 5971–92 [DOI] [PubMed] [Google Scholar]
- [34].Hsieh J 2009. Computed Tomography: Principles, Design, Artifacts, and Recent Advances. 2nd ed (Bellingham, WA: SPIE; ) [Google Scholar]
- [35].Kappler S, Hannemann T, Kraft E, Kreisler B, Niederloehner D, Stierstorfer K and Flohr T First results from a hybrid prototype CT scanner for exploring benefits of quantum-counting in clinical CT Proc. SPIE 8313, Medical Imaging 2012: Physics of Medical Imaging, 83130X (2 March 2012) ( 10.1117/12.911295)) [DOI] [Google Scholar]
- [36].Kappler S, Glasser F, Janssen S, Kraft E and Reinwand MA research prototype system for quantum-counting clinical CT Proc. SPIE 7622, Medical Imaging 2010: Physics of Medical Imaging, 76221Z (22 March 2010) ( 10.1117/12.844238)) [DOI] [Google Scholar]
- [37].Hoffman J, Young S, Noo F and McNitt-Gray M 2016. Technical Note: FreeCT_wFBP: a robust, efficient, open-source implementation of weighted filtered backprojection for helical, fan-beam CT Med. Phys 43 1411–20 [DOI] [PMC free article] [PubMed] [Google Scholar]
- [38].Solomon J, Wilson J and Samei E 2015. Characteristic image quality of a third generation dual-source MDCT scanner: noise, resolution, and detectability Med. Phys 42 4941–53 [DOI] [PubMed] [Google Scholar]
- [39].Rajagopal JR, Sahbaee P, Abadi E, Negussie AH, Pritchard WF, Wood BJ, Jones EC and Samei E 2019. Impact of energy threshold on material quantification of contrast agents in photon-counting CT Proc. SPIE 10948, Medical Imaging 2019: Physics of Medical Imaging, 109484N (1 March 2019) ( 10.1117/12.2512944)) [DOI]
- [40].Abadi E, Segars WP, Sturgeon GM, Harrawood B, Kapadia A and Samei E 2018. Modeling ‘Textured’ bones in virtual human phantoms IEEE Transactions on Radiation and Plasma Medical Sciences 3 47–53 [DOI] [PMC free article] [PubMed] [Google Scholar]
- [41].Abadi E, Segars WP, Sturgeon GM, Roos JE, Ravin CE and Samei E 2017. Modeling lung architecture in the XCAT series of phantoms: physiologically based airways, arteries and veins IEEE Trans. Med. Imaging 37 693–702 [DOI] [PMC free article] [PubMed] [Google Scholar]
- [42].Abadi E, Sturgeon GM, Agasthya G, Harrawood B, Hoeschen C, Kapadia A, Segars WP and Samei E 2017. Airways, vasculature, and interstitial tissue: anatomically informed computational modeling of human lungs for virtual clinical trials Proc. SPIE 10132, Medical Imaging 2017: Physics of Medical Imaging, 101321Q (9 March 2017) ( 10.1117/12.2254739) [DOI]


