

Abstract
Histone deacetylase 3 (HDAC3) is unique among the HDAC superfamily of chromatin modifiers that silence transcription through enzymatic modification of histones because interaction with nuclear receptor corepressors (NCoR1/2) is required for engagement of its catalytic activity1–3. However, loss of HDAC3 also represses transcription4–8. Here we report that, during lipopolysaccharide (LPS) activation of macrophages, recruitment of HDAC3 to ATF2-bound sites without NCoR1/2 non-canonically activates inflammatory gene expression. By contrast, HDAC3 deacetylase activity is selectively engaged at ATF3-bound sites that suppress toll-like receptor (TLR) signaling. Deletion of HDAC3 in macrophages safeguards mice from lethal exposure to LPS, but this protection is not conferred by genetic or pharmacological abolition of HDAC3 catalytic activity. Thus, HDAC3 is a dichotomous transcriptional activator and repressor whose non-canonical deacetylase-independent functions are vital for the innate immune system.
In contrast to the lethality conferred by global loss of HDAC3, genetic inactivation of HDAC3 enzymatic activity through disruption of the deacetylase-activating domain (DAD) of NCoR1 and NCoR2 is compatible with life with no overt physiological abnormalities3. Such evidence highlights the importance of HDAC3 non-enzymatic functions that remain poorly characterized and bear critical implications for the development of deacetylase-targeting drugs such as suberoylanilide hydroxamic acid (SAHA), an HDAC inhibitor that is FDA-approved for the treatment of cancer and is being tested for efficacy in other diseases9–13. Deletion of HDAC3 diminishes the TLR4-mediated hyperinflammatory response to LPS in macrophages due to impaired activation of pro-inflammatory genes, but the mechanism is unknown4. Here we identify a non-canonical mechanism whereby HDAC3 switches between its enzymatic states to contribute to both repression and activation of gene transcription in a single cell type.
To determine whether HDAC3 has deacetylase (DA)-independent functions, we utilized bone-marrow derived macrophages (BMDM) with myeloid-specific deletion of HDAC3 (MHD3KO) that were cultured in vitro after retrovirally-mediated expression of empty control vector, the catalytically-dead Y298F mutant, or wild-type HDAC3 (WT-rescue)5,14. Y298F expression was titrated such that both the mRNA (Fig. 1a) and the protein (Fig. 1b) levels were comparable to that of endogenous HDAC3. Deacetylase activity of immunoprecipitated HDAC3 from Y298F-expressing cells was markedly reduced, to a level indistinguishable from that of MHD3KO macrophages (Fig. 1c).
Figure 1 |. HDAC3 activates LPS-stimulated inflammatory gene expression in a deacetylase (DA)-independent manner.
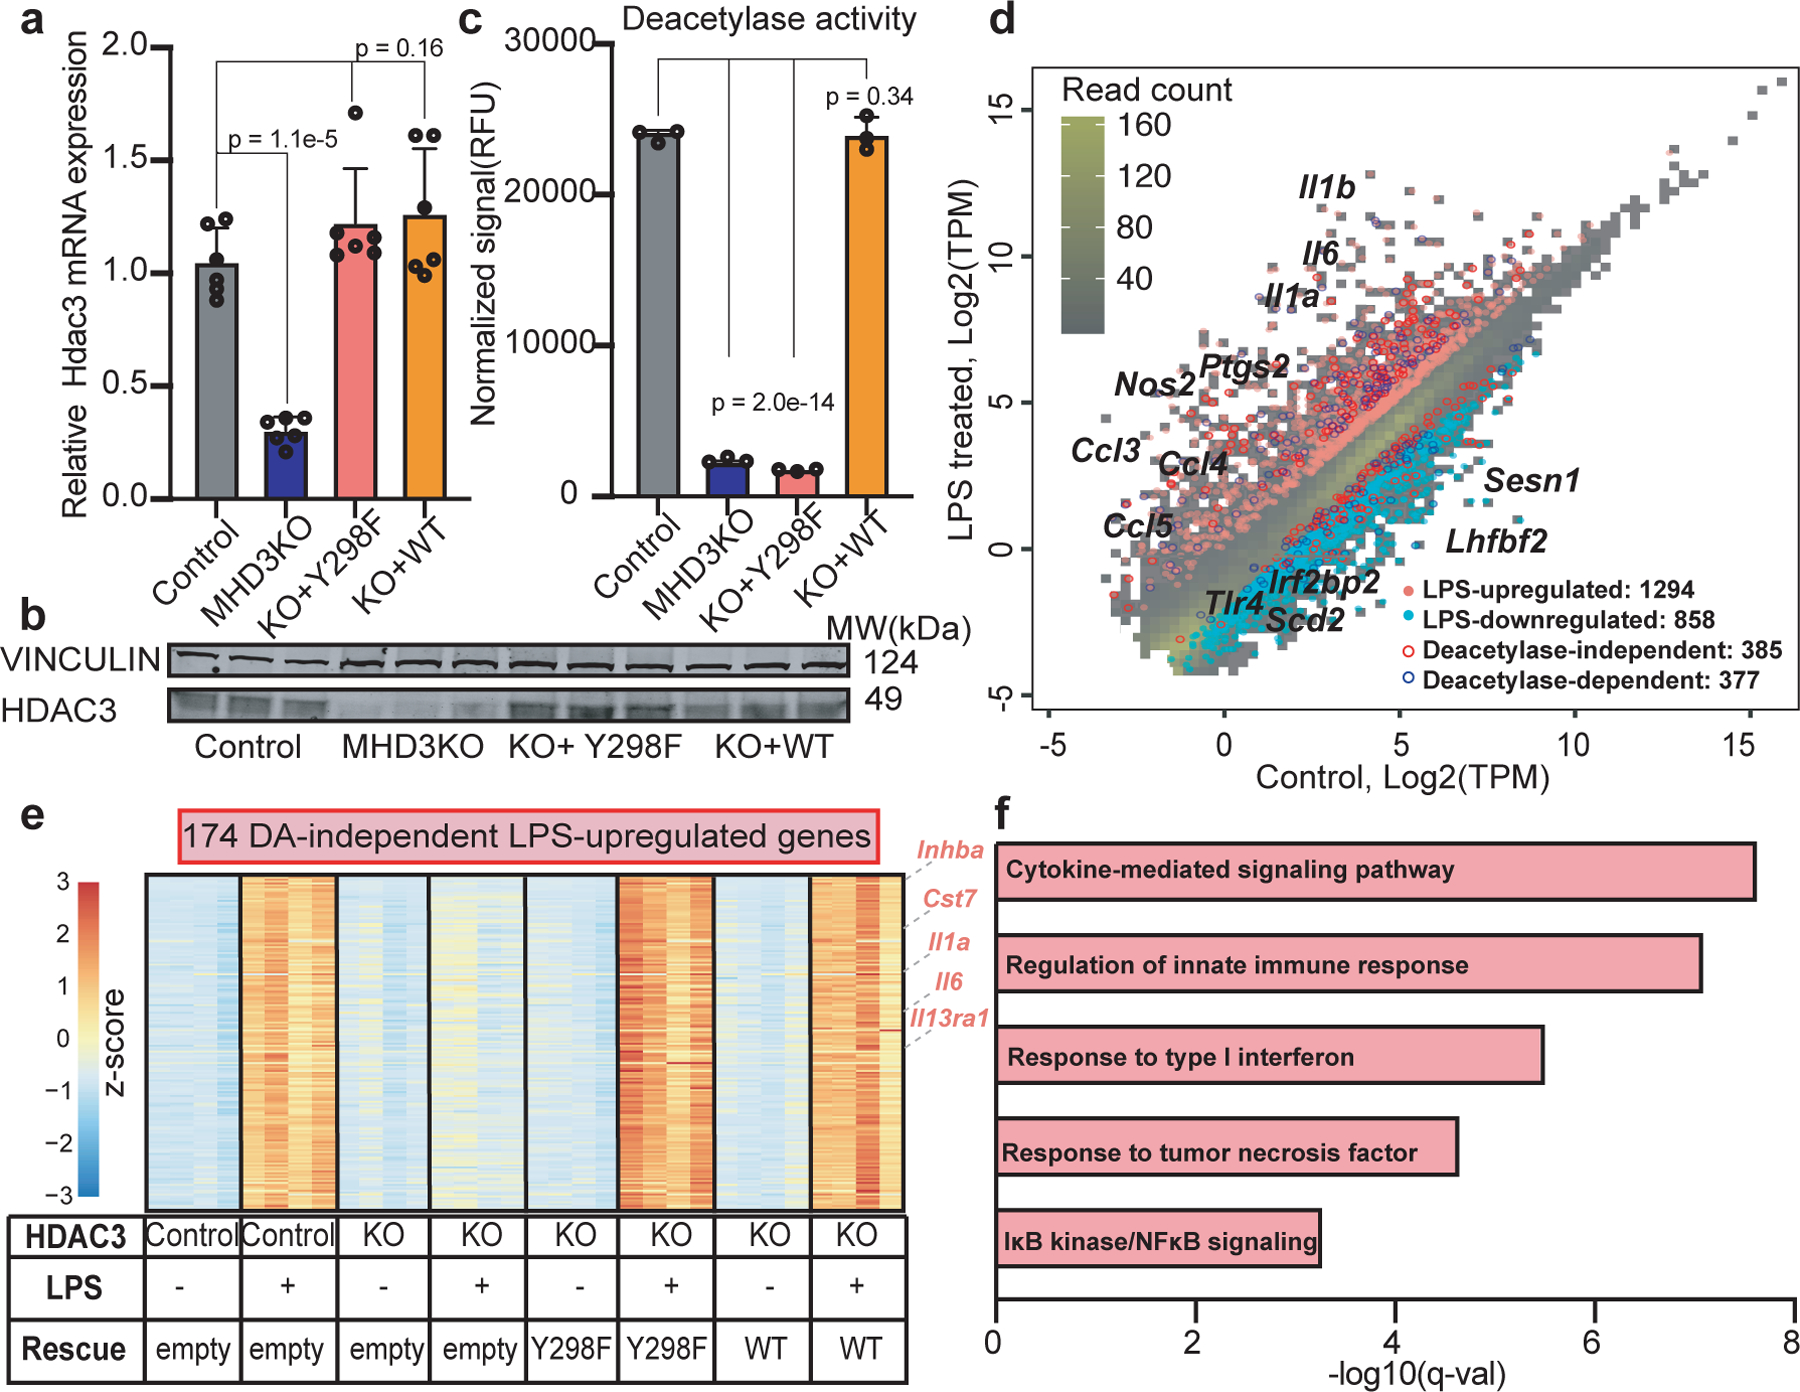
(a) Hdac3 mRNA levels in control, MHD3KO, Y298F rescue, and WT rescue macrophages as quantitated by qRT-PCR. Data shown mean ± sd (n = 6 biological replicates), p values calculated by one-way ANOVA. (b) Western Blot (performed independently twice, n = 3 biological replicates) of HDAC3 protein levels in control, MHD3KO, Y298F rescue, and WT rescue macrophages, with Vinculin as loading control. (c) Deacetylase activity of HDAC3 immunoprecipitated from control, MHD3KO, Y298F rescue, and WT rescue macrophages as measured by fluorescent signal from enzymatically cleaved substrate. Data shown mean ± sd (n = 3 biological replicates). p values calculated by one-way ANOVA. (d) Scatterplot of RNA-seq data showing transcripts-per-kilobase-million (TPM)-transformed average read counts from vehicle or LPS-treated control macrophages (n = 4 biological replicates, TPM > 0.1) and HDAC3-regulated LPS-responsive genes (up: pink, down: light blue; differential expression (DE) cutoff: |log2FC| > 1, two-sided BH-adjusted FDR < 0.05, as determined by edgeR likelihood ratio test). Deacetylase-independent (red enclosed circle) are genes whose LPS-stimulated changes were rescued by Y298F and wild-type HDAC3. Deacetylase-dependent (blue enclosed circle) are genes whose LPS-stimulated changes were rescued by wild-type HDAC3 but not by Y298F. (e) Heatmap showing 174 LPS-upregulated, HDAC3-dependent differentially expressed genes that were rescued by Y298F and wild-type HDAC3 (DA-independent genes: n = 4 biological replicates, DE cutoff: |log2FC| > 1, two-sided BH-adjusted FDR < 0.05 as determined by edgeR likelihood ratio test). (f) Gene ontology analysis of 174 LPS-upregulated DA-independent genes (n = 4 biological replicates). q-values represent BH-adjusted one-sided hypergeometric p-values for over-representation as determined by Enrichr.
We next investigated the role of HDAC3 catalytic activity in the transcriptional response to acute LPS challenge in vitro. As expected, LPS induced massive changes, with up-regulation of classic inflammatory markers such as Il6, Il1a, Il1b, and Nos2, and approximately one-third of LPS-stimulated differentially expressed genes (762/2152) were lost in the MHD3KO macrophages (Fig. 1d and Extended Data Figs. 1a–c). It should be noted that the transcriptome of MHD3KO macrophages is shifted towards an alternatively activated phenotype5, which could affect the LPS response. Nevertheless, more than half of the HDAC3-dependent, LPS-responsive genes (385/762) were rescued by the Y298F mutant (referred to hereafter as DA-independent genes) and were highly overlapped with control and WT-rescue macrophages (Extended Data Fig. 1d).
We particularly focused on the 174 genes that were upregulated by LPS in an HDAC3-dependent, but enzyme-independent manner (Fig. 1e). These exhibited a pro-inflammatory profile, including cytokine production and activation of NF-κB signaling (Fig. 1f). By contrast, the 142 HDAC3-dependent LPS-downregulated genes that failed to be rescued by the Y298F mutant (Extended Data Figs. 1e–f, referred to hereafter as DA-dependent genes), were functionally most notable for down-regulation of TLR signaling, including Tlr4 gene transcription (Extended Data Fig. 1g), suggesting a potential negative feedback mechanism in endotoxin response15. Overall, the Y298F mutant phenocopied the wild-type HDAC3 inflammatory transcriptional response to LPS stimulation, while the transcriptional response to the anti-inflammatory cytokine IL4 was enzyme-dependent (Extended Data Fig. 1h), indicating that the enzyme-independent activity of HDAC3 was highly specific to the LPS response.
To understand the mechanisms underlying the DA-independent and DA-dependent transcriptomes, we performed chromatin-immunoprecipitation followed by high-throughput sequencing (ChIP-seq) for HDAC3 (Extended Data Figs. 2a and 2b). LPS stimulation significantly increased HDAC3 genomic occupancy within 100 kilobases (kb) of transcription start sites of previously identified DA-independent genes (Fig. 2a), whereas HDAC3 binding was unchanged near DA-dependent genes (Fig. 2b).
Figure 2 |. Differential recruitment and transcriptional functions of HDAC3 at Deacetylase (DA)-independent and –dependent LPS-responsive genes.
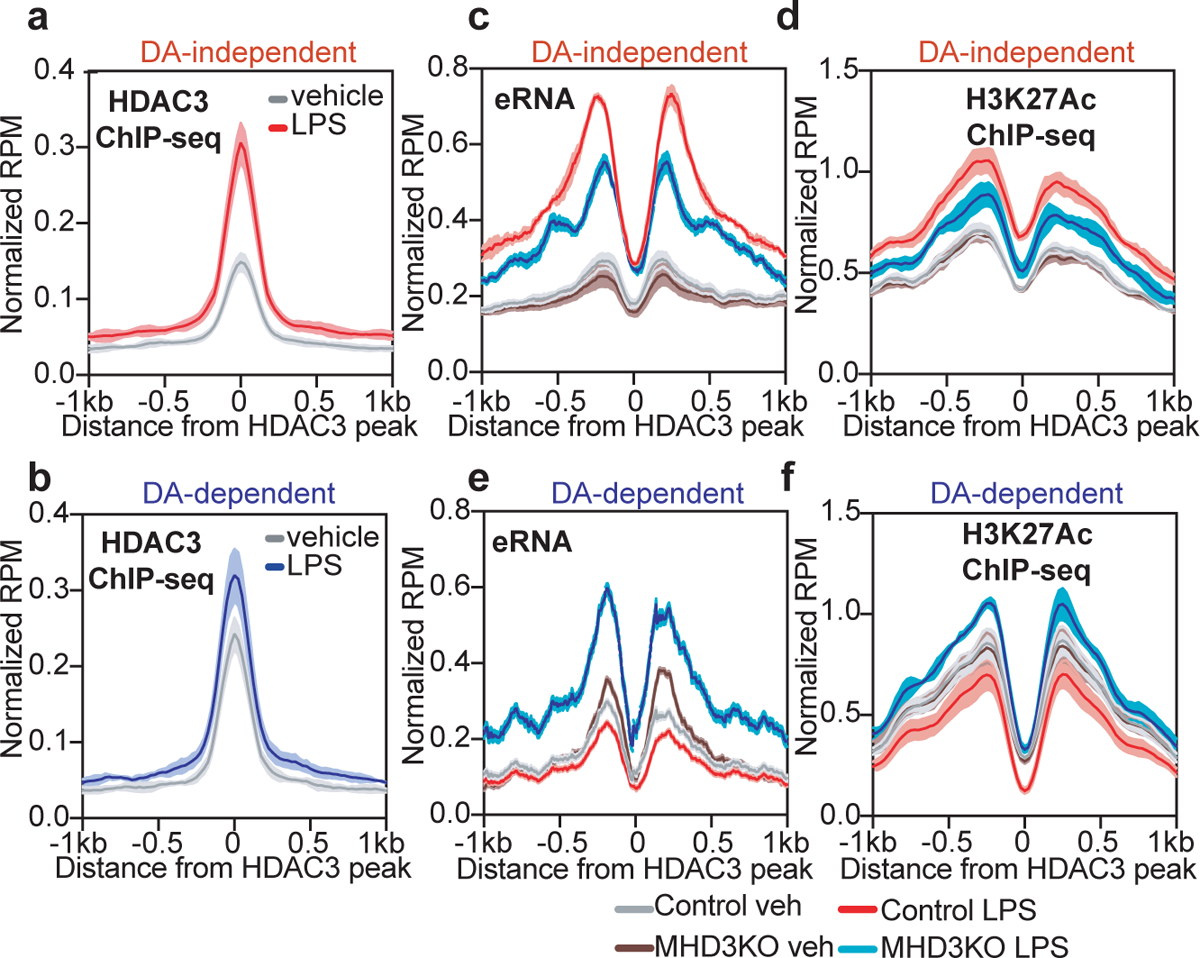
(a,b) Average density profiles in reads-per-million (RPM) of HDAC3 ChIP-seq showing mean ± se (n = 3 biological replicates) at enhancers near (a) DA-independent genes (two-sided Wilcoxon’s p = 2.6e-15) or (b) DA-dependent genes (two-sided Wilcoxon’s p = 0.084) in vehicle or LPS treated BMDM. (c,d) Average density profiles in RPM showing mean ± se (n = 3 biological replicates) of (c) bidirectional eRNA transcription measured by GRO-seq (Control LPS vs. MHD3KO LPS two-sided Wilcoxon’s p = 7.7e-25) or (d) H3K27Ac levels measured by ChIP-seq (Control LPS vs. MHD3KO LPS two-sided Wilcoxon’s p = 4.2e-7) at HDAC3-bound sites near DA-independent genes in control and MHD3KO BMDM, with or without LPS. (e,f) Average density profiles in RPM showing mean ± se (n = 3 biological replicates) of (e) bidirectional eRNA transcription measured by GRO-seq (Control LPS vs. MHD3KO LPS two-sided Wilcoxon’s p = 3.2e-126) or (f) H3K27Ac levels measured by ChIP-seq (Control LPS vs. MHD3KO LPS two-sided Wilcoxon’s p = 6.4e-12) at HDAC3-bound sites near DA-dependent genes in control and MHD3KO BMDM, with or without LPS. DA-independent sites = 172, DA-dependent sites = 141.
We next assessed the functionality of HDAC3 binding sites using two independent measures of enhancer activity, namely Global Run-On sequencing (GRO-seq) and acetylated histone H3 lysine 27 (H3K27Ac) ChIP-seq. Globally, neither loss of HDAC3 nor LPS stimulation perturbed enhancer RNA (eRNA) production (Extended Data Fig. 2c) or H3K27Ac levels (Extended Data Figs. 2d and 2e). However, at HDAC3 binding sites near DA-independent genes, LPS stimulated a marked increase in eRNA production (Fig. 2c and Extended Data Fig. 2f) as well as H3K27Ac levels (Fig. 2d), which were attenuated in the MHD3KO. Conversely, enhancer activity (Fig. 2e and Extended Data Fig. 2g) and H3K27Ac abundance (Fig. 2f) proximal to DA-dependent genes were reduced by LPS stimulation and considerably induced upon loss of HDAC3, consistent with HDAC3 function as a repressor via histone deacetylation at these sites. Although functional enhancers may not always regulate the nearest genes16, the transcriptional congruity between HDAC3-regulated enhancers and HDAC3-regulated genes supports a direct enhancer-promoter regulatory relationship.
Since HDAC3 does not have intrinsic DNA binding capability, we considered whether the selective engagement of its catalytic activity was determined by transcription factors that facilitate genomic recruitment. De novo motif exploration of HDAC3-bound LPS-stimulated enhancers expectedly revealed the canonical motifs bound by the macrophage lineage determinant PU.1 and by NF-κB-p65 (Extended Data Fig. 2h). Application of a machine learning-based transcription factor binding analysis (TBA)17 to DA-independent and DA-dependent HDAC3-bound genomic regions revealed that DNA-sequence features intrinsic to these distinct genomic regions could predict different outcomes (Extended Data Fig. 3a). Specifically, TBA identified ATF2 as the most statistically significant positive cobinding-partner at DA-independent sites, while ATF3 was predicted to be the transcription factor most likely responsible for the outcome of DA-dependent genes (Fig. 3a). Interestingly, ATF2 was predicted to be negatively correlated with HDAC3 binding at DA-dependent sites while ATF3 might negatively influence the binding of HDAC3 at DA-independent sites (Fig. 3a), whereas other AP-1 family members did not display robust differential binding affinity like ATF2 and ATF3 (Fig. 3b and Extended Data Figs. 3b–c). Moreover, HDAC3-bound eRNAs were more abundantly transcribed when the region contained the ATF2 motif than ATF3 (Extended Data Fig. 3d).
Figure 3 |. Engagement of HDAC3 enzyme activity is determined by its differential recruitment by ATF2 and ATF3.
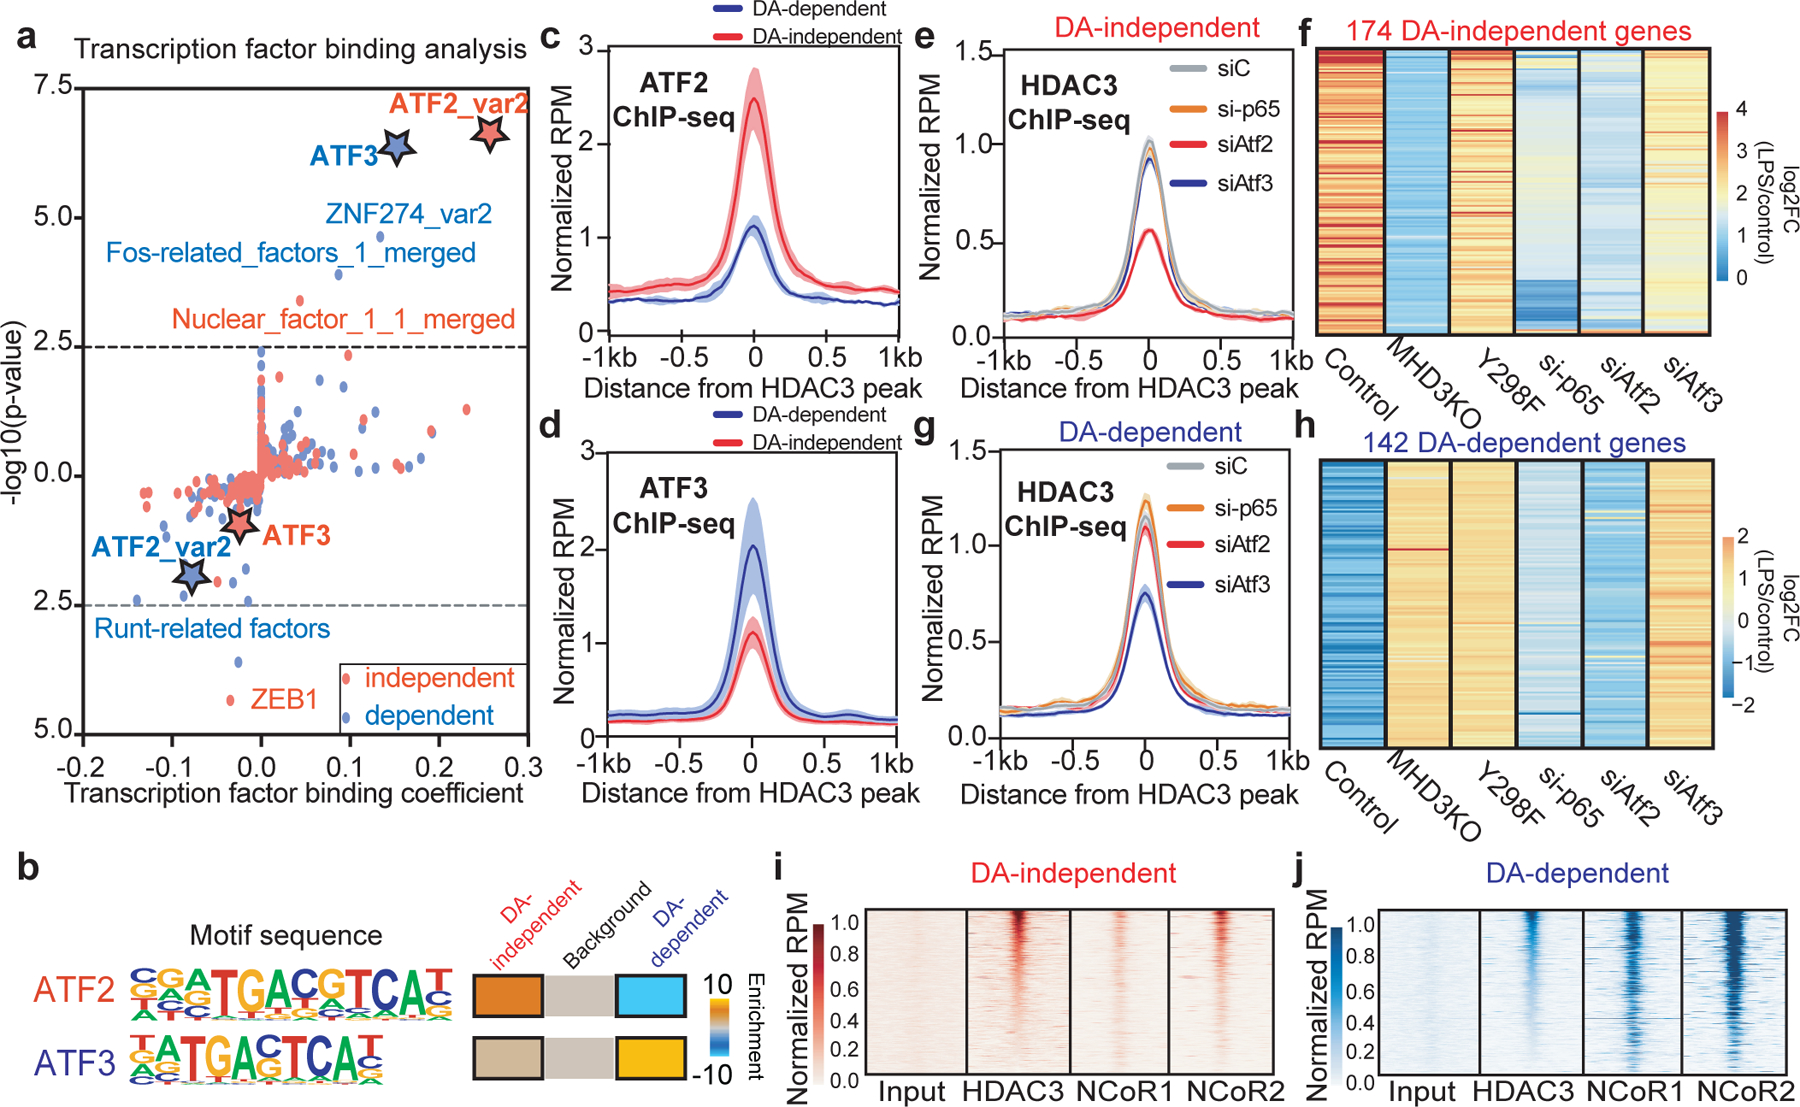
(a) Machine learning-based transcription factor binding analyses (TBA) applied to HDAC3-bound 200bp genomic regions (n = 3 biological replicates) near DA-independent and DA-dependent genes. DNA motifs are ranked based on binding coefficient (negative or positive correlation with HDAC3 binding) and significance of the motifs based on likelihood ratio test. (b) Differential enrichment of TGACGTCA (ATF2 motif 44/172 independent, 0/141 dependent) or TGACTCA (ATF3 motif 24/172 independent, 97/141 dependent) motif at HDAC3-bound sites near DA-independent and DA-dependent genes. (c,d) Average density profiles in RPM of (c) ATF2 (two-sided Wilcoxon’s p = 3.6e-19) and (d) ATF3 (two-sided Wilcoxon’s p = 1.9e-10) ChIP-seqs showing mean ± se (n = 3 biological replicates) at HDAC3-bound sites near either DA-independent or DA-dependent genes in LPS-treated control BMDM. (e,g) Average density profiles in RPM of HDAC3 ChIP-seq showing mean ± se (n = 2 biological replicates) for control (siC), ATF2-depleted (siAtf2), ATF3-depleted (siAtf3), or p65(Rela)-depleted (si-p65) LPS-treated BMDM at HDAC3-bound sites near (e) DA-independent or (g) DA-dependent genes. (f,h) Heatmap showing LPS-induced transcriptional changes as a function of Log2Foldchange (log2FC) comparing LPS-treated and vehicle control (n = 3 biological replicates) of (f) DA-independent or (h) DA-dependent genes in control, MHD3KO, Y298F, ATF2-depleted (siAtf2), ATF3-depleted (siAtf3), or p65-depleted (si-p65) BMDM. (i,j) Heatmaps of input, HDAC3, NCoR1, and NCoR2 ChIP-seq showing average signal (n = 3 biological replicates) in RPM at HDAC3-bound sites near (i) DA-independent or (j) DA-dependent genes. DA-independent sites = 172, DA-dependent sites = 141.
To test whether these predicted motifs were sufficient to differentially determine the engagement of HDAC3 catalytic activity for transcription, we transfected macrophages with reporter genes consisting of enhancer elements upstream of either Clec2d, a DA-independent gene containing the ATF2 motif (Extended Data Fig. 3e), or Gas6, a DA-dependent gene containing the ATF3 motif (Extended Data Fig. 3f). LPS markedly stimulated the transcriptional activity of the ATF2 reporter in an HDAC3-dependent manner, which was rescued by the Y298F, only in the presence of endogenous ATF2, and independent of ATF3 (Extended Data Fig. 3g). Moreover, mutating the ATF2 motif to ATF3 motif abrogated the LPS-stimulated induction of luciferase transcription (Extended Data Fig. 3g). By contrast, the ATF3 reporter had strong basal activity that was repressed by LPS in an HDAC3-dependent manner that was only rescued by catalytically active WT HDAC3, and unaffected by depletion of ATF2 (Extended Data Fig. 3h). However, loss of either ATF3 or the ATF3 binding motif de-repressed luciferase transcription, phenocopying loss of HDAC3 (Extended Data Fig. 3h).
These results predicted that ATF2 would be more abundant at DA-independent HDAC3-regulated sites while ATF3 would be preferentially associated with enzyme-active HDAC3, and this was borne out by comparison of their respective cistromes (Extended Data Fig. 4a). ATF2 was more abundant at DA-independent HDAC3-regulated sites in LPS-treated macrophages (Fig. 3c), while ATF3 was more enriched at HDAC3-bound sites near DA-dependent genes (Fig. 3d). Depletion of ATF2 or ATF3 with multiple independent siRNAs (Extended Data Figs. 4b–c) did not induce significant transcriptional changes at baseline (Extended Data Fig. 4d). However, loss of ATF2, but not ATF3, reduced HDAC3 recruitment (Fig. 3e and Extended Data Fig. 4e) and specifically abolished HDAC3 DA-independent transcriptional activation of LPS-induced genes (Fig. 3f). In contrast, loss of ATF3, but not ATF2, specifically diminished HDAC3 recruitment to DA-dependent enhancers (Fig. 3g and Extended Data Fig. 4f), resulting in de-repression of LPS-downregulated genes (Fig. 3h). These results suggest that differences in the enrichment of ATF2 and ATF3 genomic occupancy determine the dichotomous functions of HDAC3 transcriptional regulation in the response to LPS.
To gain insight into the mechanism of ATF2-mediated transcriptional activation by HDAC3, we performed cistromic profiling for p65, which has been previously implicated in HDAC3-dependent LPS signaling18–20 and whose motif was enriched at HDAC3-bound enhancers. LPS induced genomic binding of p65 at DA-independent sites (Extended Data Fig. 4g) more robustly than at DA-dependent sites (Extended Data Fig. 4h). p65 binding was enhanced by the loss of HDAC3 only at DA-dependent sites (Extended Data Fig. 4h), consistent with literature showing that p65 is a direct substrate of HDAC320–22 and that deacetylation triggers the nuclear export of p6521,22. p65 depletion did not alter HDAC3 genomic binding (Figs. 3e and 3g), but attenuated the LPS-induction of DA-independent genes (Fig. 3f) without affecting DA-dependent genes (Fig. 3h), suggesting a specific role for p65 recruitment in DA-independent activation of pro-inflammatory genes.
As the catalytic activity of HDAC3 uniquely requires activation by co-repressor complexes, we next tested whether the selective requirement of HDAC3 deacetylase functions could be explained by differential recruitment of NCoR1/2. Strikingly, genomic colocalization of NCoR1/2 with HDAC3 was diminished at DA-independent enhancers of genes activated by HDAC3 (Fig. 3i and Extended Data Fig. 4i) relative to their robust recruitment to DA-dependent targets that were repressed by HDAC3 (Fig. 3j and Extended Data Fig. 4j). Quantitatively, NCoR1/2 were enriched at sites of ATF3 binding relative to ATF2 (Extended Data Figs. 4k–n), providing a plausible mechanism for the reported immunosuppressive functions of ATF323–26, including ATF3-dependent repression of Tlr425,27. Conversely, the depletion of NCoR1/2 at ATF2/HDAC3 binding sites contributes to the physiological basis for DA-independent gene activation.
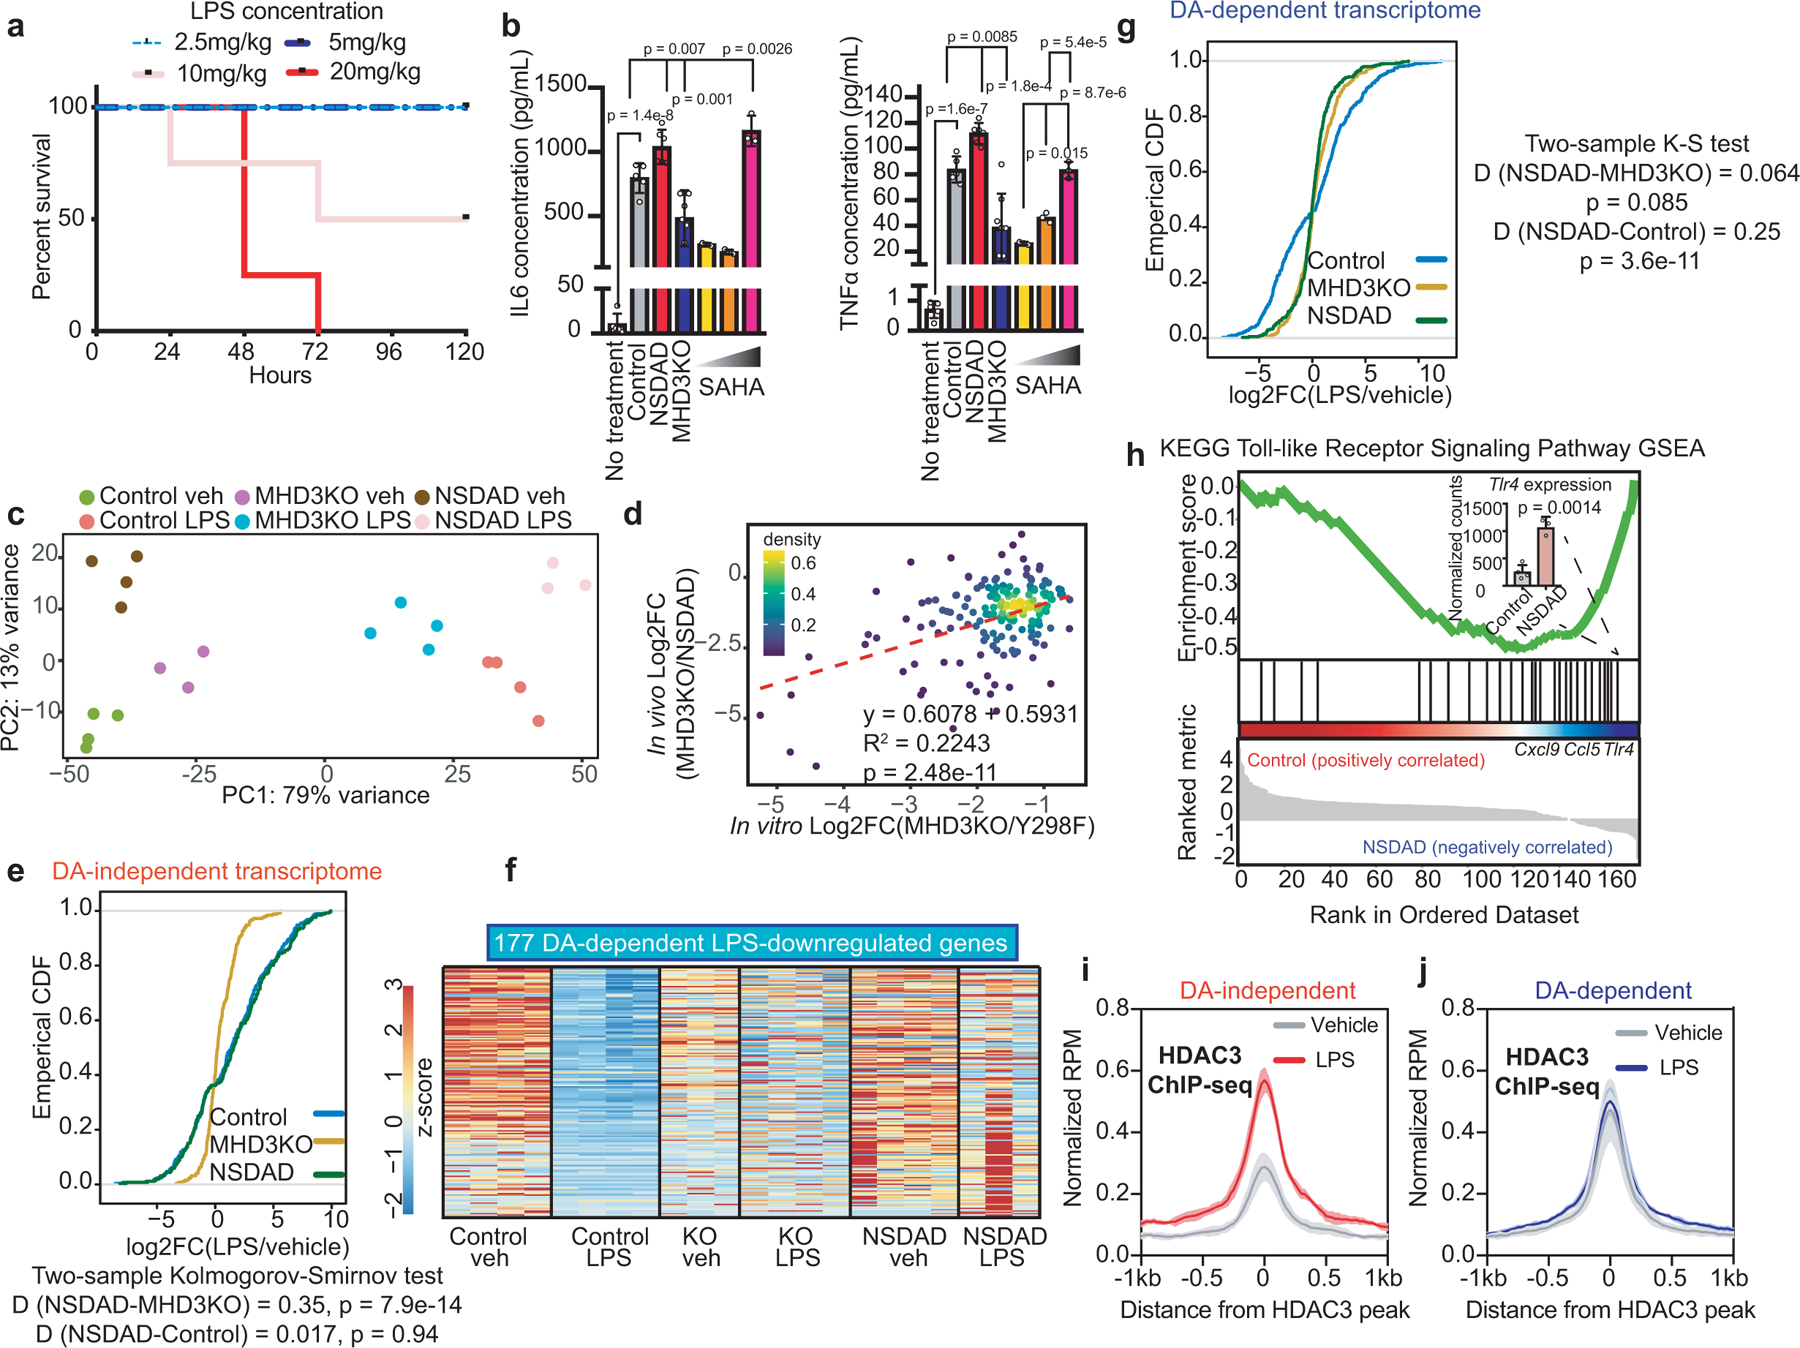
We next tested the importance of HDAC3 DA-independent functions in regulating acute systemic inflammation. Although a knock-in Y298F mouse was not available, we utilized mice harboring reduced HDAC3 catalytic activity due to mutations in the deacetylase-activating domain (DAD) of NCoR1 and NCoR2 that abolish their activation of HDAC3 (NSDAD mice3). At a dose of LPS that we empirically determined to be lethal to ~50% of WT C57Bl6 mice within 24–120 hours (Extended Data Fig. 5a), NSDAD mice succumbed within 28 hours of LPS injection (Fig. 4a), similar to previous findings in NCoR1-DAD mutant mice28. Correspondingly, circulating levels of pro-inflammatory cytokines IL6 and TNFα were markedly elevated in NSDAD mice 6 hours after LPS exposure (Extended Data Fig. 5b). By contrast, MHD3KO were largely protected from acute endotoxin lethality (Fig. 4a), with reduced circulation of pro-inflammatory cytokines compared to control mice (Extended Data Fig. 5b). Thus, endogenous HDAC3 contributed to LPS susceptibility and this was magnified in the absence of its catalytic activity, indicating that the DA-independent and DA-dependent functions of HDAC3 play opposing roles in LPS toxicity.
Figure 4 |. Dichotomous functions of HDAC3 orchestrate the inflammatory response to endotoxin in vivo.
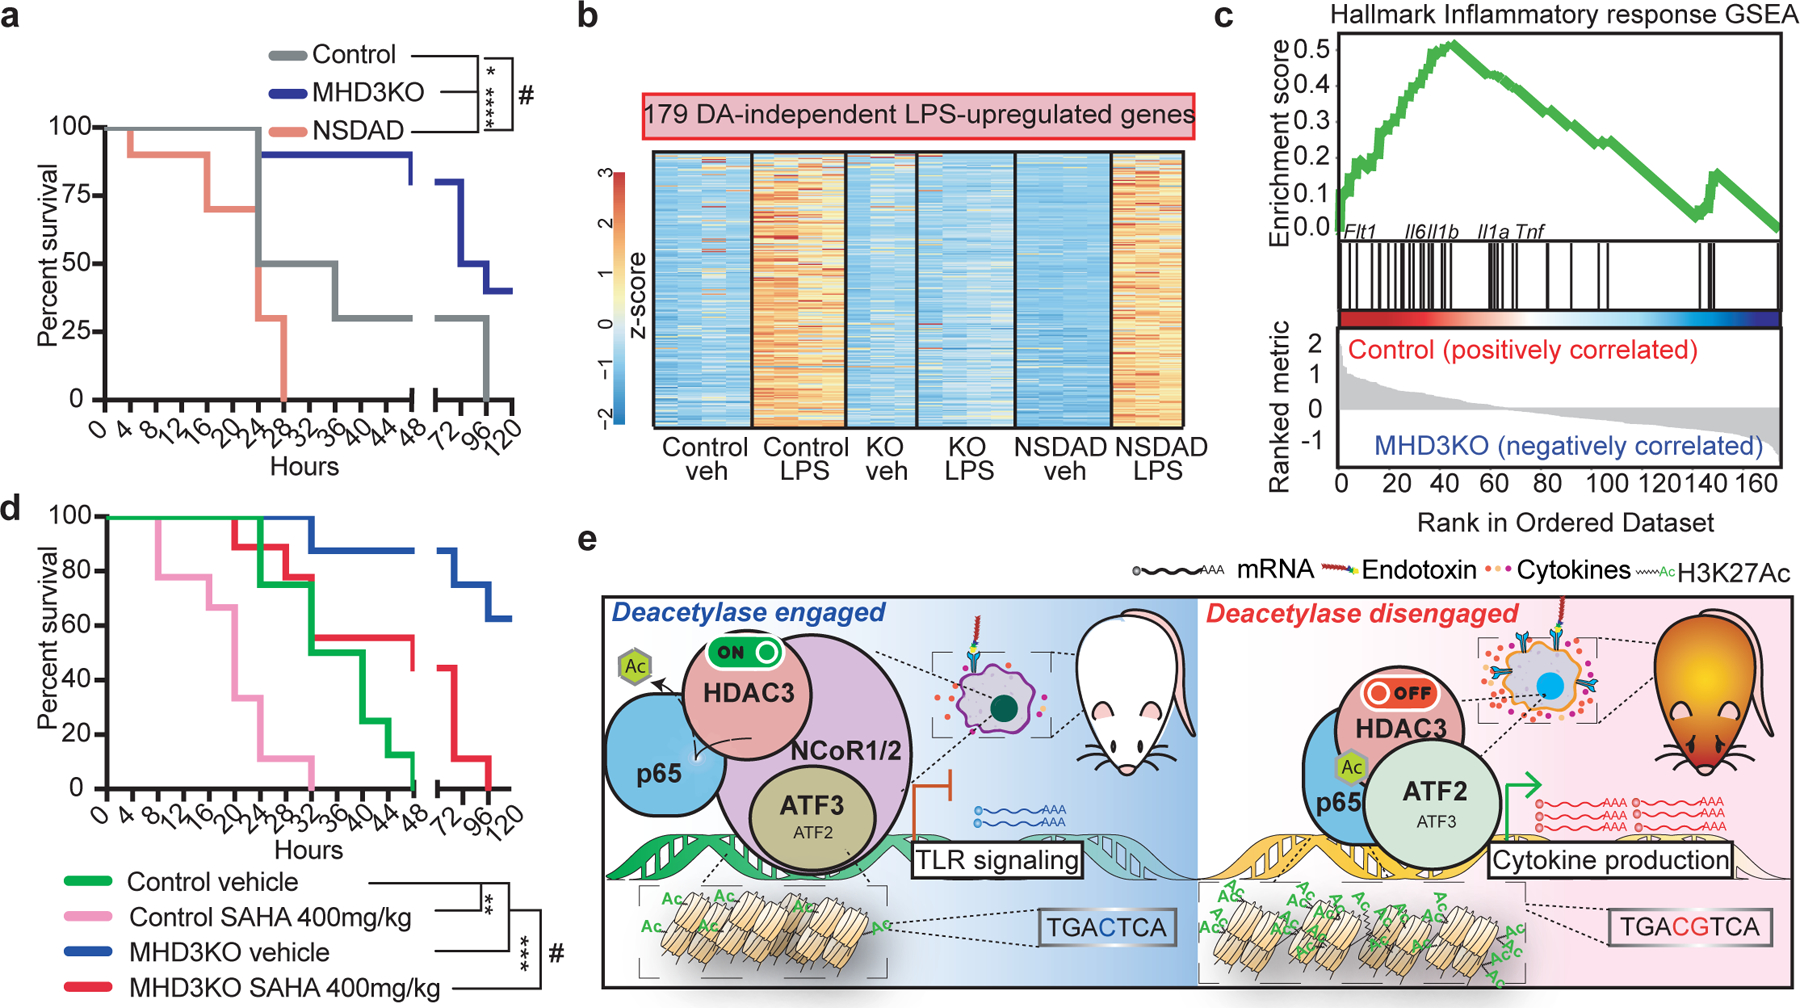
(a) Kaplan-Meier curves of control, MHD3KO, and NSDAD mice (n = 10 independent mice) subjected to 10 mg/kg of intraperitoneal injection of purified LPS. (#) p =0.014, (*) p = 0.024, (****) p = 7.1e-5, calculated by two-sided Mantel-Cox’s test. (b) Heatmap showing 179 LPS-upregulated, HDAC3-dependent differentially expressed genes in vivo that were rescued by NSDAD (DA-independent genes: n = 4 biological replicates, except for KO veh and NSDAD LPS with n = 3 biological replicates, DE cutoff: |log2FC| > 1 , two-sided BH-adjusted FDR < 0.05 as determined by edgeR likelihood ratio test). (c) Gene set enrichment analysis (GSEA) for the in vivo DA-independent transcriptome (179 genes) showing enrichment of hallmark inflammatory response genes that were more upregulated in peritoneal macrophages from LPS-treated control than LPS-treated MHD3KO mice (n = 4 biological replicates). (d) Kaplan-Meier curves of control and MHD3KO mice subjected to 10mg/kg of intraperitoneal injection of purified LPS, with co-administration of either vehicle control (10% DMSO in PBS, n = 8 independent mice) or 400mg/kg of SAHA (n = 9 independent mice. (#) p =0.0013 (**) p = 0.0014, (***) p = 0.00052, calculated by two-sided Mantel-Cox’s test. (e) Dichotomous functions of HDAC3 orchestrate the inflammatory response to endotoxin.
To better understand the differential LPS sensitivities between MHD3KO and NSDAD mice, we evaluated the transcriptomes and HDAC3 cistromes of their peritoneal macrophages 6 hours after endotoxin exposure in vivo. Gene expression analysis (Extended Data Fig. 5c) demonstrated that the in vivo DA-independent transcriptome was highly correlated with its in vitro counterpart (Extended Data Fig. 5d). Loss of HDAC3 protein abrogated the activation of LPS-stimulated DA-independent genes observed in both control and NSDAD mice (Fig. 4b and Extended Data Fig. 5e), and these bore the signature of the pro-inflammatory response (Fig. 4c). By contrast, HDAC3 catalytic activity was required at in vivo DA-dependent genes (Extended Data Figs. 5f–g), where it exerted negative feedback on TLR4 signaling (Extended Data Fig. 5h). Moreover, as previously observed in vitro, LPS stimulated genomic recruitment of HDAC3 in vivo to sites near DA-independent genes (Extended Data Fig. 5i) but not DA-dependent genes (Extended Data Fig. 5j). Taken together, these results suggest that inhibition of HDAC3 catalytic activity might be detrimental due to persistent HDAC3-dependent activation of inflammatory gene expression that must be blunted to enhance survival29–31.
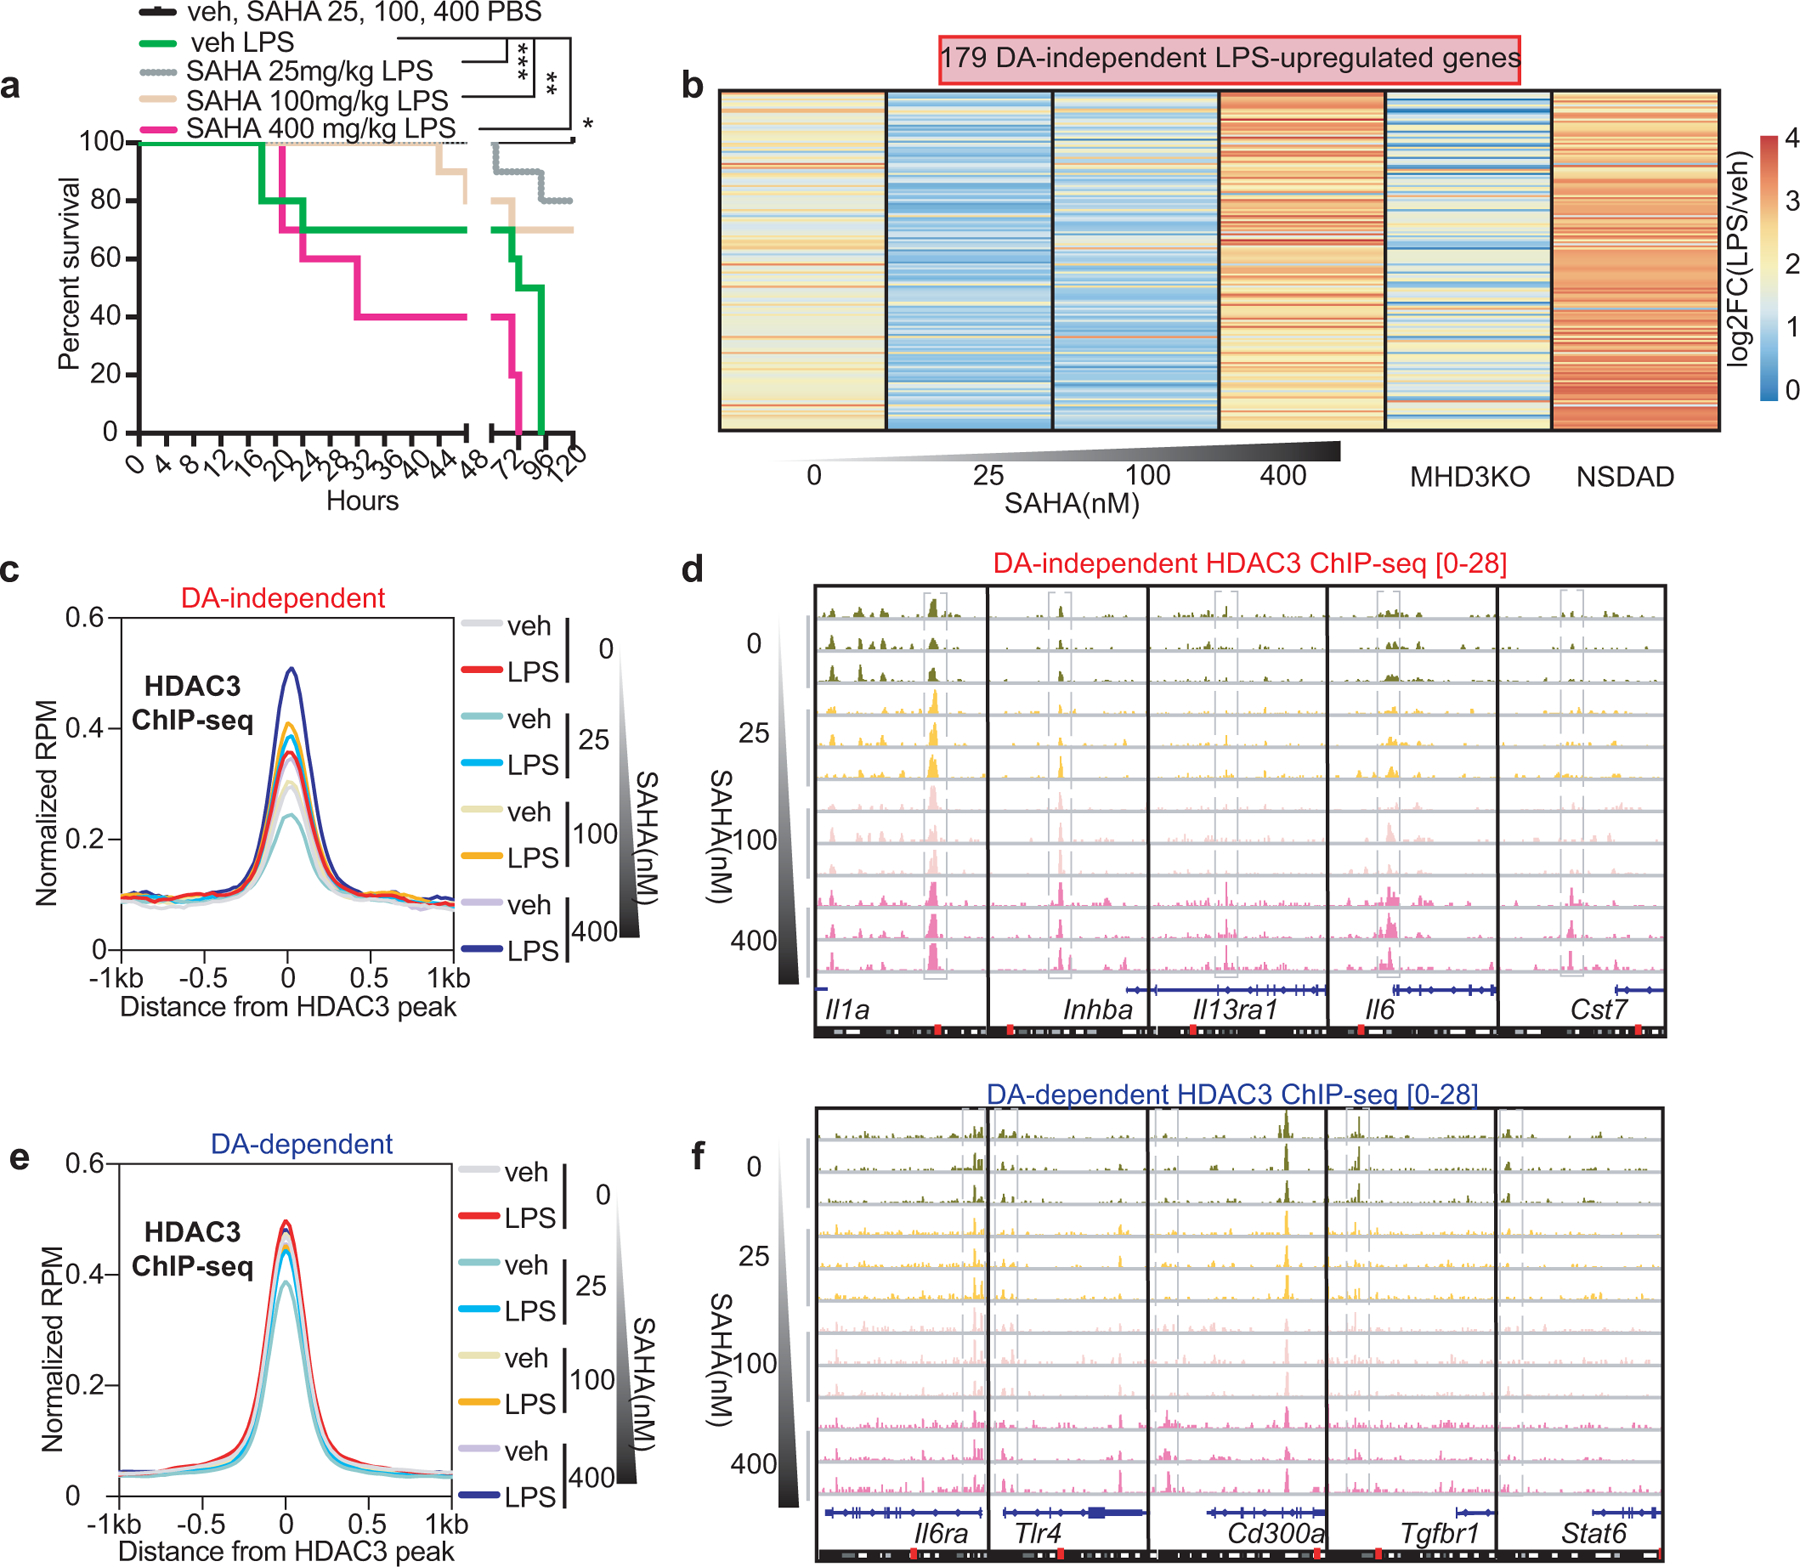
Since HDAC inhibitors are used in the clinic for several therapeutic indications, we compared the effects of pharmacological and genetic inhibition of HDAC3 catalytic activity on LPS toxicity. Consistent with previous reports of its anti-inflammatory benefits13,32–34, low doses of SAHA (25–100mg/kg) conferred a protective effect against severe septic shock (Extended Data Fig. 6a). This is opposite to the phenotype of the NSDAD mice in which HDAC3 protein is present without its deacetylase activity and may reflect the fact that SAHA is a more potent inhibitor of other class I HDACs than HDAC335. By contrast, daily administration of a higher, yet non-toxic dose of SAHA (400 mg/kg) sensitized animals to LPS, similar to the phenotype of the NSDAD mice (Fig. 4d). MHD3KO mice subjected to the same treatment were protected (Fig. 4d), suggesting that genetic or pharmacological inhibition of HDAC3 enzymatic activity might sensitize animals to endotoxic shock through HDAC3-mediated hyperactivation of DA-independent pro-inflammatory mediators. Indeed, the transcriptome of LPS-treated macrophages treated with high dose SAHA was similar to that of macrophages from LPS-exposed NSDAD mice (Extended Data Fig. 6b). Moreover, this dose-dependent transcriptional activation was accompanied by LPS-stimulated HDAC3 recruitment to DA-independent genes (Extended Data Figs. 6c–d) that did not occur at DA-dependent genes (Extended Data Figs. 6e–f).
Though classically associated with transcriptional repression, a growing body of evidence suggests HDAC3 may also function as a coactivator4,6–8,36. Here we have demonstrated selective enzymatic engagement of HDAC3 as a function of its differential association with co-repressor complexes NCoR1/2, selectively coordinated by either ATF3 or ATF2 (Fig. 4e). Our results implicate HDAC3 as a critical integrator of pathogenic stimuli to orchestrate well-balanced inflammatory responses. Efforts to attenuate class I HDAC enzymatic activity for immunomodulation should carefully consider the paradoxical intensification of enzyme-independent, pro-inflammatory activities of HDAC3.
METHODS
Statistics and Reproducibility.
All data were presented with individual biological replicates shown when appropriate. RStudio (v1.0.153) with R-packages: edgeR(v3.26.8), ggplot2 (v3.3.0), latticeExtra(v0.6–29), pheatmap (v1.0.12) softwares and Graphpad Prism (v8.0) were used for graphing and statistical analysis. Genome-browser tracks were visualized with IGV 2.3.9237. All statistical tests are fully described in the figure legends. In general, p values were calculated using two-tailed Student’s t-test for pairwise comparisons and one-way ANOVA for multiple comparisons. All statistical tests were adjusted with Holm-Sidak method for multiple testing, with a 95% confidence interval. Hypergeometric testing was either reported by HOMER(v4.11)51, Enrichr(v2.1)42,43, or was performed with R-function phyper(). Statistics reported by Enrichr (q-values) were adjusted by Benjamini-Hochberg (BH) method. Correlations with associated p values from two-sided t-tests were calculated by R function cor().
Experiments independently performed twice with similar results:
Figs. 1a–b (HDAC3 gene and protein expression) and Extended Data Figs. 2e (H3K27Ac WB), 6a (in vivo endotoxin susceptibility in SAHA treated animals).
Experiments performed once:
Fig. 1c (HDAC3 catalytic activity), Figs. 1d–f and Extended Data Figs 1a–h (RNA-seq), Figs. 2a–b, 3a–b and Extended Data Figs. 2a–b,h, 3a–b (HDAC3 ChIP-seq), Figs. 2c,e and Extended Data Figs. 2c,f,g,3d (GRO-seq), Figs. 2d,f and Extended Data Figs. 2a,d (H3K27Ac ChIP-seq), Figs. 3c–d and Extended Data Figs. 4a,m-n (ATF2 and ATF3 ChIP-seqs), Figs. 3e–h and Extended Data Figs. 4d–f (HDAC3 ChIP-seq and RNA-seq in siATF2/ATF3/p65 macrophages), Figs. 3i–j and Extended Data Figs. 4i–l (NCoR1/2 ChIP-seq), Extended Data Figs. 3e–h (luciferase assays), Extended Data Figs. 4b–c (ATF2/ATF3/p65 expression), Extended Data Figs. 4g–h (p65 ChIP-seq), Fig. 4a (in vivo endotoxin susceptibility in genetic mouse models), Figs. 4b–c and Extended Data Figs. 5c–j (in vivo RNA-seq and HDAC3 ChIP-seq), Fig. 4d (SAHA endotoxin susceptibility in genetic model), Extended Data Figs. 5a–b (Endotoxin susceptibility and cytokine measurement), Extended Data Figs. 6b–f (HDAC3 ChIP-seq and RNA-seq in SAHA treated macrophages).
Animal studies.
MHD3KO mice were generated as previously described5. NSDAD mice were generated as previously described3. Mice were housed in a temperature-controlled specific-pathogen-free facility under 12-hour light/dark cycles. Adult male mice of 8 weeks old were used in all experiments. Age-matched WT C57Bl6 mice were purchased from Jackson lab. No calculation was performed to pre-determine the sample size. Animal care and use procedures followed the guidelines of the Institutional Animal Care and Use Committee of the University of Pennsylvania in accordance with the guidelines of the National Institutes of Health. All experimental procedures were performed according to institutional pain class C protocol.
In vivo endotoxic shock study.
All procedures were performed according to institutional pain class C protocol. Mice were intraperitoneally injected with 10mg/kg of purified LPS (Sigma E. Coli O111:B4) and closely observed continuously every 4 hours for the first 48 hours post endotoxin exposure, for a total of 120 hours. SAHA administration (Peprotech; 25–400mg/kg every 24 hours, or 10% DMSO in PBS vehicle control) was started 1 day before LPS injection and continued daily until experimental end point. Mice of different genetic backgrounds or treatments were randomized, and identities were blinded from the experimenter until final census. All surviving animals were humanely euthanized after 120 hours post injection. Experiments were performed independently twice.
ELISA.
Circulating cytokine levels from mouse serum harvested 6 hours after administration of endotoxin were measured with Mouse Quantikine ELISA kits (TNFα, MTA00B; IL6, M6000B) according to the manufacturer’s instructions. Chemiluminescence was measured at wavelength 450nm by Synergy HT plate reader (Biotek) and cytokine concentrations were quantitated using a four-parameter fit curve.
In vivo transcription profiling.
WT C57Bl6, MHD3KO, NSDAD mice and their control littermates of 8-week-old were intraperitoneally injected with either phosphate-buffered saline (PBS, Sigma) or 10 mg/kg of purified LPS (Sigma E. Coli O111:B4) at 4PM. Without thioglycolate stimulation, peritoneal macrophages were harvested 6h after LPS or PBS injection at 10PM and passed through pre-separation filters (Miltenyi Biotec, 130-041-407) to obtain a single-cell suspension. Peritoneal macrophages were then isolated by MACS (Magnetic-Activated Cell Sorting) as previously described38, following the manufacturer instructions (Miltenyi Biotec, 130-110-434) and using MiniMACS columns (Miltenyi Biotec, 130-042-201). RNA was isolated from purified cells using TRIzol (Invitrogen) with the RNeasy micro kit (Qiagen).
Cell culture.
Bone marrow-derived macrophages (BMDM) were harvested and cultured as previously described5. Briefly, DMEM supplemented with 30% L929 (Sigma, 8501) conditioned medium, 10% fetal bovine serum (Tissue Culture Biologics), 100 U/mL penicillin, and 100 μg/mL streptomycin (Invitrogen) was used to culture and differentiate cells for 7 days in petri plates, with fresh media replaced on the 4th day and replating on the 6th day post-harvest. Cells were then treated with PBS (vehicle), 10 ng/mL IL-4 (Peprotech) for 24 hours, or 5 ng/mL LPS (Sigma) for 4 hours. For HDAC inhibitor studies, a 4-hour pre-treatment of either vehicle control (10% DMSO) or 25–400nM SAHA (Peprotech) prior to the addition of vehicle or LPS was performed. All cell cultures were maintained at 37°C in 5% CO2 incubators. No cell line authentication or mycoplasma contamination testing was performed.
Retroviral expression of exogenous HDAC3 mutant.
Sequencing-confirmed wild-type HDAC3 (WT-rescue) and Y298F cDNAs were cloned into a MSCV retroviral construct. Retroviruses were produced in HEK-293FT (Invitrogen R70007) cells by co-transfection of MSCV containing either no insert (empty vector), Y298F, or WT-rescue and pCL-Eco vectors with FuGENE 6 (Promega), and supernatants were harvested 72 hours post-transfection. Supernatants from three 15cm2 tissue culture dishes (1.0×10⁷ cells/dish) were passed through a 0.20μm filter (Corning) prior to viral concentration with PEG-it Virus Precipitation Solution (System Biosciences) at 4°C to a final stock volume of 600μL. Concentrated retrovirus was added to 1.0×10⁶ differentiating macrophages on day 4 (of the 7-day period) in DMEM containing 2 μg ml−1 polybrene. Fresh media containing 1 μg ml−1 puromycin was added 48 hours later for selection of successful viral transduction, up to the next 4 days. We empirically determined that using 300ul (titration was done at 50, 100, 200, 300, 400, 500 μl) of the concentrated viral stock allows re-expression of exogeneous HDAC3 and Y298F mutant to a level comparable to endogenous HDAC3. Importantly, to control for viral transduction, control and MHD3KO macrophages were also transduced with retroviruses carrying the empty vector.
DsiRNA-mediated gene silencing.
After the 7-day period differentiation of macrophages as described above, 5.0×10⁶ cells were plated overnight in 10-cm tissue culture dishes. The media was replaced with 10 ml of serum-free, antibiotic-free DMEM for maximum transfection efficiency. For each target gene, 3 different siRNAs (IDT DsiRNA) were used as independent biological replicates. Transfection was done with Lipofectamine RNAiMax and siRNAs, or transfection control per manufacturer’s protocol, with total RNAi concentration held constant at 50nM. 48 hours post-transfection, transfected BMDM were harvested. Knock-down of specific genes was confirmed by qRT-PCR and Western Blot prior to downstream experiments. Gene-specific siRNA sequences can be found in Supplementary Table 1.
Dual Luciferase Assays.
For unbiased selection of enhancer elements for reporter genes, first, consensus sequences for 200-bp DNA-sequences of enhancer elements upstream of DA-independent genes (171) and DA-dependent genes (142) were obtained using Clustal Omega multiple-alignment tool. The 200bp enhancer element 14kb upstream of Clec2d was selected for ATF2 reporter gene assay since it mapped best to the consensus sequence of 171 enhancer elements (multi-mapping score 151/200 bp, allowing gaps) for DA-independent genes. Similarly, the 200bp enhancer element 16kb upstream of Gas6 was computationally selected for ATF3 reporter gene assay (multi-mapping score 177/200bp, allowing gaps) since it mapped best to the consensus sequence of 142 enhancer elements for DA-dependent genes. Mutant reporter gene was generated by mutating the intrinsic ATF2 motif to ATF3 motif for the ATF2 reporter, and vice versa for the ATF3 reporter. Unique flanking 5′ and 3′ extensions allowing for enzyme restriction digest were added as PCR anchor points. DNA cassettes were purchased as Ultramers from IDT, PCR amplified, and subcloned into the pGL4.24 vector (Promega) with a minimal promoter using KpnI and XhoI restriction enzyme (NEB). Full-length sequences for each multimerized motif are available in Supplementary Table 1. For luciferase assays, BMDM were seeded at 1.0×10⁴ cell per well in a 96-well plate, co-transfected with 10 ng of luciferase reporter construct, 4 ng of CMV-Renilla plasmid, using 0.3 μl of Lipofectamine 2000 per well, in a reverse transfection protocol. Cells were lysed in passive lysis buffer (Promega Dual Luciferase Kit) 48 hours post-transfection. Luminescence was read by Synergy HT plate reader (Biotek). Four biological replicates were used in each condition. Firefly luciferase signal was normalized to renilla luciferase signal to account for transfection efficiency.
Gene expression measurement.
RNA was isolated from cells using TRIzol (Invitrogen) and purified with the RNeasy minikit (Qiagen). qRT-PCR was performed using 500ng-1μg of RNA (Applied Biosystems) following the manufacturer’s instructions. qRT-PCR was performed on cultured macrophages using primers listed in Supplementary Table 1, with SYBR Green Master Mix (Applied Biosystems) on the QuantStudio 6 Flex Real-Time PCR system (Applied Biosytems). qPCR analysis was performed using the standard curve method, and all genes were normalized to the housekeeping gene 36b4. All qPCR experiments were done with at least 3 biological replicates per condition. For RNA-seq, RNA integrity was examined using Agilent RNA 6000 nano kit. 1μg of RNA samples with RNA integrity number >7 were used for RNA cleanup and library preparation with Illumina Truseq Stranded Total RNA Library Prep kit according to manufacturer’s instructions. All barcoded libraries were quantified by KAPA Library Quantification Kit (Roche), and equimolarly pooled for subsequent sequencing. All RNA-seq experiments were done with at least 3 biological replicates per condition. For each biological replicate, macrophages were pooled from at least 3–4 different mice.
RNA-seq data processing.
All RNA-seq libraries were sequenced on Illumina HiSeq2000, Hiseq4000, Nextseq500, or Novaseq6000 platform. Sequencing reads were aligned to the UCSC mm10 genome using STAR(v2.6.0a)39 with the following parameters: --outFilterMultimapNmax 1 --outSAMtype BAM SortedByCoordinate --readFilesCommand zcat --outSAMstrandField intronMotif. Read counts were then obtained from mapped bam files with featureCounts (v1.5.3)40 with the following parameters: -t exon -g gene_id -s 1 -T 20. To filter out lowly expressed genes, raw read counts were transformed into Transcripts-per-kilobase-million (TPM) and only genes with TPM > 0.1 in at least two of the biological replicates were kept in the count matrix for further downstream differential expression analyses. edgeR41 estimateDisp() and calcNormFactor() functions were used to estimate intrinsic dispersion and calculation normalization factors to account for variations in sequencing depth, respectively. Normalized read counts were fit to a negative binomial generalized log-linear model with glmFit(). To account for changes in two variables simultaneously, for example, LPS and HDAC3, multi-variable design matrices were used. Differentially expressed (DE) genes (cut-off defined as |log2FC| > 1, two-sided BH-adjusted FDR < 0.05) were identified using edgeR likelihood ratio test glmLRT().
To identify DA-independent transcriptome, first LPS-stimulated differentially expressed genes (|log2FC| > 1, FDR < 0.05) were identified from a) contrast between Y298F vs. MHD3KO: [(Y298F LPS – Y298F veh) –(MHD3KO LPS- MHD3KO veh)], b) contrast between control vs. MHD3KO: [(control LPS – control veh) –(MHD3KO LPS- MHD3kO veh)], c) contrast between WT-rescue vs. MHD3KO: [(WT-rescue LPS – WT-rescue veh) –(MHD3KO LPS- MHD3KO veh)]. DA-independent genes were classified as those that fit the null hypothesis of equality (i.e. no difference, FDR > 0.05) for the Y298F-rescue contrasts of [(Y298F vs. MHD3KO) – (control vs. MHD3KO)] and [(Y298F vs. MHD3KO) – (WT-rescue vs. MHD3KO)]. Similarly, the DA-dependent transcriptome fit the null hypothesis of equality for the contrasts of [(Y298F vs. control) – (MHD3KO vs. control)] and [(Y298F vs. WT-res) – (MHD3KO vs. WT-res)]. As such, for DA-independent genes, the Y298F transcriptome was statistically modelled to be overlapping with both control and WT-rescue, while maximally distant to MHD3KO. Meanwhile, for DA-dependent genes, Y298F transcriptome was statistically modelled to be overlapping with MHD3KO, while maximally distant to both control and WT-rescue. Cumulative distribution function (CDF) plots for DA-independent and DA-dependent transcriptomes were made with R package latticeExtra function ecdfplot(). Heatmaps were generated with R package pheatmap using z-transformed TPM or log2(FC) values across all biological replicates and treatment conditions. Gene ontology analyses of DA-independent, LPS-upregulated and DA-dependent, LPS-down-regulated genes were performed by Enrichr42,43 reporting terms with the most significant reported q-values (<0.05). Gene set enrichment analyses were performed with GSEA software44,45 using genesets provided directly from http://software.broadinstitute.org/gsea/.
GRO-seq and data processing.
GRO-seq was performed as previously described46,47 with the following modifications: BMDM were harvested from control and MHD3KO using 3 independent biological replicates per condition. For each biological replicate, BMDM from 10 different mice were pooled together before being treated with either PBS control or 5ng /ml of LPS for 4 hours prior to the harvest. Cells were washed twice with ice cold PBS, then put in cold swelling buffer (10mM Tris at pH 7.5, 2mM MgCl2, 3mM CaCl2) for 5 min on ice. Cells were scraped off and centrifuged at 400g for 10 min. The nuclei were then extracted using lysis buffer (swelling buffer with 10% glycerol and 1% Igepal). After two washes with lysis buffer, nuclei were resuspended in freezing buffer (50 mM Tris pH 8.3, 40% glycerol, 5 mM MgCl2, 0.1 mM EDTA). 1.0 × 10⁷ nuclei were used for each library. The nuclear run-on reaction was incubated in run-on buffer (10 mM Tris pH 8.0, 5 mM MgCl2, 1 mM DTT, 300 mM KCl, 200 U/ml Superase-In, 1% Sarkosyl, 500 mM ATP, GTP and Br-UTP, 2 mM CTP) for 7 min at 30 °C. Nascent transcripts were enriched with anti-BrUTP antibodies. After 10 min of RNA hydrolysis and reverse transcription, all products were used for GRO-seq library preparations in parallel to reduce batch effect.
GRO-seq libraries were barcoded and sequenced on the Illumina HiSeq4000 platform. Bidirectional eRNA identification was performed as previously described8,48. HDAC3-colocalized eRNAs were identified by overlapping all HDAC3 genomic sites with all bidirectional eRNA sites using bedtools49 intersectBed. Bidirectional eRNA signal density at specific HDAC3 peak regions were obtained with annotatepeaks.pl with a 2kb window from HDAC3 peak center, using the option -size 2000 -hist with a 25bp bin size. Average density profiles were generated with mean signal in normalized reads-per-million (RPM) and error bands for biological replicates. Density profile statistics were calculated with Wilcoxon rank sum test by R-function wilcox.test(), for two independent samples with no assumption of normal distribution and a null hypothesis of equal medians (x-y= μ = 0)
Western blot.
Cellular lysates were prepared by lysing cells (0.5–1.0×10⁷) in ice-cold RIPA buffer containing protease and phosphatase inhibitors (Roche). For H3K27Ac immunoblot, HDAC3 inhibitor cocktail (sodium butyrate, nicotinamide, and trichostatin A) was also added to lysis buffer. Cellular debris was removed by centrifugation (15,000 rpm) for 20 min at 4°C. Protein concentration was measured with Pierce™ BCA Protein Assay Kit (Fisher 23225) and all samples were normalized to the same input protein concentration. Samples were denatured in loading buffer, separated using SDS–PAGE, transferred to a PVDF membrane (Pierce), blocked with Odyssey® TBS Blocking Buffer (LICOR 927–50100), and probed using target-specific primary antibodies (listed in Supplementary Table 1) at 1:1000 dilution. Bound primary antibodies were detected by species-specific LICOR fluorescent IRDye® secondary antibodies (IRDye® 800CW Goat anti-Mouse 925–32210 lot# C70712–11 1:20,000 dilution; IRDye® 680RD Donkey anti-Rabbit 926–68073 lot# C90129–15 1:20,000 dilution). Immunoblots were imaged with the Odyssey® Sa Infrared Imaging System according to the manufacturer’s instructions. Dual-channel color (red/green) blots were converted to grayscale for color-blind friendly visualization purposes. Blots were cut appropriately by molecular weight whenever cross-species antibodies were used to reduce background (resulting from using murine-derived antibodies in murine-derived tissues). Raw blots can be found in Supplementary Figure 1.
Immunoprecipitation.
Fully differentiated BMDM or peritoneal macrophages were lysed with ChIP buffer (50nM Tris-HCl pH 7.5, 500mM NaCl, 1mM EDTA, 1% Triton-X 100, 0.1% sodium deoxycholate, 0.1% SDS, supplemented with cOmplete Protease Inhibitor, Roche, for H3K27Ac, HDAC3 inhibitor cocktail with sodium butyrate, nicotinamide, and trichostatin A was also added), incubated on ice for 30 min, and centrifuged at max speed for 30 min to collect cell debris at 4°C. 5% of the cleared lysates were saved as input. Lysates were subjected to BCA protein quantification to normalize the amount of input material subjected to immunoprecipitation. Lysates were then incubated with antibody overnight at 4°C, followed by immunoprecipitation with Protein A Sepharose CL-4B beads (30ul wet beads/ IP) for 6 hours at 4°C. Beads were subsequently subjected to 1× 5-min wash with ChIP-buffer, 1× 5-min wash with ChIP-buffer with additional 500nM NaCl, 1× 5-min wash with Wash buffer (10nM Tris-HCl pH 8.0, 250mM LiCl, 0.5% NP-40, 10% sodium deoxycholate, 1mM EDTA).
HDAC activity assay.
HDAC3 deacetylase activity was measured with the HDAC Assay Kit (Active Motif 56200) according to manufacturer’s instructions on immunoprecipitated HDAC3 (as described above) from control, MHD3KO, Y298F, or WT-rescue BMDM with 1mg of starting material using anti-HDAC3 antibody (Abcam 7030). Substrate solution containing short peptides with acetylated lysine residues were added directly to the HDAC3-antibody-Protein A bead slurry complex. After incubation with developing solution, fluorescent signals from standards and samples were detected by a plate reader system (Biotek Synergy HT), and deacetylase activity was determined by the standard curve method.
ChIP-seq and data processing.
All reported ChIP-seq experiments were done in three independent biological replicates, except for HDAC3 ChIP-seq in ATF2, ATF3, or p65 depleted cells where there were two independent biological replicates per condition. For each biological replicate, BMDM were pooled from at least five different mice for sufficient input material. 1.0×10⁷ BMDM were crosslinked on a petri plate with 1% formaldehyde for 15 minutes at room temperature, then quenched with 2.5M glycine for 5 minutes. Cross-linked cells were then scraped off the plates in PBS, collected by centrifugation 1000g × 5minutes, and lysed in 1mL ChIP buffer (described above) and placed on ice for 10 minutes. Chromatin fragmentation was performed with microtip probe sonicator (Fischer Scientific, FB705 Sonic Dismembrator) at 4°C with the following settings: 3× 10% amplitude for 10 seconds, followed by 3× 15% amplitude for 15 seconds, with a 30-second pause in between each sonication. Chromatin was then cleared with centrifugation at maximum speed for 30 minutes at 4°C, 5% saved for input, and incubated with antibodies (listed in Supplementary Table 1) overnight at 4°C. Immunoprecipitation of ChIP DNA is similar to IP procedure described above, except for reversal of cross-linking overnight at 65°C with elution buffer (50 mM Tris-HCl pH 8.0, 10 mM EDTA, 1% SDS), before being treated with 0.33 mg/ml RNase A (Fisher EN0531) and 0.5 mg/ml Proteinase K (Fisher 2546) at 37°C for 1 hour. DNA was isolated with phenol/chloroform followed by overnight −20°C ethanol precipitation. ChIP DNA was prepared for sequencing according to the amplification protocol provided by Illumina.
All ChIP-seq libraries were barcoded and sequenced on NextSeq500 or HiSeq4000. Sequencing reads of were aligned to the UCSC mm10 genome using Bowtie2 (v2.2.6)50with the following parameters -p 20 -N 1. Mapped reads were processed into tag counts, filtered for PCR duplicates, corrected for read-depth bias, and fragment lengths for each biological replicate with HOMER51 functions makeTagDirectory -tbp 1 -fragLength 150 -totalReads 2e7. For peak calling, findPeaks function was used with parameter -size 200 to resize all peaks to a uniform size of 200bp. As background, input samples were used, except for HDAC3 where MHD3KO was used. Peaks were called independently for each replicate. Only peaks that are present in at least two biological replicates are considered “true” peaks. Peaks are defined as foldchange IP/input(KO) > 4, FDR < 0.0001. Genome browser tracks were generated with HOMER function makeUCSCfile -bigWig -fsize 1e20 and corrected for variations in read-depth with -norm 2e7. For identification of HDAC3 peaks near DA-independent and DA-dependent genes, bedtools window -l 1e5 was used on genomic location of respective transcription start sites (obtained from genome.ucsc.edu) and HDAC3 peaks. For each gene, only the closet peak was counted. For peaks that happened to be close to both an DA-independent gene and an DA-dependent gene, whichever one closer to the peak was assigned. ChIP-seq signal density at specific peak regions were obtained with annotatepeaks.pl with a 2kb window from peak center, using the option -size 2000 -hist (for histograms) or -ghist (for heatmaps) with 25bp bin size. Average density profiles were generated with mean signal in normalized reads-per-million (RPM) and error bands for biological replicates. Density profile statistics were calculated with Wilcoxon rank sum test by R-function wilcox.test(), for two independent samples with no assumption of normal distribution and a null hypothesis of equal medians (x-y= μ = 0). De novo motif analyses were performed with HOMER function findMotifsGenome.pl. For identification of motifs specific to DA-independent and DA-dependent sites, a machine learning-based transcription factor binding analysis (TBA)17 was applied to HDAC3-bound genomic regions near DA-independent genes and DA-dependent genes. TBA (v1.0) was operated under recommended parameters (https://github.com/jenhantao/tba) with multi-threading and option -p to test for significance with a likelihood ratio test. For differential motif enrichment, DA-independent and DA-dependent genomic sites were cross-compared against each other as input and background, and vice versa. Enrichment score heatmap was generated using -log10(hypergeomtric p-value) for enrichment and log10(hypergeometric p-value) for depletion. ChIP-seq quality controls, including the number of mapped reads, peak counts, and FriP score are provided in Supplementary Table 2. Statistically significant motifs from HOMER de novo motif discovery for HDAC3, ATF2, ATF3, p65, NCoR1, and NCoR2 are listed in Supplementary Table 3.
Extended Data
Extended Data Figure 1|. Deacetylase (DA)-independent and –dependent functions of HDAC3 in the inflammatory response to LPS.
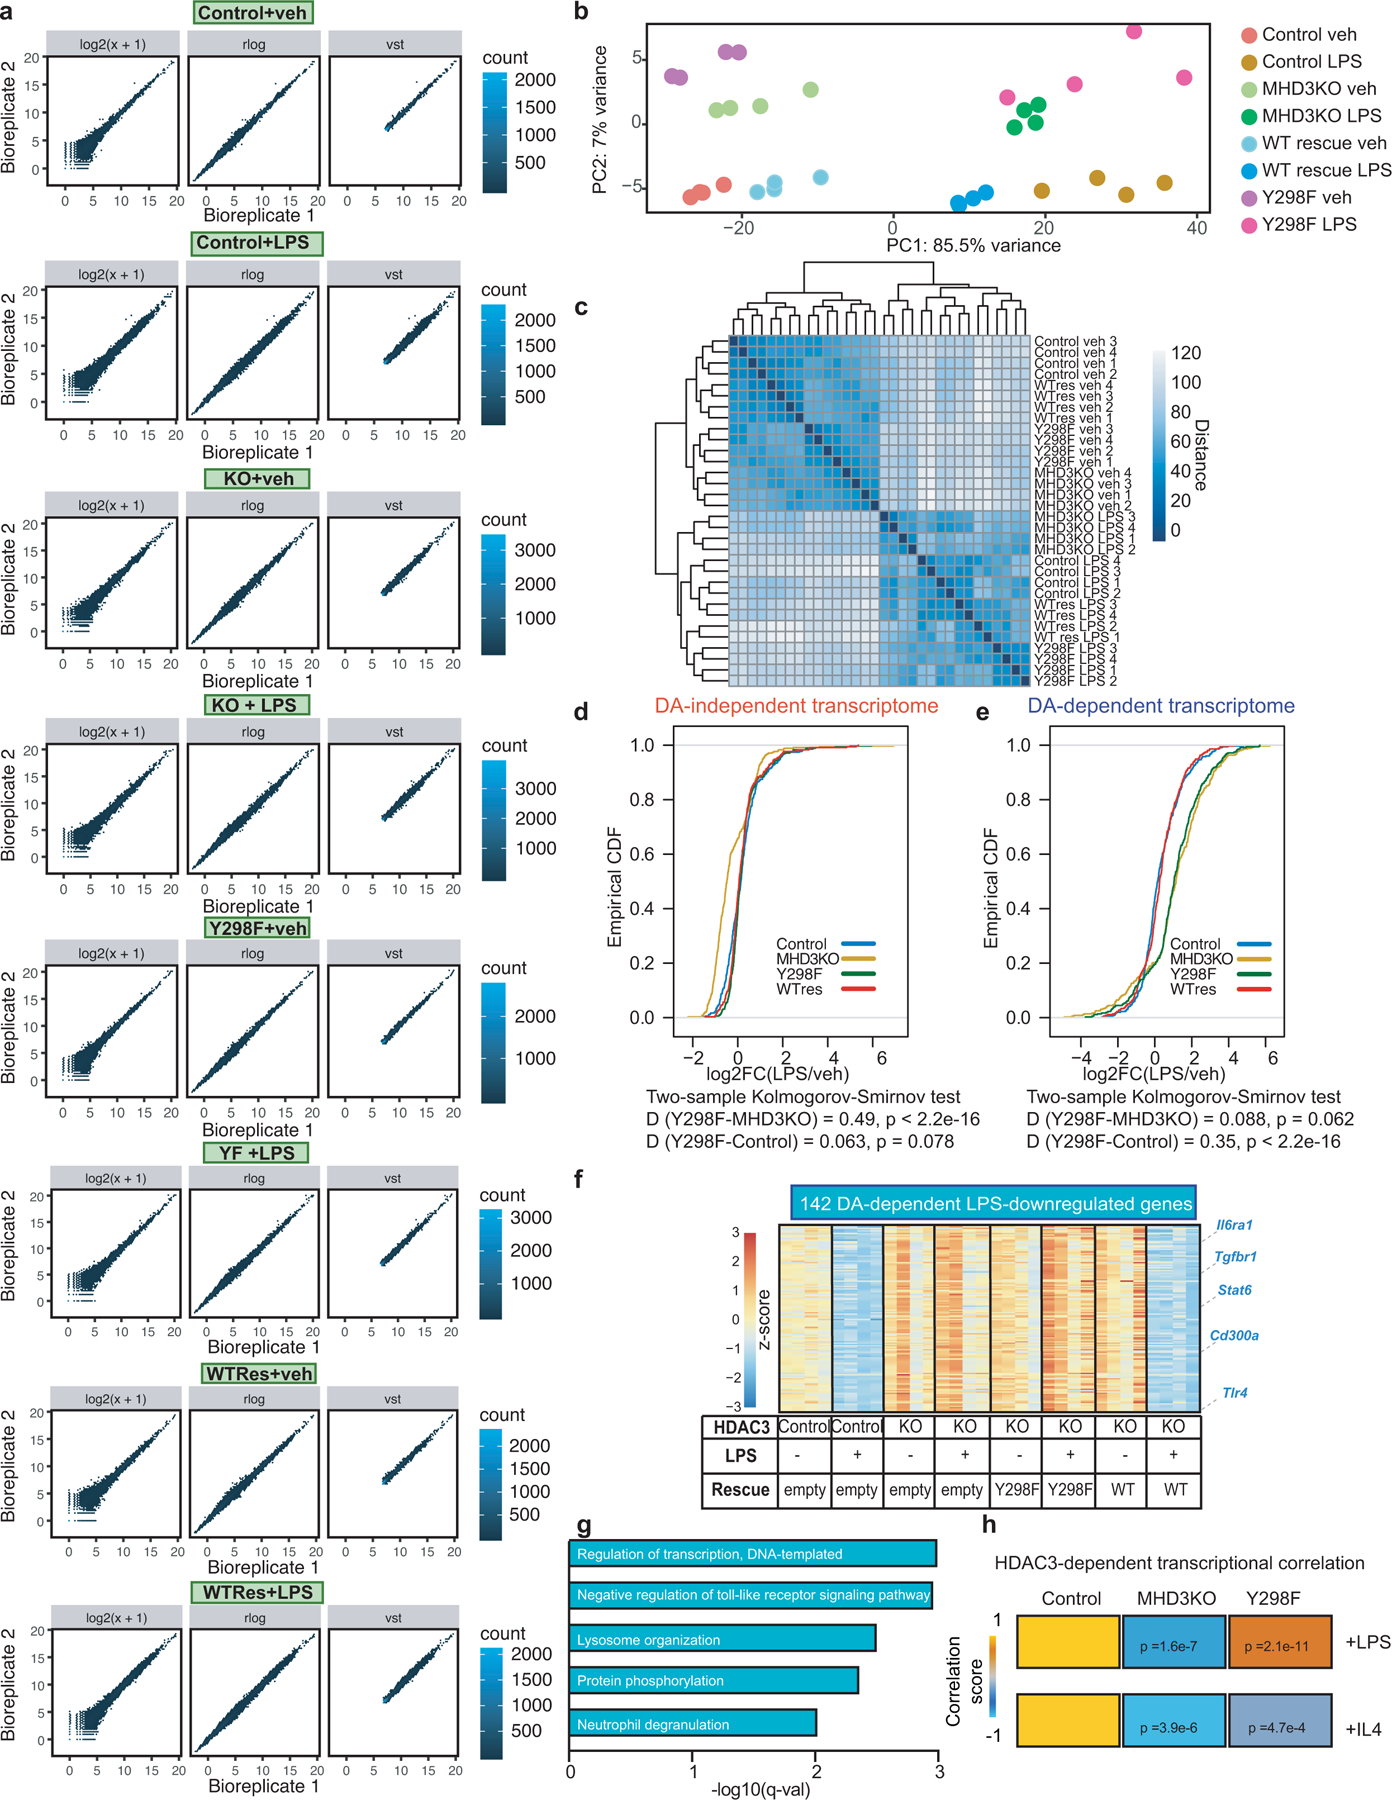
(a) Scatterplots of RNA-seq experiments in control, MHD3KO, Y298F, and WT-rescue, with or without LPS, showing correlation between biological replicates using either log2 transformation (log2(x+1)), variance stabilizing transformation (vst), or regularized-logarithm transformation (rlog) of normalized read counts. (b) Principle component analysis (PCA) plot using the vst values from RNA-seq experiments in control, MHD3KO, Y298F, and WT-rescue BMDM, with or without LPS (n = 4 biological replicates). (c) Heatmap of sample-to-sample distances using the vst values from RNA-seq experiments in control, MHD3KO, Y298F, and WT-rescue, with or without LPS (n = 4 biological replicates). (d) Empirical cumulative distribution function (CDF) and associated two-sided K-S test D-statistics of LPS-stimulated changes in statistically-modeled DA-independent gene expression (385 genes) for control, MHD3KO, Y298F, and WT-rescue (n = 4 biological replicates). (e) Empirical CDF and associated two-sided K-S test D-statistics of LPS-stimulated changes in statistically-modeled DA-dependent gene expression (377 genes) for control, MHD3KO, Y298F, and WT-rescue (n = 4 biological replicates). (f) Heatmap showing 142 LPS-down-regulated genes that were rescued by wild-type HDAC3 but not by Y298F (DA-dependent genes: n = 4 biological replicates, DE cutoff: |log2FC| > 1, two-sided BH-adjusted FDR < 0.05 as determined by edgeR likelihood ratio test). (g) Gene ontology analysis of 142 LPS-down-regulated genes (n = 4 biological replicates). q-values represent BH-adjusted one-sided hypergeometric p-values for over-representation as determined by Enrichr. (h) LPS-stimulated (762 genes) and IL4-stimulated (405 genes) transcriptomic correlation of MHD3KO and Y298F, compared to control BMDM (n = 4 biological replicates). Heatmap showing Spearman’s correlation rho values with corresponding two-sided p-values calculated by t-tests.
Extended Data Figure 2 |. Differential recruitment and enhancer activity of HDAC3 at LPS-responsive genes.
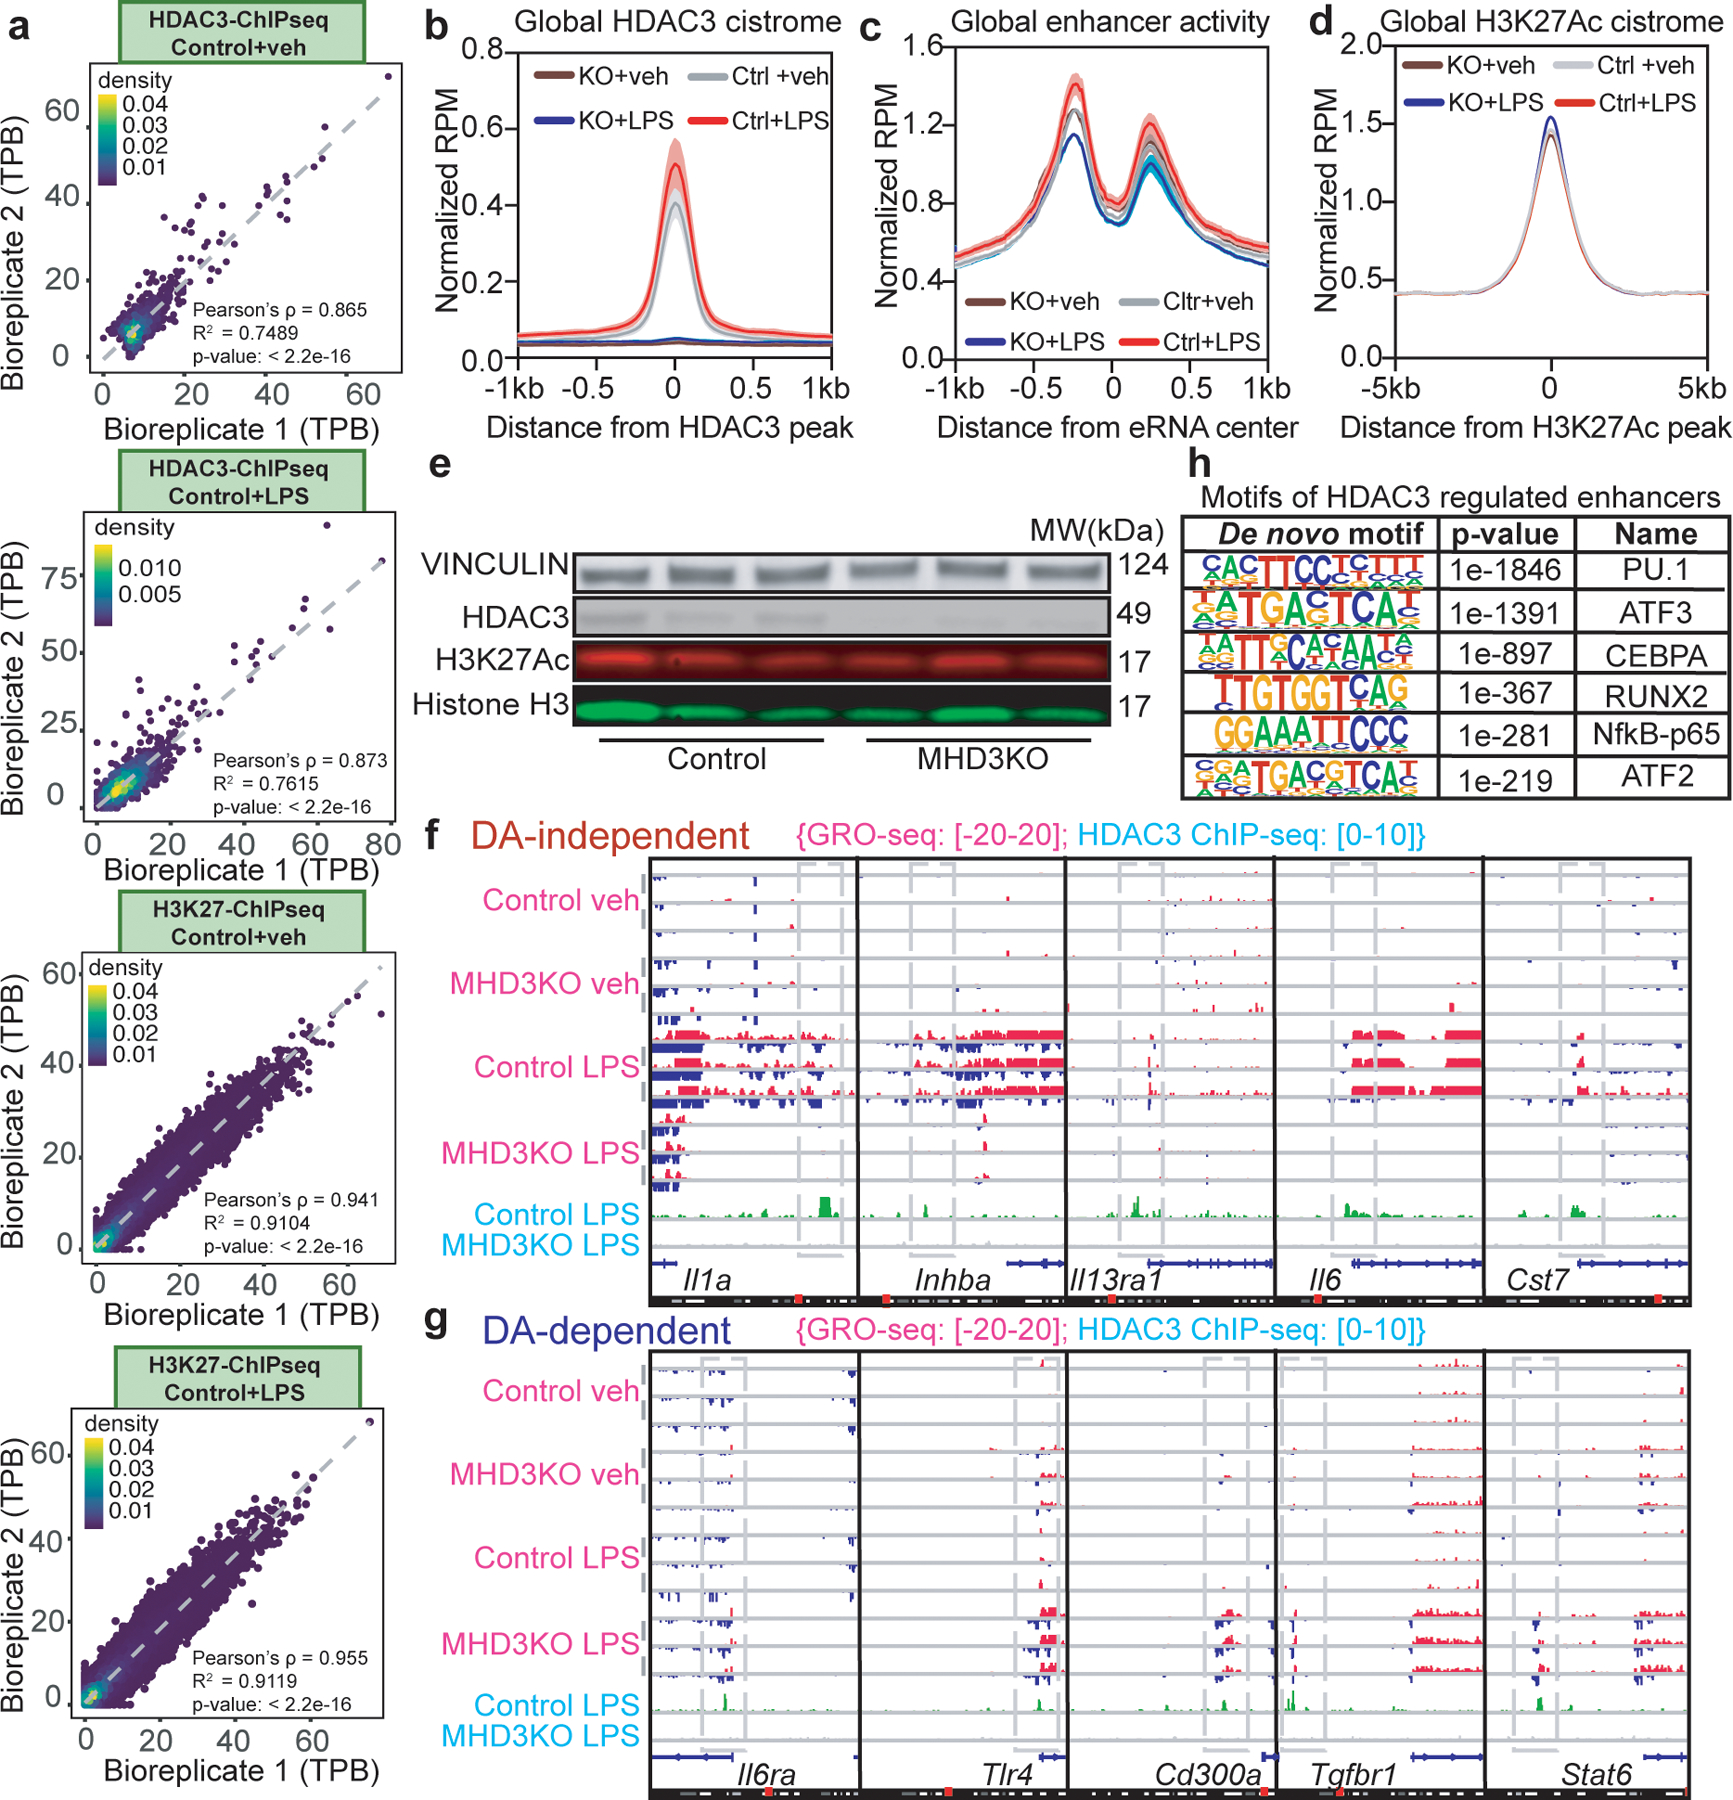
(a) Scatterplots of ChIP-seq experiments for HDAC3 and H3K27Ac in vehicle or LPS-treated control BMDM (n = 3 biological replicates) showing correlation between biological replicates using tag counts per base-pair (TPB) at identified peak regions. Pearson’s p-values were calculated with two-sided t-tests. (b) Average density profiles in RPM of HDAC3 ChIP-seq showing mean ± se (n = 3 biological replicates) at all identified HDAC3 peaks (10966 total) in control and MHD3KO macrophages, with or without LPS. (c) Average density profiles in RPM of GRO-seq showing mean ± se (n = 3 biological replicates) at all identified eRNAs (12192 total) in control and MHD3KO BMDM, with or without LPS. (d) Average density profiles in RPM of H3K27Ac showing mean ± se (n = 3 biological replicates) at all identified H3K27Ac peaks (50247 total) in control and MHD3KO macrophages, with or without LPS. (e) Western Blot (performed independently twice) of HDAC3 and H3K27Ac protein levels in control and MHD3KO macrophages, with Vinculin and Histone H3 as loading controls. (f,g) Genome-browser tracks showing three biologically replicated examples of enhancer and gene body activity as measured by GRO-seq relative to HDAC3 ChIP-seq peaks in control and MHD3KO macrophages, with or without LPS near (f) DA-independent or (g) DA-dependent genes. (h) Top de novo enriched motifs at HDAC3-bound genomic regions (10966 sites from n = 3 biological replicates). Statistics was determined by HOMER with one-sided hypergeometric p-values for over-representation.
Extended Data Figure 3 |. ATF2 and ATF3 differentially mediate HDAC3 transcriptional effects at DA-independent and DA-dependent sites, respectively.
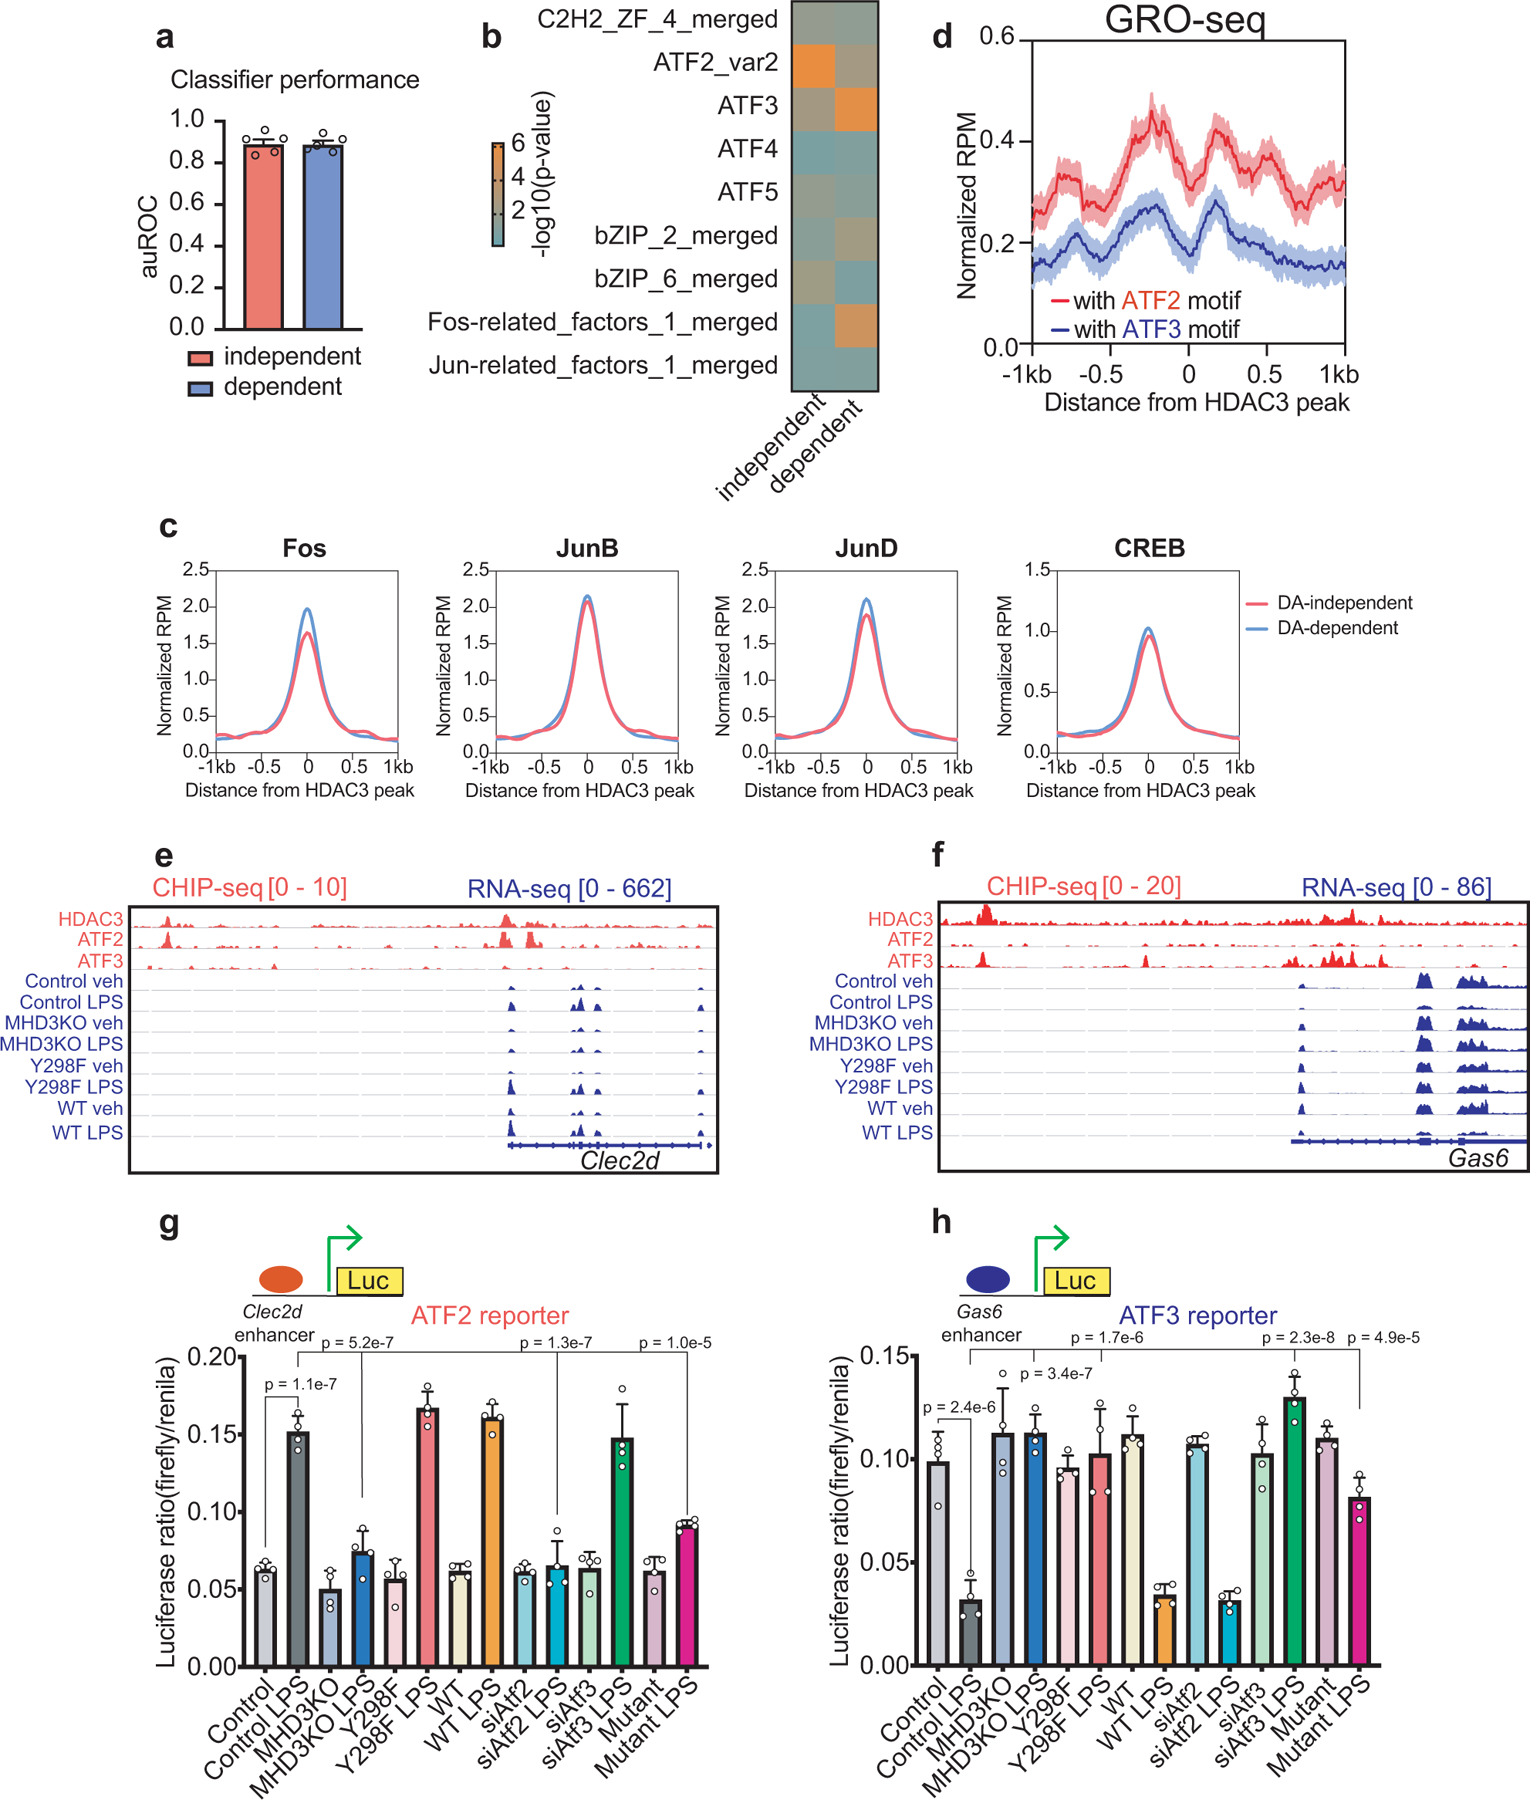
(a) Comparison of the performance of TBA classifiers modeled against DA-independent and DA-dependent 200bp-DNA sequences as measured by the area under the receiver operating characteristic curve (auROC, n = 5 independent train-test iterations, data shown mean ± sd). (b) Heatmap showing relative enrichment of several AP-1 family member DNA motifs as determined by TBA with likelihood ratio test against DA-independent and DA-dependent 200bp-DNA sequences across 5 train-test iterations. The non-redundant, merged motifs from TBA include ATF1,4,5,6,7, Jun family, Fos family, and other related bZIP factors. (c) Average density profiles in RPM of Fos, JunB, JunD, and CREB ChIP-seqs obtained from GEO database at HDAC3-bound sites near either DA-independent or DA-dependent genes in LPS-treated BMDM. (d) Average density profiles in RPM of bidirectional eRNA transcription measured by GRO-seq showing mean ± se (n = 3 biological replicates) at HDAC3-bound enhancers with ATF2 motif (1680 sites) or ATF3 motif (3673 sites) (two-sided Wilcoxon’s p = 8.6e-127) in LPS-treated BMDM. (e,f) Genome-browser tracks showing HDAC3, ATF2, and ATF3 ChIP-seq peaks at enhancer elements upstream of (e) Clec2d or (f) Gas6, as well as gene body activity as measured by RNA-seq in control, MHD3KO, Y298F, and WT rescue macrophages, with or without LPS. (g,h) Dual-luciferase assays of transcription driven by the (g) Clec2d or (h) Gas6 enhancers in control, MHD3KO, Y298F rescue, WT rescue (WT), ATF2-depleted, and ATF3-depleted BMDM, with or without LPS stimulation. Data shown mean ± sd, n = 4 biological replicates. p values were calculated by one-way ANOVA. DA-independent sites = 172, DA-dependent sites = 141.
Extended Data Figure 4 |. ATF2 and ATF3 recruit HDAC3 to sites near DA-independent and DA-dependent genes, respectively.
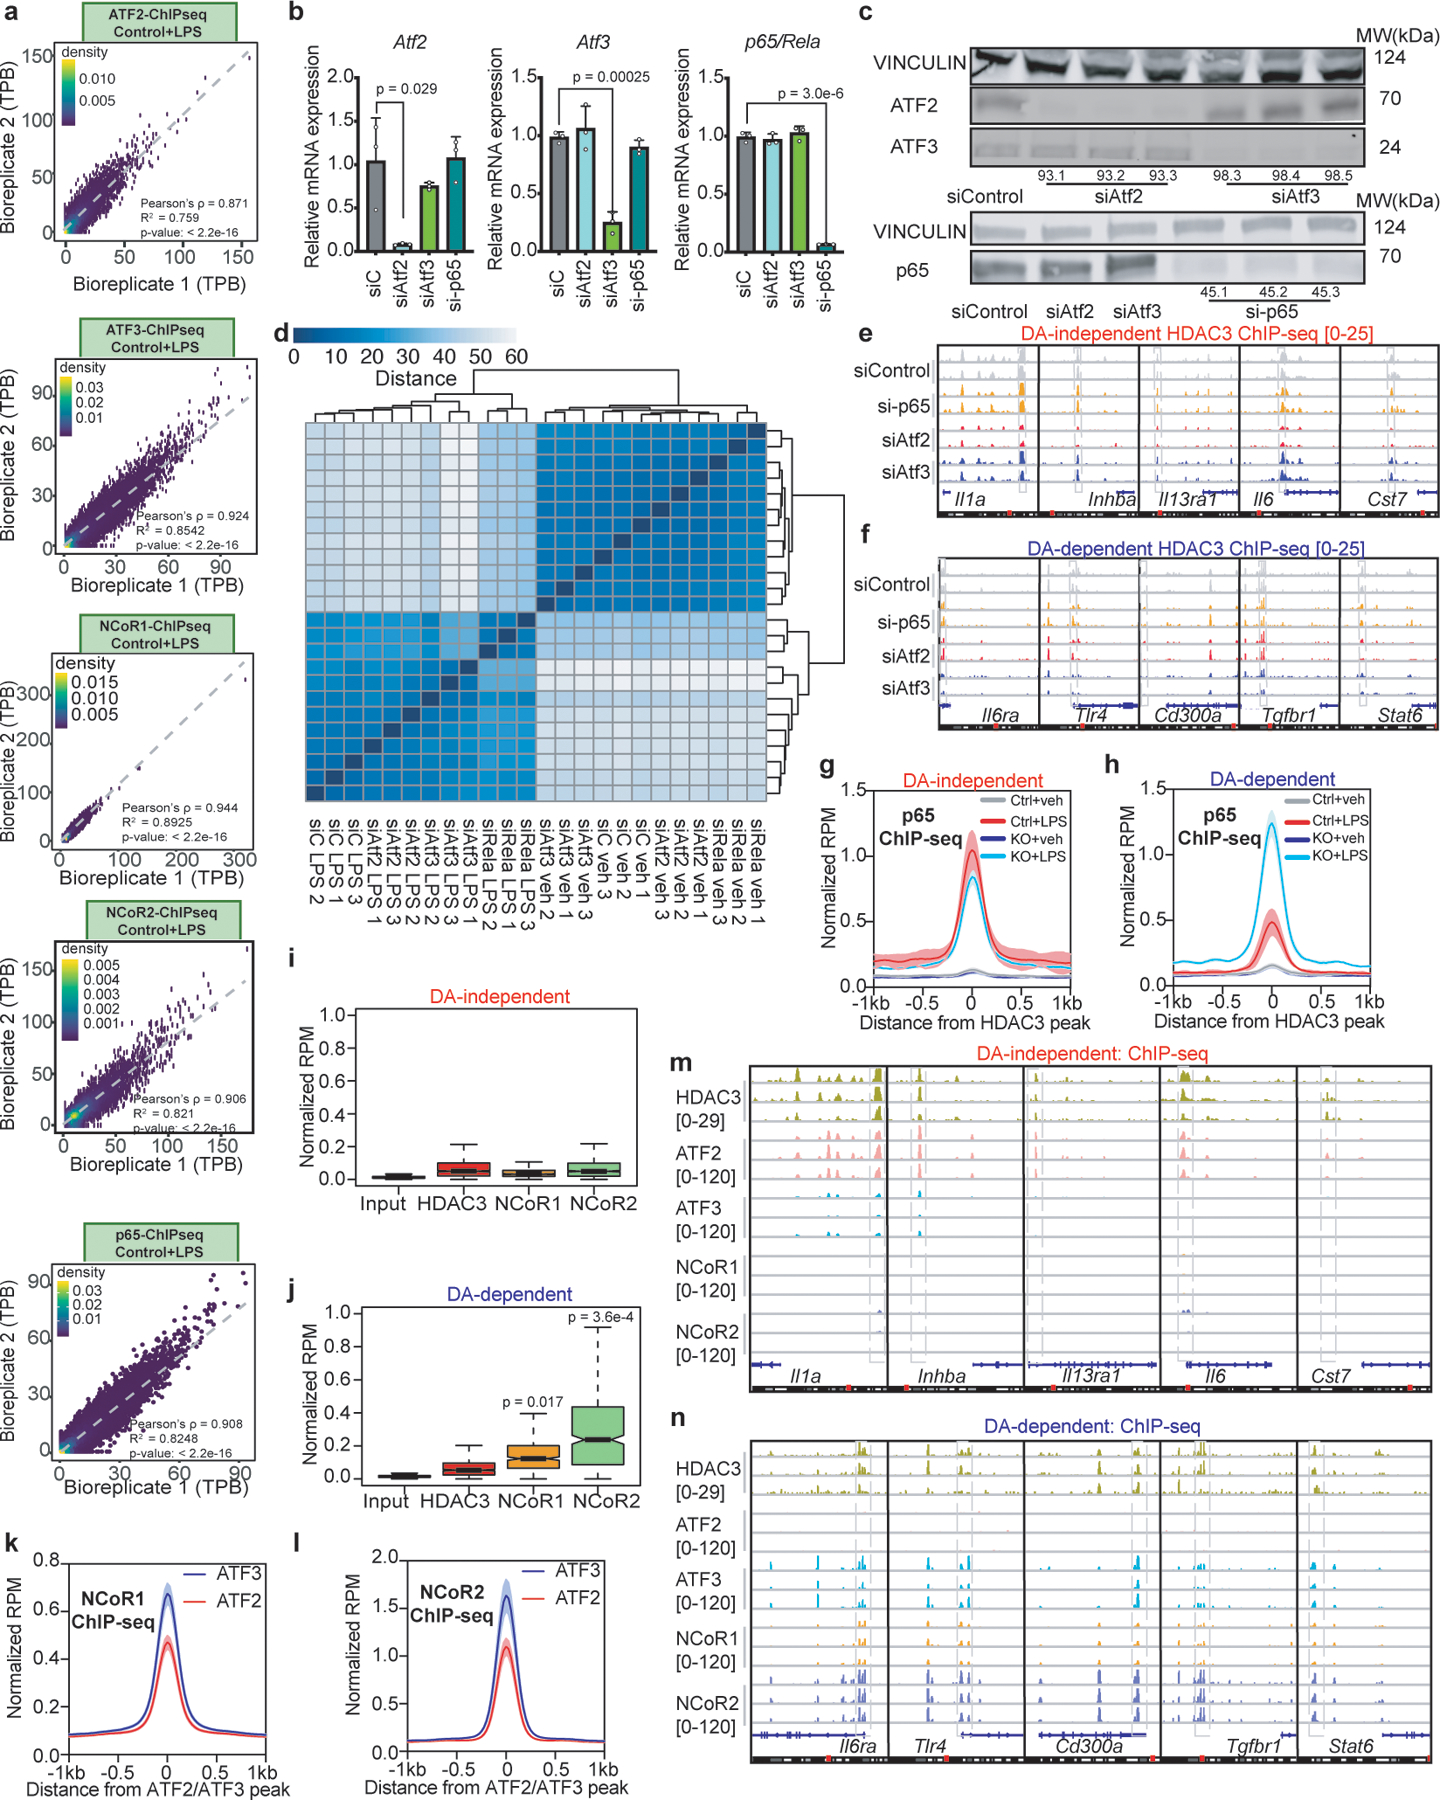
(a) Scatterplots of ChIP-seq experiments for ATF2, ATF3, NCoR1, NCoR2, and p65 in LPS-treated BMDM (n = 3 biological replicates) showing correlation between biological replicates using average tag counts per base-pair (TPB) at identified peak regions. Pearson’s p-values were calculated with two-sided t-tests. (b) Relative gene expression levels of Atf2, Atf3, and p65 (Rela) as measured by qRT-PCR in control (siC), ATF2-depleted (siAtf2), ATF3-depleted (siAtf3), or p65-depleted (si-p65) BMDM (n = 3 biological replicates). Data shown mean ± sd, p values calculated by two-sided Student’s t-test. (c) Western Blots (performed once) of ATF2, ATF3, and p65 protein levels with Vinculin as loading control for control (siControl), ATF2-depleted (siAtf2), ATF3-depleted (siAtf3), or p65-depleted (si-p65) BMDM, each with 3 independent siRNAs. (d) Heatmap of sample-to-sample distances using the vst values from RNA-seq experiments in control (siC), ATF2-depleted (siAtf2), ATF3-depleted (siAtf3), or p65-depleted (si-p65) BMDM, with or without LPS (n = 3). (e,f) Genome-browser tracks showing biologically replicated examples of HDAC3 ChIP-seq peaks in control (siControl), ATF2-depleted (siAtf2), ATF3-depleted (siAtf3), or p65-depleted (si-p65) LPS-stimulated BMDM near (e) DA-independent or (f) DA-dependent genes. (g,h) Average density profiles in RPM of p65 ChIP-seq showing mean ± se (n = 3 biological replicates) at HDAC3-bound sites near (g) DA-independent genes (Control LPS vs. MHD3KO LPS two-sided Wilcoxon’s p = 0.063) or (h) DA-dependent genes (Control LPS vs. MHD3KO LPS two-sided Wilcoxon’s p = 2.4e-16) in control and MHD3KO BMDM, with or without LPS. (i,j) Box-and-whisker plot showing minimum, maximum, median, first quartile and third quartile from quantification of average ChIP-seq signal (n = 3 biological replicates) in RPM for input, HDAC3, NCoR1, and NCoR2 at HDAC3-bound sites near (i) DA-independent or (j) DA-dependent genes. p-values were calculated with two-sided Mann-Whitney test. (k,l) Average density profiles in RPM showing mean ± se (n = 3 biological replicates) of (k) NCoR1 (two-sided Wilcoxon’s p = 4.7e-4) and (l) NCoR2 (two-sided Wilcoxon’s p = 1.2e-5) genomic colocalization with either ATF2 (19594 peaks) or ATF3 (n = 57041 peaks). (m,n) Genome-browser tracks showing three biologically replicated examples of ChIP-seq peaks for HDAC3, ATF2, ATF3, NCoR1, and NCoR2 in LPS-stimulated BMDM near (k) DA-independent or (l) DA-dependent genes. DA-independent sites = 172, DA-dependent sites = 141.
Extended Data Figure 5 |. Loss of HDAC3 protein but not deacetylase activity protects mice from acute endotoxic shock.
(a) Kaplan-Meier curves of wild-type C57Bl6 mice injected with increasing doses of LPS and observed for 120 hours (n = 4 independent mice). (b) Serum cytokine concentrations measured by ELISA for IL6 and TNFα in 10 mg/kg LPS-injected control, MHD3KO, NSDAD, C57Bl6 mice (n = 5 independent mice) administered with increasing doses of SAHA (25,100, 400mg/kg), and untreated control (n = 3 independent mice). Data shown mean ± sd, p values calculated by one-way ANOVA. (c) PCA plot using the vst values from RNA-seq experiments of in vivo peritoneal macrophages from control, MHD3KO, and NSDAD mice injected with vehicle control (PBS) or 10mg/kg LPS (n = 4 biological replicates, except for KO veh and NSDAD LPS with n = 3 biological replicates). (d) Scatterplot showing correlation between in vitro (n = 4 biological replicates) and in vivo (n = 3 biological replicates) DA-independent differential gene expression (174 genes). Pearson’s p-value was calculated with two-sided t-test. (e) Empirical CDF and associated two-sided K-S test D-statistics of LPS-stimulated changes in statistically-modeled DA-independent in vivo gene expression (251 genes) for peritoneal macrophages from control (n = 4 biological replicates), MHD3KO (n = 4 biological replicates), and NSDAD (n = 3 biological replicates). (f) Heatmap showing 177 LPS-downregulated, HDAC3-dependent differentially expressed genes in vivo that were not rescued by NSDAD (DA-dependent genes: n = 4 biological replicates, except for KO veh and NSDAD LPS with n = 3 biological replicates; DE cutoff: |log2FC| > 1, two-sided BH-adjusted FDR < 0.05 as determined by edgeR likelihood ratio test). (g) Empirical CDF and associated two-sided K-S test D-statistics of LPS-stimulated changes in statistically-modeled DA-dependent in vivo gene expression (404 genes) for peritoneal macrophages from control (n = 4 biological replicates), MHD3KO (n = 4 biological replicates), and NSDAD (n = 3 biological replicates). (h) Gene set enrichment analysis (GSEA) for the in vivo DA-dependent transcriptome (177 genes) showing enrichment of KEGG Toll-like receptor signaling pathway that was more upregulated in peritoneal macrophages from LPS-treated NSDAD mice (n = 3 biological replicates) than LPS-treated control mice (n = 4 biological replicates). Bar graph showing Tlr4 gene expression level in normalized counts of peritoneal macrophages from control and NSDAD treated with LPS. Data shown mean ± sd, two-sided p value was calculated by Student’s t-test. (i,j) Average density profiles in RPM of HDAC3 ChIP-seq showing mean ± se (n = 3 biological replicates) at HDAC3-bound sites near 167 in vivo (i) DA-independent genes (two-sided Wilcoxon’s p = 1.7e-23) or (j) 165 DA-dependent genes (two-sided Wilcoxon’s p = 0.153) in peritoneal macrophages from vehicle or LPS treated control mice.
Extended Data Figure 6 |. Dose-dependent effects of HDAC inhibitor SAHA on endotoxin susceptibility.
(a) Kaplan-Meier curves of C57Bl6 mice subjected to 10mg/kg of intraperitoneal injection of purified LPS, with increasing doses of SAHA (25, 100, 400 mg/kg). SAHA vehicle (veh) = 10% DMSO in PBS. (*) p = 0.036, (**) p = 0.001, (***) p = 0.00065, n = 10 independent mice, calculated by two-sided Mantel-Cox’s test. (b) Heatmap showing LPS-induced transcriptional changes as a function of Log2Foldchange (log2FC) of 179 in vivo DA-independent genes in LPS-exposed BMDM treated with increasing dose of SAHA (25, 100, 400nM, n = 3 biological replicates) and peritoneal macrophages from LPS-exposed MHD3KO (n = 4 biological replicates) and NSDAD mice (n = 3 biological replicates). (c) Average density profiles in RPM of HDAC3 ChIP-seq showing means of 3 biological replicates at HDAC3-bound sites near 172 DA-independent genes. (d) Genome-browser tracks showing 3 biologically replicated examples of ChIP-seq peaks for HDAC3 in LPS-stimulated BMDM treated with increasing dose of SAHA (25, 100, 400nM) near DA-independent genes. (e) Average density profiles in RPM of HDAC3 ChIP-seq showing means of 3 biological replicates at HDAC3-bound sites near 141 DA-dependent genes. (f) Genome-browser tracks showing 3 biologically replicated examples of ChIP-seq peaks for HDAC3 in LPS-stimulated BMDM treated with increasing dose of SAHA (25, 100, 400nM) near DA-dependent genes.
Supplementary Material
ACKNOWLEDGEMENTS
We are grateful to David Steger and Hani Goodarzi for helpful discussions. We thank Jill Marinis and Joanna DiSpirito for help in setting up the macrophage system. We also acknowledge the Functional Genomics Core of the Penn Diabetes Research Center (NIH P30 19525) for next generation sequencing. This work was supported by NIH R01 DK43806 (M.A.L.), NIH T32 DK07314 (A.K.H.), American Diabetes Association 1-18-PDF-126 (M.A.) and the JPB Foundation.
Footnotes
REFERENCES
- 1.Guenther MG, Barak O & Lazar MA The SMRT and N-CoR corepressors are activating cofactors for histone deacetylase 3. Mol. Cell. Biol 21, 6091–6101 (2001). [DOI] [PMC free article] [PubMed] [Google Scholar]
- 2.Watson PJ, Fairall L, Santos GM & Schwabe JWR Structure of HDAC3 bound to co-repressor and inositol tetraphosphate. Nature 481, 335–340 (2012). [DOI] [PMC free article] [PubMed] [Google Scholar]
- 3.You SH et al. Nuclear receptor co- repressors are required for the histone-deacetylase activity of HDAC3 in vivo. Nat. Struct. Mol. Biol 20, 182–187 (2013). [DOI] [PMC free article] [PubMed] [Google Scholar]
- 4.Chen X et al. Requirement for the histone deacetylase Hdac3 for the inflammatory gene expression program in macrophages. Proc. Natl Acad.Sci. USA 109, E2865–E2874 (2012). [DOI] [PMC free article] [PubMed] [Google Scholar]
- 5.Mullican SE et al. Histone deacetylase 3 is an epigenomic brake in macrophage alternative activation. Genes Dev. 25, 2480–2488 (2011). [DOI] [PMC free article] [PubMed] [Google Scholar]
- 6.Greer CB et al. Histone Deacetylases Positively Regulate Transcription through the Elongation Machinery. Cell reports vol. 13,7: 1444–1455 (2015). [DOI] [PMC free article] [PubMed] [Google Scholar]
- 7.Lewandowski SL, Janardhan HP & Trivedi CM Histone deacetylase 3 coordinates deacetylase independent epigenetic silencing of transforming growth factor- β1 (TGF- β1) to orchestrate second heart field development. J. Biol. Chem 290, 27067–27089 (2015). [DOI] [PMC free article] [PubMed] [Google Scholar]
- 8.Emmett MJ et al. Histone deacetylase 3 prepares brown adipose tissue for acute thermogenic challenge. Nature 546, 544–548 (2017). [DOI] [PMC free article] [PubMed] [Google Scholar]
- 9.Mann BS et al. FDA approval summary: vorinostat for treatment of advanced primary cutaneous T-cell lymphoma. The oncologist 1210: 1247–1252 (2007). [DOI] [PubMed] [Google Scholar]
- 10.Gryder BE, Quaovi HS, & Adegboyega KO Targeted cancer therapy: giving histone deacetylase inhibitors all they need to succeed. Future medicinal chemistry 44: 505–524 (2012). [DOI] [PMC free article] [PubMed] [Google Scholar]
- 11.De Souza C, & Biswa PC HDAC inhibitors as novel anti-cancer therapeutics. Recent patents on anti-cancer drug discovery 102: 145–162 (2015). [DOI] [PubMed] [Google Scholar]
- 12.Kazantsev AG, & Leslie MT Therapeutic application of histone deacetylase inhibitors for central nervous system disorders. Nature reviews Drug discovery 710: 854 (2008). [DOI] [PubMed] [Google Scholar]
- 13.Leoni F et al. The antitumor histone deacetylase inhibitor suberoylanilide hydroxamic acid exhibits antiinflammatory properties via suppression of cytokines. Proceedings of the National Academy of Sciences 995 (2002): 2995–3000. [DOI] [PMC free article] [PubMed] [Google Scholar]
- 14.Sun Z et al. Deacetylase-independent function of HDAC3 in transcription and metabolism requires nuclear receptor corepressor. Mol. Cell 52, 769–782 (2013). [DOI] [PMC free article] [PubMed] [Google Scholar]
- 15.Marinelli C et al. Ligand engagement of Toll-like receptors regulates their expression in cortical microglia and astrocytes. Journal of neuroinflammation 121 (2015): 244. [DOI] [PMC free article] [PubMed] [Google Scholar]
- 16.Gasperini M et al. A Genome-wide framework for mapping gene regulation via cellular genetic screens. Cell 1761–2 (2019): 377–390. [DOI] [PMC free article] [PubMed] [Google Scholar]
- 17.Fonseca GJ et al. Diverse motif ensembles specify non-redundant DNA binding activities of AP-1 family members in macrophages. Nature communications 10,1 414 (2019). [DOI] [PMC free article] [PubMed] [Google Scholar]
- 18.Barish GD et al. Bcl-6 and NF-kappaB cistromes mediate opposing regulation of the innate immune response. Genes Dev 24(24):2760–5 (2010). [DOI] [PMC free article] [PubMed] [Google Scholar]
- 19.Chen S et al. Valproic acid attenuates traumatic spinal cord injury-induced inflammation via STAT1 and NF-κB pathway dependent of HDAC3. Journal of neuroinflammation 151: 150 (2018). [DOI] [PMC free article] [PubMed] [Google Scholar]
- 20.Ziesché E et al. The coactivator role of histone deacetylase 3 in IL-1-signaling involves deacetylation of p65 NF-κB. Nucleic acids research vol. 41,1: 90–109 (2012). [DOI] [PMC free article] [PubMed] [Google Scholar]
- 21.Chen L et al. Duration of nuclear NF-κB action regulated by reversible acetylation. Science 2935535 (2001): 1653–1657. [DOI] [PubMed] [Google Scholar]
- 22.Kiernan R, et al. Post-activation turn-off of NF-κB-dependent transcription is regulated by acetylation of p65. Journal of Biological Chemistry 2784 (2003): 2758–2766. [DOI] [PubMed] [Google Scholar]
- 23.Khuu C et al. Activating transcription factor 3 (ATF3) represses the expression of CCL4 in murine macrophages. Molecular immunology 447 (2007): 1598–1605. [DOI] [PubMed] [Google Scholar]
- 24.De Nardo D et al. High-density lipoprotein mediates anti-inflammatory reprogramming of macrophages via the transcriptional regulator ATF3. Nature immunology 152 (2014): 152. [DOI] [PMC free article] [PubMed] [Google Scholar]
- 25.Luo H, et al. ATF3 inhibits tenascin-C-induced foam cell formation in LPS-stimulated THP-1 macrophages by suppressing TLR-4. Journal of atherosclerosis and thrombosis (2015): 28415. [DOI] [PubMed] [Google Scholar]
- 26.Bambouskova M et al. Electrophilic properties of itaconate and derivatives regulate the IκBζ–ATF3 inflammatory axis. Nature 5567702: 501 (2018). [DOI] [PMC free article] [PubMed] [Google Scholar]
- 27.Labzin LI et al. ATF3 Is a Key Regulator of Macrophage IFN Responses. J Immunol 195(9):4446–55 (2015). [DOI] [PubMed] [Google Scholar]
- 28.Yan Q et al. Nuclear factor-κB binding motifs specify Toll-like receptor-induced gene repression through an inducible repressosome. Proceedings of the National Academy of Sciences 10935: 14140–14145 (2012). [DOI] [PMC free article] [PubMed] [Google Scholar]
- 29.Copeland S et al. Acute inflammatory response to endotoxin in mice and humans. Clin. Diagn. Lab. Immunol 121 (2005): 60–67. [DOI] [PMC free article] [PubMed] [Google Scholar]
- 30.Honore PM et al. Cytokine removal in human septic shock: Where are we and where are we going? Ann. Intensive Care (2019) 9: 56. [DOI] [PMC free article] [PubMed] [Google Scholar]
- 31.Wheeler DS, et al. Induction of endotoxin tolerance enhances bacterial clearance and survival in murine polymicrobial sepsis. Shock (Augusta, Ga.) 303 (2008): 267. [DOI] [PMC free article] [PubMed] [Google Scholar]
- 32.Roger T et al. Histone deacetylase inhibitors impair innate immune responses to Toll-like receptor agonists and to infection. Blood 1174: 1205–1217 (2011). [DOI] [PubMed] [Google Scholar]
- 33.Lin H‐S, et al. Anti‐rheumatic activities of histone deacetylase (HDAC) inhibitors in vivo in collagen‐induced arthritis in rodents. British journal of pharmacology 1507 (2007): 862–872. [DOI] [PMC free article] [PubMed] [Google Scholar]
- 34.Hu Q and Mao D Histone deacetylase inhibitor SAHA attenuates post-seizure hippocampal microglia TLR4/MYD88 signaling and inhibits TLR4 gene expression via histone acetylation. BMC neuroscience 171 (2016): 22. [DOI] [PMC free article] [PubMed] [Google Scholar]
- 35.Huber K et al. Inhibitors of histone deacetylases correlation between isoform specificity and reactivation of HIV type 1 (HIV-1) from latently infected cells. Journal of Biological Chemistry 28625 (2011): 22211–22218. [DOI] [PMC free article] [PubMed] [Google Scholar]
- 36.Kuang Z et al. The intestinal microbiota programs diurnal rhythms in host metabolism through histone deacetylase 3. Science 365, 1428 (2019). [DOI] [PMC free article] [PubMed] [Google Scholar]
- 37.Robinson JT et al. Integrative genomics viewer. Nature biotechnology 291 (2011): 24. [DOI] [PMC free article] [PubMed] [Google Scholar]
- 38.Lee MS et al. Genome-wide profiling of in vivo LPS-responsive genes in splenic myeloid cells. Molecules and cells 356 (2013): 498–513. [DOI] [PMC free article] [PubMed] [Google Scholar]
- 39.Dobin A et al. STAR: ultrafast universal RNA-seq aligner. Bioinformatics (Oxford, England) vol. 29,1 (2012): 15–21. [DOI] [PMC free article] [PubMed] [Google Scholar]
- 40.Liao Y, Smyth GK, & Shi W featureCounts: an efficient general purpose program for assigning sequence reads to genomic features. Bioinformatics 307 (2013): 923–930. [DOI] [PubMed] [Google Scholar]
- 41.Robinson MD, McCarthy DJ & Smyth GK edgeR: a Bioconductor package for differential expression analysis of digital gene expression data. Bioinformatics 26, 139–140 (2010). [DOI] [PMC free article] [PubMed] [Google Scholar]
- 42.Chen EY et al. Enrichr: interactive and collaborative HTML5 gene list enrichment analysis tool. BMC Bioinformatics 14, 128 (2013). [DOI] [PMC free article] [PubMed] [Google Scholar]
- 43.Kuleshov MV et al. Enrichr: a comprehensive gene set enrichment analysis web server 2016 update. Nucleic Acids Res. 44 (W1), W90–W97 (2016). [DOI] [PMC free article] [PubMed] [Google Scholar]
- 44.Subramanian A et al. Gene set enrichment analysis: a knowledge-based approach for interpreting genome-wide expression profiles. Proceedings of theNational Academy of Sciences 10243 (2005): 15545–15550. [DOI] [PMC free article] [PubMed] [Google Scholar]
- 45.Mootha VK et al. PGC-1α-responsive genes involved in oxidative phosphorylation are coordinately downregulated in human diabetes. Nature genetics 343 (2003): 267. [DOI] [PubMed] [Google Scholar]
- 46.Wang Dong, et al. Reprogramming transcription by distinct classes of enhancers functionally defined by eRNA. Nature 4747351 (2011): 390. [DOI] [PMC free article] [PubMed] [Google Scholar]
- 47.Kaikkonen Minna U., et al. Remodeling of the enhancer landscape during macrophage activation is coupled to enhancer transcription. Molecular cell 513 (2013): 310–325. [DOI] [PMC free article] [PubMed] [Google Scholar]
- 48.Fang B et al. Circadian enhancers coordinate multiple phases of rhythmic gene transcription in vivo. Cell 159, 1140–1152 (2014). [DOI] [PMC free article] [PubMed] [Google Scholar]
- 49.Quinlan AR, & Hall IM BEDTools: a flexible suite of utilities for comparing genomic features. Bioinformatics 266 (2010): 841–842. [DOI] [PMC free article] [PubMed] [Google Scholar]
- 50.Langmead B & Salzberg S Fast gapped-read alignment with Bowtie 2. Nature Methods. 2012, 9:357–359. [DOI] [PMC free article] [PubMed] [Google Scholar]
- 51.Heinz S, Benner C, Spann N, Bertolino E et al. Simple Combinations of Lineage-Determining Transcription Factors Prime cis-Regulatory Elements Required for Macrophage and B Cell Identities. Mol Cell 2010. May 28;38(4):576–589. [DOI] [PMC free article] [PubMed] [Google Scholar]
Associated Data
This section collects any data citations, data availability statements, or supplementary materials included in this article.