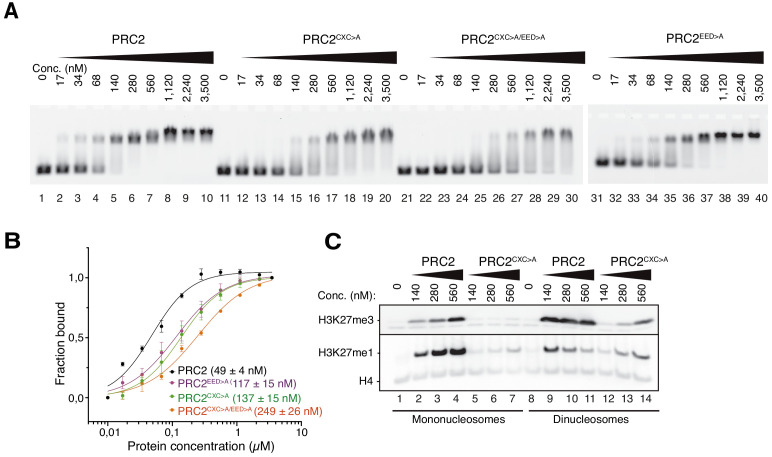
Figure 2. The EZH2CXC-DNA interaction interface is critical for H3K27 methylation on nucleosomes.
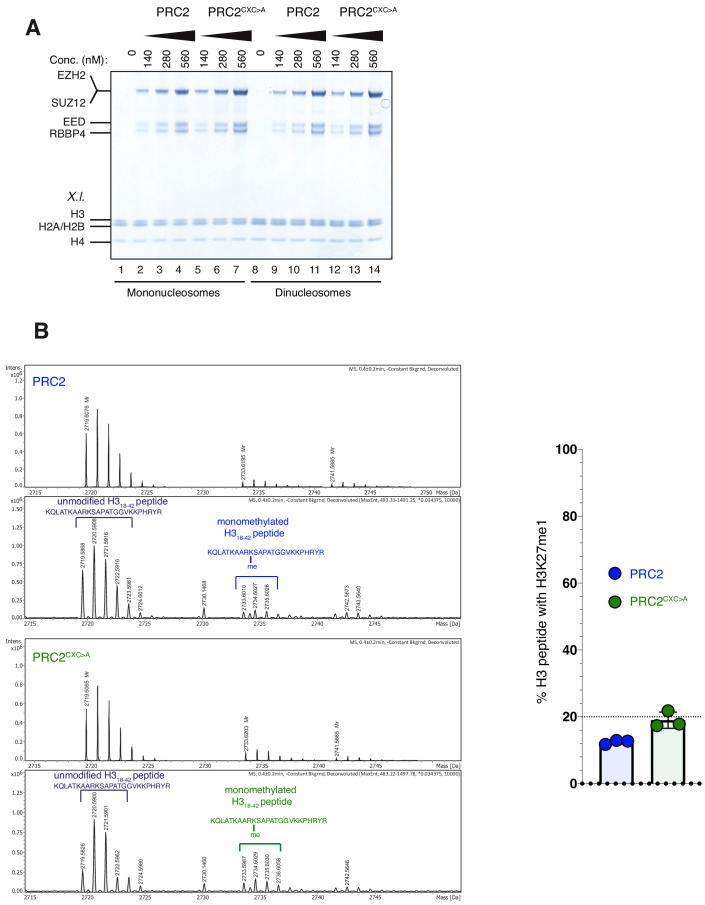
(A) Binding reactions with indicated concentrations of PRC2 (lanes 1–10), PRC2CXC>A (lanes 11–20), PRC2CXC>A/EED>A (lanes 21–30), or PRC2EED>A (lanes 31–40) and 45 nM 6-carboxyfluorescein-labeled mononucleosomes, analyzed by EMSA on 1.2% agarose gels. The EMSA with PRC2EED>A was run on a separate gel. (B) Quantitative analysis of EMSA data in A by densitometry of 6-carboxyfluorescein signals from independent experiments (n = 3); error bars, SEM. (C) Western Blot (WB) analysis of H3K27me1 and H3K27me3 formation in HMTase reactions with indicated concentrations of PRC2 and PRC2CXC>A on 446 nM mononucleosomes (lanes 1–7) or 223 nM dinucleosomes (lanes 8–14). Note that these concentrations result in equal numbers of nucleosomes and therefore equal numbers of H3 substrate molecules in the reactions on mono- and dinucleosomes, as can be seen from the Coomassie-stained gel of the reactions in Figure 2—figure supplement 1B. H4 WB signal served as control for western blot processing.


