

Summary
The basal ganglia are implicated in a range of perceptual functions [1], in addition to their well-known role in the regulation of movement [2]. One unifying explanation for these diverse roles is that the basal ganglia control the level of commitment to particular motor or cognitive outcomes based on the behavioral context [3, 4]. If this explanation is applicable to the allocation of visual spatial attention, then the involvement of basal ganglia circuits should incorporate the subject’s expectations about the spatial location of upcoming events as well as the routing of visual signals that guide the response. From the viewpoint of signal detection theory, these changes in the level of commitment might correspond to shifts in the subject’s decision criterion, one of two distinct components recently ascribed to visual selective attention [5]. We tested this idea using unilateral optogenetic activation of neurons in the dorsal striatum of mice during a visual spatial attention task [6], taking advantage of the ability to specifically target medium spiny neurons in the “direct” pathway associated with promoting responses [7, 8]. By comparing results across attention task conditions, we found that direct-pathway activation caused changes in performance determined by the spatial probability and location of the visual event. Moreover, across conditions with identical visual stimulation, activation shifted the decision criterion selectively when attention was directed to the contralateral visual field. These results demonstrate that activity through the basal ganglia may play an important and distinct role among the multifarious mechanisms that accomplish visual spatial attention.
eTOC Blurb
By combining optogenetic manipulation of the striatal direct pathway with visual attention tasks adapted from work in primates, Wang and Krauzlis show that activity through the basal ganglia in mice plays a distinct role in the allocation of visual spatial attention.
Results
The logic of the experiment relies on the fact that each half of the visual field is processed primarily by circuits in the opposite (i.e., contralateral) side of the brain, and that descending projections from the cortex to the basal ganglia and other subcortical structures (e.g., thalamus) largely retain this lateralized mapping (Figure 1A). These asymmetries in connectivity apply not only to the sensory signals from visual cortex but also to the task-related signals from frontal and parietal areas that contain information about the subject’s spatial expectation [9, 10]. Thus, when a mouse expects a visual event in the left visual field during a spatial attention task (Figure 1B top), they could increase their commitment to process signals from that side of the visual field by facilitating signal transmission in the right side of the brain (Figure 1C top). Conversely, when the probability of a contralateral (i.e., left visual field) event is lower (Figure 1B middle, bottom), the level of commitment could be decreased by reducing or eliminating the facilitation of right-side circuits.
Figure 1. Testing processing asymmetries in basal ganglia circuits during visual spatial attention task in mice.

(A) Schematic diagram of circuits affected during by activation of neurons in striatal direct pathway during our visual detect task. Optic fiber was used to optogenetically activate neurons expressing channelrhodopsin (yellow) unilaterally in the striatal direct pathway. These neurons and other circuit elements on this (right) side of the brain primarily process visual signals from the contralateral (left) visual field. Black circles indicate inhibitory synapses and white triangles indicate excitatory synapses. Orange (blue) indicates elements contralateral (ipsilateral) to our targeted site in the striatum. (B) Diagram of the 3 types of trials used to manipulate spatial attention that were presented in interleaved blocks. The sequences of screen shots show how spatial cues were used to inform the mouse about the probability of an orientation change in the visual field contralateral to our target site in the striatum. (C) Schematic depiction of the circuit asymmetries associated with the different levels of commitment to process contralateral visual signals. (D) Timeline of the task epochs and events during the attention trials. The onset of the visual event (i.e., orientation change) is defined as time zero. The outcome of each trial was determined by whether the first lick fell within the 500ms response window starting 300 ms after the stimulus change. The unilateral optogenetic activation was very low power (0.1–0.8 mW) blue light (465 nm) applied on a random half of the trials from 50 – 200 ms after the visual change (or time-matched on no-change trials). (E-F) Histology sections showing localization of optogenetic activation in dorsomedial striatum in a mouse sectioned in the sagittal plane (E, T420) and the coronal plane (F, T446). Selective expression in direct-pathway medium spiny neurons produces axonal labeling in the substantia nigra reticulata (SNr). Scale bars: 1 mm. (G) Summary of locations of optic fiber tips projected onto coronal section of standard mouse atlas.
If these processing asymmetries through the basal ganglia are linked to the control of spatial attention, then activation of neurons in the striatal direct pathway should alter task performance in ways that depend on the allocation of spatial attention, as well as the location of the visual event. To perform this test, it is crucial to include task conditions that are matched for visual stimulation but differ in spatial attention, so that effects linked to attention can be distinguished from effects due to differences in visual processing. It is also important that the salience of the visual event be adjusted to lie near the subject’s psychophysical threshold for detection, so that performance is limited by the efficiency of visual processing rather than by other non-sensory factors, such as behavioral strategy or motivation. In a previous behavioral study [6], we showed that this strategy can work in mice – by comparing performance across attention task conditions adapted from classic cueing paradigms in humans, and matched for visual stimulation, we found that mice can use spatial cues to improve their visual detection performance. Here we again verified the allocation of spatial attention by comparing performance across attention task conditions, and combined this task design with causal manipulations of activity in the striatal direct pathway.
We first verified that our task manipulated the allocation of spatial attention, consistent with our previous behavioral results [6]. Mice were trained to detect an unpredictable threshold-level visual event – a slight change in the orientation of a Gabor patch – by contacting the lick spout within a 500-ms response window, and to not lick at other times during the trial. On the randomly interleaved half of trials with a visual event (Figure 1B), mice should lick within the response window to score a “hit” (Figure 1D); licks earlier in the trial led to trial aborts. On the other half of trials with no visual event, licks within the response window were counted as “false alarms”. Across interleaved blocks of trials, we systematically manipulated the probability that the visual event would occur in the visual field contralateral to our targeted site in the striatum. In some blocks (Figure 1B top), a spatial cue indicated that if there was a visual event, it would occur in the contralateral visual field – the conditional probability of a contralateral event was 100%. In other blocks (Figure 1B middle), no cue was provided, and the visual event was equally likely to occur on either side; the conditional probability of a contralateral event was 50%. Finally, in the remaining blocks (Figure 1B bottom), a spatial cue indicated that the possible visual event would occur in the ipsilateral visual field; the conditional probability of a contralateral event was 0%. Consistent with previous results [6], we confirmed that mice could improve their performance by taking advantage of spatial cues to appropriately adjust response criterion (cue trials: 0.22 ± 0.17, mean ± 95% CI; no-cue trials: 0.62 ± 0.19, p < 10−5, paired-sample t-test), increase sensitivity (cue trials: 1.99 ± 0.27; no-cue trials: 1.34 ± 0.23, p < 10−7), and shorten reaction times (cue trials: 478.2 ± 34.0 ms; no-cue trials: 512.0 ± 32.1 ms, p = 0.0011 paired-sample Wilcoxon signed-rank test).
We then examined how activation of medium spiny neurons in the direct pathway altered performance across these spatial attention conditions. We applied low-power blue light on a random half of trials for a 150-ms interval starting 50 ms after the visual change, chosen to overlap with the established timing of visual responses of neurons in these circuits [9, 11], and ending 100 ms before the response window (Figure 1D). The light was applied as a low-power continuous pulse to facilitate normally occurring spiking activity rather than directly evoking artificial trains of spikes [8]. By ending the light activation before the response window, we confirmed that the light did not directly trigger licks during the no-lick period imposed before the response window (see Methods), a point also addressed by additional control experiments described later. Histology performed at the conclusion of the experiments confirmed the selective expression of ChR2 in striatal neurons in the direct pathway based on the expression pattern and anatomical projections (Figure 1E–F), and verified the placement of the optic fiber tips in the dorsomedial striatum (Figure 1G) at sites that overlie the projections from visual areas and frontal cortex [10].
Activating neurons in the striatal direct pathway caused changes in detection performance that depended on the conditional probability of a contralateral event across the different attention task variations. Overall, we found the largest increases in false alarms (Figure 2A, Table S1) and hits (Figure 2B) when the conditional probability of a contralateral event was 100%, smaller increases for 50%, and minimal increases for 0%. This dependence on contralateral probability was significant for both false alarms (p < 10−5, one-way ANOVA)) and hits (p = 0.0012). Reaction times showed a similar dependence – activating striatal neurons shortened reaction times the most for contralateral events when the conditional probability for contralateral events was the highest (Figure 2C, p = 0.0082, Kruskal-Wallis test).
Figure 2. Effects of striatal activation on attention task performance.

(A) Changes in false alarm rates (along x-axis) caused by striatal activation (false alarms with activation minus false alarms without activation), showing the dependence on the conditional probability of a contralateral event (y-axis). Circle connected by lines indicate data from individual mice. Gray bars indicate population medians with 95% CI. Gray lines with asterisks indicate comparisons with significant differences (p<0.05). (B) Changes in hit rates caused by striatal activation. (C) Changes in reaction times caused by striatal activation. (D) Summary of changes in performance accuracy caused by striatal activation, shown as a receiver operating characteristic (ROC) plot of hit rate against false alarm rate. Unfilled circles are population medians (with 95% CI) from trials without striatal activation, filled circles are population medians with striatal activation. The vertical offsets in the data, with the 0% and 100% values above the 50% values, illustrates the better performance achieved when spatial cues were provided. Color shading and percentages indicate the conditional probability of a contralateral event. Red dashed lines indicate iso-criteria performance as indicated. Gray dashed lines indicate iso-sensitivity performance for d’ = 0, 1, 2 and 3, from diagonal to upper left corner, respectively. See also Table S1.
Detailed inspection of these results revealed that some effects of striatal activation depended on the location of the visual stimulus, whereas other effects depended on the expected location of the visual event. Activation caused similar changes in hit rate and reaction time when the visual event was located in the contralateral visual field regardless of whether the conditional probability was 100% or 50% (Figure 2B–C, ‘contra events’), indicating that these effects depended on the location of the visual stimulus. However, other effects were not explained by the actual visual stimulus but depended on the expected location. For example, the changes in hit rate when the visual event was located in the ipsilateral visual field tended to be larger when the conditional probability was 50% versus 0% (Figure 2B, ‘ipsi events’), even though the visual stimulation was identical across these two conditions. Similarly, the already noted increases in false alarms (Figure 2A) were strongly dependent on the conditional probability, even though the visual conditions were the same across all three trial types. The interaction between the actual and expected location was not strictly additive – for example, in the 50% probability condition we did not find significant differences between the ipsilateral and contralateral stimulus locations. There was also substantial variability in these effects across individual mice, especially for reaction time. Nonetheless, the overall pattern of results suggests that lateralized circuits through the basal ganglia are linked to both the processing of visual signals and the application of spatial expectations during the attention task.
To better visualize the changes in response accuracy caused by striatal activation, we borrowed techniques from signal detection theory [12] and considered how these changes in hits and false alarms mapped onto changes in sensitivity and criterion (Figure 2D). As shown by the receiver operating characteristic (ROC) plot, the primary effect of activating striatal neurons was to shift the decision criterion toward more negative (i.e., less conservative) values, and the amplitude of this shift depended on the conditional probability of a contralateral event. When this probability was 100%, the criterion shifted from a conservative value of +0.32 to a much more lenient value of −0.54. When the probability was lower, the shifts in criterion were significantly smaller (p = 0.007, two-way ANOVA, interaction term with factors of cueing-condition and spatial-location). In addition to these systematic effects on criterion, there were also small reductions in sensitivity in all conditions, presumably due to smaller off-target effects of the optogenetic activation [13] and the facilitation of signals not normally included in task performance.
In a set of control experiments, we verified that these effects of striatal activation were specifically linked to the performance of the attention task, and not explained by other non-specific factors. First, activation of the striatum did not simply increase the tendency to lick, because there were minimal effects when spatial attention was not allocated. In trials interleaved with the normal orientation-change detection task, we matched the timing and duration of the attention-task trials, and used the same parameters for activating the striatum, but the mice were not shown the Gabor patches from the attention task (Figure 3A). Under these conditions, with no visual stimuli to attend, striatal activation had minimal effects – the frequency of licks was not different from zero (Figure 3B, 1.8 ± 1.7%, p = 0.06, one-sample t-test) and markedly lower than the 19-47% found with striatal activation on catch trials (i.e., false alarms) during the attention task (p < 10−4, contralateral catch trials, paired sample t-test; p = 0.0023, ipsilateral). Second, our results were not an artifact of blue light stimulation in the striatum but required activation of direct-pathway medium spiny neurons. We repeated the experiments in a set of YFP control mice (that expressed virus but not ChR2) and found no effects of optical stimulation on false alarms, hit rates or reaction times (Figure 3C–E). Finally, our results cannot be explained by differences in running speed, because there were no differences in running speeds across any of the different probability conditions (p = 0.53, one-way ANOVA) or in changes of running speed caused by striatal activation across trial types (p = 0.35). Together, these control experiments confirm that our main findings were specific to activation of the direct pathway during performance of the attention task.
Figure 3. Effects of striatal activation were specific to the attention task and required optogenetic activation of direct-pathway neurons.
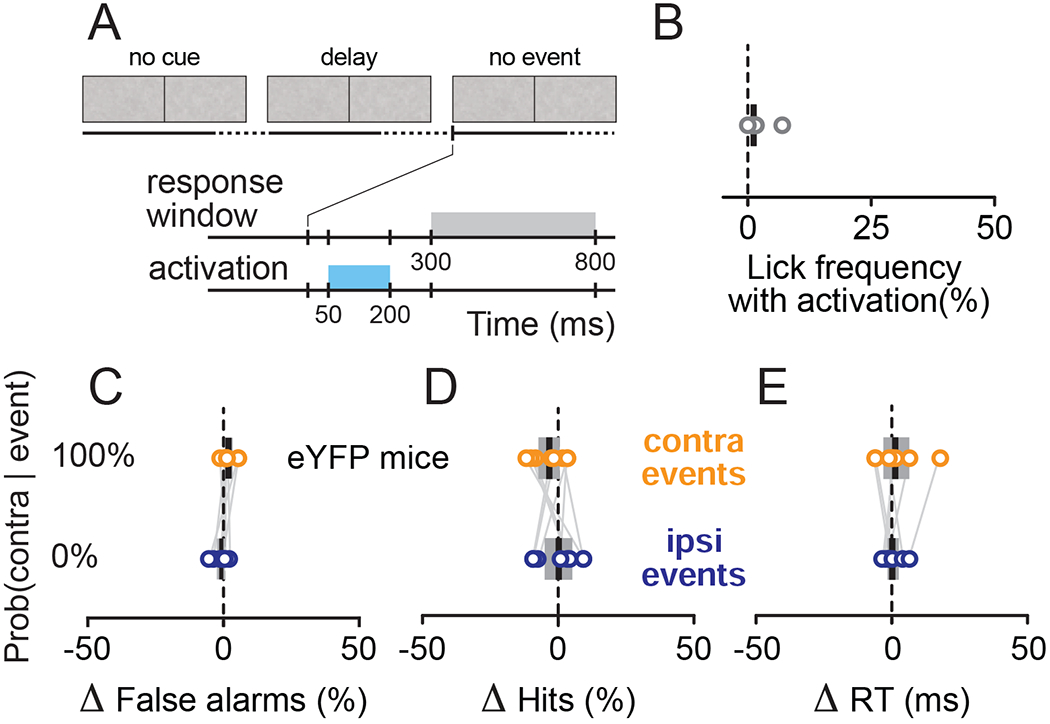
(A-B) Control showing that effects were specific to the attention task. (A) Timeline of the task epochs and events during control trials with striatal activation but without allocation of spatial attention. The parameters for the response window and optogenetic stimulation were the same as for the main results in Figure 2, including the timing of the activation, but the mouse was not shown the Gabor patches used in the attention trials. (B) The lick frequency produced by striatal activation on trials without spatial attention was not significantly different from zero. Note that unlike other plots, the values here are absolute lick frequency. (C-E). Control showing that optical stimulation in YFP mice did not cause changes in performance during the attention task. In contrast to the results in Figure 2, stimulation of YFP control mice produced no changes in false alarm rates (C, p = 0.10, paired sample t-test), hit rates (D, p = 0.43), or reaction times (E, p = 0.74, Wilcoxon signed rank test).
Discussion
Our results demonstrate that activity in the direct pathway of the dorsomedial striatum is linked to the allocation of visual spatial attention in mice. We established this link by comparing performance with and without striatal activation across different spatial cueing conditions in mice performing a visual detection task. The task itself involved a challenging threshold-level visual change, and we confirmed that the cueing conditions manipulated the allocation of spatial attention. The effects of striatal activation varied across task conditions in two different ways. Some effects of striatal activation depended on the location of the visual event detected in the attention task, indicating that striatal activity interacted with the visual signals needed to correctly detect the visual event. However, other effects depended on the subject’s expectations about the visual event, resulting in larger effects when the probability of a contralateral event was higher – even when the visual conditions were identical. Thus, striatal activity was linked to two aspects of visual spatial attention – the processing of the visual signals that guide the response, and also the spatial expectations prompted by the cueing conditions.
These findings are consistent with the idea that the basal ganglia control the level of commitment to particular motor or cognitive outcomes based on the behavioral context [3, 4], and that this functional role also applies to the allocation of visual spatial attention. Specifically, activity in the direct pathway of the dorsal striatum may be linked to the level of commitment to process particular visual signals based on the subject’s spatial expectations during the task. In the detection task we used, these differences in the level of commitment were revealed primarily as shifts in the subject’s decision criterion, a quantity from signal detection theory [12] that has been described as a distinct component of visual selective attention [5] and previously associated with circuits through the basal ganglia [1, 11, 14]. However, we would caution against drawing overly broad conclusions about how theoretical components of behavior map onto individual brain structures, because behavior depends on the complex interactions across many structures, and their individual contributions depend on the details of the task. When subjects are asked to rapidly detect a visual change, as in our task, it makes sense that changes in the level of commitment would appear as a simple shift in the decision criterion. However, if subjects are asked to integrate visual information over time, changes in the level of commitment might appear as differences in the rate of evidence accumulation [15, 16], because the delayed perceptual choice would incorporate the cumulative effect of the level of commitment applied over time.
There are multiple possible output circuits that could be involved in these effects on visual spatial attention. Some of these circuits would suggest that the basal ganglia play a permissive role in attention – regulating how sensory signals are coupled to behavior but not altering the quality of visual processing done in the visual cortex [17]. For example, as suggested by the schematic diagram in Figure 1C, the output of the direct pathway could interact with structures targeted by the basal ganglia, such as the superior colliculus, that receive their own visual and cognitive inputs from cortex; the degree of disinhibition of the target structure would be related to the level of commitment. These visual or cognitive signals could also be transmitted directly through the basal ganglia, which might be needed to control the degree of disinhibition appropriately for the current state of attention. For practical reasons, in our experiments this control was a matter of contralateral versus ipsilateral visual field, but the same principle could apply to more complex examples of selective attention that would require more complex patterns of disinhibition. Future experiments might also target these visual and cognitive signals for causal manipulations to clarify how they interact during task performance.
In addition, there are also circuits through which the basal ganglia could affect the quality of visual processing. For example, a pathway through the basal ganglia to the thalamic reticular nucleus has been implicated in suppressing signals from sensory modalities that are not relevant to the current task context [18]. These thalamic circuits might not be necessary for a simple detection task like ours but could be important when switching between sensory modalities or when visual information needs to be selectively accumulated over a sequence of stimulus events.
Given the variety of possible circuit mechanisms involved, and the nonlinear integration of sensory and other inputs in the striatum [9], it is perhaps not surprising that the interaction between actual and expected stimulus location in our results was not always straightforward, and that these effects varied across individual mice; these differences might be related to the particular strategies adopted by each mouse. Although many details remain unclear, by implicating the striatal direct pathway in the control of visual attention in mice, our results open up new avenues for understanding how attention incorporates the mechanisms of reinforcement learning and value-based decision-making in the basal ganglia [1, 19], along with mechanisms of sensory enhancement in visual cortex [17].
STAR Methods
RESOURCE AVAILABILITY
Lead contact
Further information and requests for resources should be directed to and will be fulfilled by the Lead Contact, Richard J. Krauzlis (Richard.krauzlis@nih.gov)
Materials Availability
This study did not generate unique materials or reagents.
Data and Code Availability
The data sets used to generate the figures have been deposited to Mendeley Data: http://dx.doi.org/10.17632/48sfzk7z5f.1
Additional raw data and code are available upon request.
EXPERIMENTAL MODEL AND SUBJECT DETAILS
Animals
Results were obtained from 16 mice from two GENSAT BAC-mediated transgenic lines: Drd1a-Cre, (B6.FVB(Cg)-Tg(Drd1a-cre)EY217Gsat/Mmucd; MMRRC #034258-UCD) (n=10), and A2a-Cre, (B6.FVB(Cg)-Tg(Adora2a-cre)KG139Gsat/Mmucd; MMRRC #036158-UCD) (n=6). The main results were from Drd1a-Cre mice (n=8) expressing ChR2-eYFP in the striatum. For the blue-light control experiments, the results were from mice expressing eYFP in the striatum, using 2 Drd1a-Cre and 6 A2a-Cre mice. Mice from these transgenic lines had been backcrossed with C57BL/6J (Jackson Laboratory, Bar Harbor, ME) for at least two generations after establishment of the colonies. Mice were derived from heterozygotes mated with wild-type C57BL/6J mice, producing heterozygotes and wild-type littermates. All the animals used in the study were heterozygotes. Among the 10 Drd1a mice used in the paper, 6 were males and 4 were females. Among the 6 A2a mice, 3 were males and 3 were females. We did not observe any systematic difference in behavioral performance between sexes in this study. The mice were housed in a 12:12 reversed day-night cycle, with lights off at 9 am, and all experimental procedures and behavioral training were done in the lights-off portion of the cycle (9am-9pm). Male and female mice weighing 18-25 grams were surgically implanted at age 6-8 weeks and then used in experiments for up to ~9 months. All the mice were in group housing (2-4 cage mates) prior to the surgical procedure, and subsequently singly housed after the implant surgery. All experimental and animal husbandry procedures were approved by the NIH Institutional Animal Care and Use Committee (IACUC) and complied with Public Health Service policy on the humane care and use of laboratory animals.
Viral vectors
Double-floxed inverted orientation (DIO) recombinant Adeno-associated viral vector (AAV) was used to express light-gated channel channelrhodopsin (hChR2(H134R)-eYFP) or the enhanced yellow fluorescent protein (eYFP) in Cre-expressing direct pathway medium spiny neurons in the dorsomedial striatum. The double-floxed reverse hChR2-eYFP or eYFP cassette was driven with an EF-1a promoter and WPRE to enhance expression. The recombinant AAV vector was serotyped with AAV2 coat proteins and packaged by the University of North Carolina viral core (titer of 4×10¹² particles/ml).
METHOD DETAILS
Stereotaxic surgery
Each mouse was surgically implanted with a head-holder. During the surgery, animals were anesthetized with isoflurane (4% induction, 0.8-1.5% maintenance) and secured by a stereotaxic frame with ear bars (Kopf Instruments). Dexamethasone (1.6 mg/kg) was administered to reduce inflammation. A feedback-controlled heating pad (FHC) was used to maintain the body temperature at 37°C, and artificial tears were applied to the eyes to prevent them from drying. After the animal’s head was leveled in the stereotaxic frame, a scalp incision was made along the midline to expose the skull, followed by a small craniotomy for virus injection and optic fiber implantation. The coordinates for the unilateral virus injection were ±1.8~2.5mm from midline (M-L axis), 0~0.5mm from Bregma (A-P axis) and 2.5-3mm ventral (D-V axis), based on a standard mouse brain atlas. Each mouse was injected with 0.2-0.3 microliter of virus at a flow rate of 50 nl/min, using a manual microinjector (Sutter Instrument) with 30μm-tip pulled glass pipettes. An optic fiber (200μm core) together with its ceramic ferrule base (Plexon Inc.) were subsequently inserted at the injection coordinates with the fiber tip located at 0.3~0.5mm above the injection center. A custom-designed titanium head post was positioned and secured to the skull using Metabond (Parkell Inc.). The skin wound edge was then closed with sutures or tissue adhesive (3M Vetbond). After surgery, mice received subcutaneous ketoprofen (1.85mg/kg) daily for up to three days to ease discomfort. The mice in this study also provided data for another study that involved optogenetic stimulation of the striatum during a visual detection task that did not explicitly manipulate visual spatial attention [11].
Food control
After mice recovered from surgery and returned to above 95% of their pre-surgery weight (typically within 7-9 days), they were placed on a food-control schedule. Mice had free access to water, but their intake of dry food was controlled, and they were allowed to augment their dietary intake by access to a nutritionally complete 8% soy-based infant formula (Similac, Abbott, IL). Overall food intake was regulated to maintain at least 85% of their free-feeding body weight, and the health status of each mice was monitored daily throughout the study. Mice were initially acclimatized to handling procedures by having their heads gently restrained while receiving the soy-based fluid under manual control via a sipper tube. After the initial exposure to soy-based fluid, we more securely head-fixed the animal and continued manual delivery. Once mice were adapted to these procedures, we switched to automatic delivery of fluid under computer control in the behavioral apparatus.
Behavioral apparatus
The behavioral apparatus consisted of a custom-built booth that displayed visual stimuli to the mouse coupled to their locomotion [20]. The mouse was head-fixed in the center of the apparatus, positioned atop a polystyrene foam wheel (20-cm diameter) that allowed natural walking or running movements along a linear path. An optical encoder (Kübler) was used to measure the rotation of the wheel and running speed. The front walls of the booth incorporated a pair of LCD displays (ViewSonic VG2439) positioned at 45° angles from the animal’s midline such that each display was centered on either the right or left eye and subtended ~90° horizontal by ~55° vertical of the visual hemifield, with a viewing distance of 27.5 cm. The interior of the booth was lined with sound absorbent material to reduce acoustic noise.
The experiments were controlled by a computer using a modified version of the PLDAPS system [21]. Our system omitted the Plexon device, but included a Datapixx peripheral (Vpixx Technologies, Saint-Bruno, QC, Canada) and the Psychophysics Toolbox extensions [22, 23] for Matlab (The Mathworks, Natick, MA, USA), controlled by Matlab-based routines run on a Mac Pro (Apple, Cupertino, CA, USA). The Datapixx device provided autonomously timed control over analog and digital inputs and outputs and synchronized the display of visual stimuli generated using the Psychophysics Toolbox.
A reward delivery spout was positioned near the snout of the mouse; lick contacts with the spout were detected by a piezo sensor (Mide Technology Co., Medford, MA, USA) and custom electronics. Each reward was a small volume (5-10 μl) of an 8% solution of soy-based infant formula (Similac, Abbott, IL) delivered by a peristaltic pump (Harvard Apparatus) under computer and Datapixx control. Air puff aversive stimuli were delivered through a second spout located slightly above the reward spout, and controlled through solenoids (Parker Hannifin, Cleveland, OH, USA). The temperature inside the apparatus maintained between 70-80° F.
Visual detection tasks with spatial cueing to manipulate allocation of spatial attention
Experiments were organized in blocks of randomly shuffled, interleaved trials, and each trial consisted of a sequence of epochs that the mouse passed through by walking or running on the wheel. Each epoch was defined by the particular stimuli presented on the visual displays, and the duration of each epoch was determined by the time that it took for the mouse to travel a randomized distance on the wheel. The typical running speed of the mice in our experiments was 90 cm/s (median: 90.2 cm/s, range across mice: 59.2 to 127.2 cm/s), and a typical trial lasted several seconds. Animals were run in experiments on alternating days and each session produced 300-800 trials.
Each attention task trial followed a standard sequence of four epochs. The average luminance across each visual display in all epochs was 4-8 cd/m2. In the first epoch (“noise”, not shown), the uniform gray of the inter-trial interval was changed to pink visual noise with an RMS contrast of 3.3%; this epoch was presented for a distance of 1.0-2.0 cm (range of time: 0.02-0.03 s). In the second epoch (“cue”), on cued trials a vertically oriented Gabor patch was added to the pink noise, centered in either the left or right visual display.
The Gabor patch consisted of a sinusoidal grating (95% Michelson contrast) with a spatial frequency of 0.1 cycles per degree, a value chosen based on the visual spatial acuity of mice, modulated by a Gaussian envelope with full width at half-maximum of 18° (σ = 7.5°). The phase of the grating was not fixed, but throughout the trial was incremented in proportion to the wheel rotation with every monitor refresh, so that the sinusoidal pattern was displaced on the screen by approximately the same distance that the mouse traveled on the wheel; the Gabor patch on the left (right) drifted leftward (rightward), consistent with optic flow during locomotion. This second epoch lasted for 46-92 cm (0.36-1.55 s). On no-cue trials, no Gabor was added during the second epoch, but the otherwise the timing was the same. In the third epoch (“delay”), a second Gabor patch (or both Gabor patches, for no-cue trials) with the same properties appeared on the other side of the visual display, and this epoch lasted for 107-214 cm (0.84-3.6 s). The visual stimuli in the fourth epoch (“visual event”) depended on whether or not the trial included an orientation change. If the trial contained an orientation change, the cued Gabor patch changed its orientation at the onset of the visual-event epoch; on no-cue trials, either one of the two Gabor patches changed its orientation with equal probability. The amplitude of the orientation change was always 9°. If the trial did not contain an orientation change, the two Gabor patches did not change their orientation, so that the “visual-event” epoch unfolded as a seamless extension of the previous delay epoch. In every experiment, the cue was always 100% valid, but change and no-change trials were always interleaved, and the probability of a change on any given trial was 50%.
The task of the mouse was to lick the spout when he or she detected a change in the orientation of the Gabor patch and to otherwise withhold from licking. Mice were required to lick within a 500-ms response window starting 300 ms after the orientation change in order to score a “hit” and receive a fluid reward. Licks before the response window led to immediate trial aborts, which were excluded from further analysis; well-trained mice aborted very few trials (<5%), regardless of trial types. The initial 300ms no-lick period after the orientation change was applied to most mice, except for a few mice that had faster reaction times, for whom the response window was shifted earlier by 50 ms. If the mouse failed to lick within the response window after an orientation change, the trial was scored as a “miss” and no reward was given but no other penalty was applied. On “no Δ” trials, if the mouse licked within the same response window aligned on the transition to epoch 4, the trial was scored as a “false alarm”, which led to timeouts and possible air-puff penalties; if they correctly withheld from licking throughout the entire “visual-event” epoch, the trial was scored as a “correct reject”. At the end of correct reject trials, the trial was extended to include an additional “safety-net epoch” in which the cue Gabor underwent a supra-threshold (30°) orientation change and the mouse could receive a reward by licking within a comparable response window. The point of this safety-net epoch was to maintain motivation by rewarding the mouse for correct behavior without violating the task rule that they should lick only for orientation changes. Responses in safety-net epoch were not used for any analysis in the study. Attention task experiments were organized as blocks of trials with a structure identical to that in the spatial attention task previously described as “cue versus no cue” [6], but with the block conditions redefined based on our target site in the striatum. Each block contained 160 trials, subdivided into 40 contralateral-cue trials (i.e., contralateral to our target site in the striatum), 40 ipsilateral-cue trials, and 80 no-cue trials. The 40 contralateral-cue and 40 ipsilateral-cue trials were run back to back, with the order of the two sub-blocks randomly determined. The block of 80 no-cue trials were run either before or after the 80 (i.e., 40 plus 40) cue trials, based on a coin flip. Of all trial types, 50% were with striatal optogenetic stimulation, randomly interleaved with no stimulation trials. During a daily session, mice typically completed several (2-5) blocks of 160 trials (i.e., 320-800 trials total).
We verified that mice were able to use the information provided by spatial cues to improve their normal task performance in the absence of optogenetic stimulation, consistent with previous results [6].
Control behavioral experiments
One set of control experiments included “no spatial attention” trials in which there were no Gabor patches or spatial cues to prompt the allocation of spatial attention. In these control experiments (in Figure 3 A–B), the block length was 55 trials, and 40 of these trials followed the standard 4-epoch trial sequence: 10 with a 12° change and no stimulation, 10 with a 12° change and stimulation, 10 with no change and no stimulation, and 10 with no change and stimulation. For the remaining trials, the progression of task epochs and events was halted before the spatial cue or two Gabor patches were presented; in particular, 5 stopped at the gray background, 5 stopped at visual pink noise, and the remaining 5 stopped with one Gabor patch shown. For the purposes of testing whether striatal activation caused a nonspecific increase in lick frequency, we focused on the trials with visual pink noise, although nearly identical results were also found with gray background. The overall length and the timing of striatal activation on these “no spatial attention” trials were matched to that on the normal visual attention trials. Because there was no opportunity for mice to earn rewards on these control trials, their fraction was kept low (15/55, 27%) to avoid losing motivation. We recorded 3-6 sessions in these experiments for each mouse to obtain at least 60 repetitions for each of the three types sequence-arrested trials.
A second set of control experiments tested the effects of blue light stimulation in the striatum without the expression of ChR2. The data reported in the paper were part of a larger data set collected to test the effects of blue light stimulation on psychometric curves in control mice expressing eYFP but not ChR2 in the striatum. We used a block length of 40 trials all including a spatial cue: 25% with no change and no stimulation, 25% with no change and stimulation, 25% with an orientation change drawn equally from five possible values (4, 7, 11, 15, 20°) and with no stimulation, and 25% with the same five orientation changes with stimulation. We recorded 7-9 sessions for each mouse to obtain at least 60 repetitions for each of the five orientation changes. For the data analyzed and presented in the paper, behavioral performance for the near-threshold orientation change (7°) was used to quantify the effect of blue light stimulation in the striatum (same light intensity as for ChR2-eYFP experiments) on hit rates and reaction time, and performance for the no-change condition was used to assess the stimulation effect on false alarms.
Histology
Mice were euthanized with CO2 (1.0 LPM), after which they were transcardially perfused with ice-cold saline followed by phosphate buffered saline with 4% paraformaldehyde (PFA). Their brains were carefully removed and stored in the 4% PFA solution overnight, before they were transferred to the phosphate buffered saline with 20% sucrose solution for at least three days prior to sectioning. 50 μm frozen sections were cut in the coronal or sagittal plane using a freezing microtome, free-floating sections were processed for immunohistochemical labeling of GFP mounted on gelatin-coated glass slide and counterstained with a fluorescent blue counterstain. To visualize the injection site and axonal projections from viral transfected cells sections were imaged at 10× using a Zeiss fluorescent microscope using Neurolucida software (MBF Biosciences, Williston, VT) to produce a whole brain reconstruction from tiled images of coronal or sagittal sections.
QUANTIFICATION AND STATISTICAL ANALYSIS
All of the data were acquired and initially processed using custom scripts written in Matlab (The Mathworks, Natick, MA, USA).
Analysis of attention task performance
Results were pooled across attention task sessions for each mouse to tabulate the overall lick frequency with and without striatal activation for change and no-change trials. Trial data were divided according to whether the change (or possible change) occurred in the visual field on the same side as the activation site in the striatum (ipsilateral) or the opposite side (contralateral). Performance was then characterized by measuring sensitivity (d’) and criterion using methods from signal detection theory [12], as follows: d’ = Φ−1 (H) – Φ−1 (F), criterion = − (Φ−1 (H) + Φ−1 (F)/2, where Φ−1 is the inverse of normal cumulative distribution function, H is the hit rate and F is the false alarm rate. The 95% confidence intervals of d’ and criterion were generated with bootstrapped resampling.
Analysis of running speed
To compare running speed across different cueing conditions in the attention task, the mean running speed in the 500-ms interval before the change epoch onset was calculated for each trial. For each individual mouse, we then pooled data to calculate mean running speed of the three trial types: contralateral cued, ipsilateral cued and no-cue.
To quantify the effect of striatal activation on running speed, we used stimulation during the noise epoch of the “no spatial attention” control experiments to avoid confounds introduced by changes in behavior following stimulation during the attention task. In both cases, the effect of stimulation on running speed was summarized as the difference in speed between the baseline (mean in the 50-ms interval before stimulation) and the post-stimulation running speed (mean in the interval 50-100 ms after the stimulation offset). The stimulation effect on running speed was compared between trials in contralateral cued blocks and ipsilateral cued blocks.
Statistics
Statistical analyses were conducted in Matlab using the statistics toolbox, and statistical significance was accepted for p<0.05. Interaction terms of two-way ANOVAs were used to assess the effects of cueing conditions and their interaction with spatial locations (left vs right) of orientation change on direct pathway activation induced shifts in criterion. A one-way ANOVA was used to assess the effect of conditional probability of contralateral event on striatal activation-induced changes in false alarm and hit rates. A one-way ANOVA was also used to assess the effect of conditional probability of contralateral event on running speed. Non-parametric paired sample Kruskal-Wallis tests were used to assess the effect of conditional probability of contralateral event on changes in reaction time with striatal activation. Post hoc multiple comparisons with Bonferoni correction after one-way ANOVA or Kruskal-Wallis test were used to assess the differences of activation-induced changes in performance found with different conditional probabilities.
For the control analyses, one sample t-tests were used to assess whether the striatal activation-induced lick rates during the “no spatial attention” control trials were different from zero. Paired sample Wilcoxon signed rank tests were used to assess the effect of spatial cue location on stimulation-induced changes in reaction time of eYFP control mice for the “blue light stimulation” controls. All other comparisons were done using paired sample t-tests unless otherwise indicated. Error bars in figures indicate 95% confidence interval of the median or mean, unless indicated otherwise.
Supplementary Material
Highlights.
Activating basal ganglia direct pathway alters visual attention task performance
Effects depend on how much attention is allocated to the contralateral visual field
Some changes in behavior are linked to the lateralized processing of visual signals
Other effects depend on the spatial expectations prompted by the spatial cues
Acknowledgments
The authors thank K. Rangarajan and K. McAlonan for help with mouse behavioral training, N. Nichols and T. Ruffner for technical support, and James Herman, Leor Katz, and Gongchen Yu for helpful discussions. This work was supported by the National Eye Institute Intramural Research Program at the National Institutes of Health (ZIA EY000511).
Footnotes
Publisher's Disclaimer: This is a PDF file of an unedited manuscript that has been accepted for publication. As a service to our customers we are providing this early version of the manuscript. The manuscript will undergo copyediting, typesetting, and review of the resulting proof before it is published in its final form. Please note that during the production process errors may be discovered which could affect the content, and all legal disclaimers that apply to the journal pertain.
Declaration of Interests
The authors declare no competing interests.
References
- 1.Ding L, and Gold JI (2013). The Basal Ganglia’s Contributions to Perceptual Decision Making. Neuron 79, 640–649. [DOI] [PMC free article] [PubMed] [Google Scholar]
- 2.Park J, Coddington LT, and Dudman JT (2020). Basal Ganglia Circuits for Action Specification. Annu Rev Neurosci 43, 485–507. [DOI] [PubMed] [Google Scholar]
- 3.Thura D, and Cisek P (2017). The Basal Ganglia Do Not Select Reach Targets but Control the Urgency of Commitment. Neuron 95, 1160–1170.e5. [DOI] [PubMed] [Google Scholar]
- 4.Turner RS, and Desmurget M (2010). Basal ganglia contributions to motor control: a vigorous tutor. Curr Opin Neurobiol 20, 704–716. [DOI] [PMC free article] [PubMed] [Google Scholar]
- 5.Luo TZ, and Maunsell JHR (2019). Attention can be subdivided into neurobiological components corresponding to distinct behavioral effects. Proc Natl Acad Sci USA 116, 26187–26194. [DOI] [PMC free article] [PubMed] [Google Scholar]
- 6.Wang L, and Krauzlis RJ (2018). Visual Selective Attention in Mice. Curr Biol 28, 676–685.e4. [DOI] [PMC free article] [PubMed] [Google Scholar]
- 7.Vicente AM, Galvão-Ferreira P, Tecuapetla F, and Costa RM (2016). Direct and indirect dorsolateral striatum pathways reinforce different action strategies. Curr Biol 26, R267–9. [DOI] [PMC free article] [PubMed] [Google Scholar]
- 8.Kravitz AV, Freeze BS, Parker PRL, Kay K, Thwin MT, Deisseroth K, and Kreitzer AC (2010). Regulation of parkinsonian motor behaviours by optogenetic control of basal ganglia circuitry. Nature 466, 622–626. [DOI] [PMC free article] [PubMed] [Google Scholar]
- 9.Reig R, and Silberberg G (2014). Multisensory integration in the mouse striatum. Neuron 83, 1200–1212. [DOI] [PMC free article] [PubMed] [Google Scholar]
- 10.Hintiryan H, Foster NN, Bowman I, Bay M, Song MY, Gou L, Yamashita S, Bienkowski MS, Zingg B, Zhu M, et al. (2016). The mouse cortico-striatal projectome. Nat Neurosci 19, 1100–1114. Available at: http://www.nature.eom/doifinder/10.1038/nn.4332. [DOI] [PMC free article] [PubMed] [Google Scholar]
- 11.Wang L, Rangarajan KV, Gerfen CR, and Krauzlis RJ (2018). Activation of Striatal Neurons Causes a Perceptual Decision Bias during Visual Change Detection in Mice. Neuron 97, 1369–1381.e5. [DOI] [PMC free article] [PubMed] [Google Scholar]
- 12.Macmillan NA, and Creelman CD (2005). Detection Theory: A User’s Guide Second Edition. (Lawrence Erlbaum Associates).
- 13.Otchy TM, Wolff SBE, Rhee JY, Pehlevan C, Kawai R, Kempf A, Gobes SMH, and Ölveczky BP (2015). Acute off-target effects of neural circuit manipulations. Nature 528, 358–363. [DOI] [PubMed] [Google Scholar]
- 14.Crapse TB, Lau H, and Basso MA (2018). A Role for the Superior Colliculus in Decision Criteria. Neuron 97, 181–194.e6. [DOI] [PMC free article] [PubMed] [Google Scholar]
- 15.Yartsev MM, Hanks TD, Yoon AM, and Brody CD (2018). Causal contribution and dynamical encoding in the striatum during evidence accumulation. Elife 7, 357. [DOI] [PMC free article] [PubMed] [Google Scholar]
- 16.Ding L, and Gold JI (2010). Caudate encodes multiple computations for perceptual decisions. 30, 15747–15759. [DOI] [PMC free article] [PubMed] [Google Scholar]
- 17.Speed A, Del Rosario J, Mikail N, and Haider B (2020). Spatial attention enhances network, cellular and subthreshold responses in mouse visual cortex. Nat Commun 11, 505–11. [DOI] [PMC free article] [PubMed] [Google Scholar]
- 18.Nakajima M, Schmitt LI, and Halassa MM (2019). Prefrontal Cortex Regulates Sensory Filtering through a Basal Ganglia-to-Thalamus Pathway. Neuron 103, 445–458.e10. [DOI] [PMC free article] [PubMed] [Google Scholar]
- 19.Krauzlis RJ, Bollimunta A, Arcizet F, and Wang L (2014). Attention as an effect not a cause. Trends in Cognitive Sciences 18, 457–464. [DOI] [PMC free article] [PubMed] [Google Scholar]
- 20.Krauzlis RJ, Nichols N, Rangarajan KV, McAlonan K, Goldstein S, Yochelson D, and Wang L (2020). Visual Psychophysics in Head-Fixed Mice. Curr Protoc Neurosci 92, e95. [DOI] [PMC free article] [PubMed] [Google Scholar]
- 21.Eastman KM, and Huk AC (2012). PLDAPS: A Hardware Architecture and Software Toolbox for Neurophysiology Requiring Complex Visual Stimuli and Online Behavioral Control. Front Neuroinform 6, 1. [DOI] [PMC free article] [PubMed] [Google Scholar]
- 22.Brainard DH (1997). The Psychophysics Toolbox. Spat Vis 10, 433–436. [PubMed] [Google Scholar]
- 23.Pelli DG (1997). The VideoToolbox software for visual psychophysics: transforming numbers into movies. Spat Vis 10, 437–442. [PubMed] [Google Scholar]
Associated Data
This section collects any data citations, data availability statements, or supplementary materials included in this article.
Supplementary Materials
Data Availability Statement
The data sets used to generate the figures have been deposited to Mendeley Data: http://dx.doi.org/10.17632/48sfzk7z5f.1
Additional raw data and code are available upon request.