

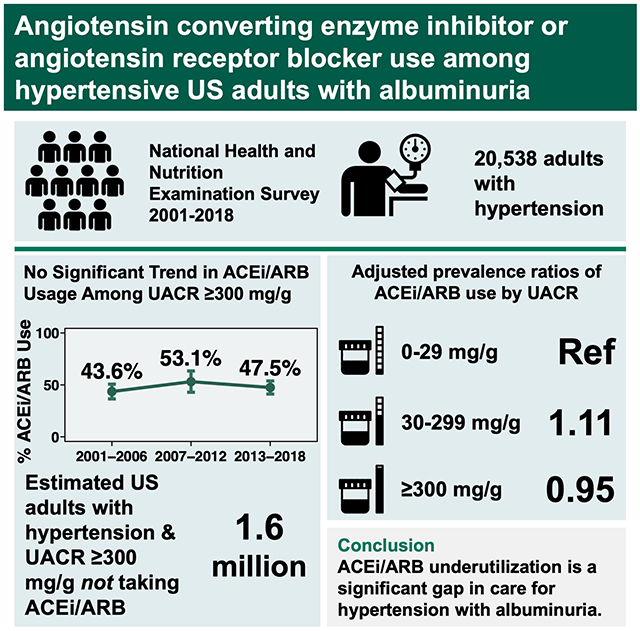
Abstract
Since 2003, US hypertension guidelines have recommended angiotensin converting enzyme inhibitors (ACEi) or angiotensin receptor blockers (ARB) as first-line antihypertensive therapy in the presence of albuminuria (urine albumin/creatinine ratio ≥300 mg/g). To examine national trends in guideline-concordant ACEi/ARB utilization, we studied adults participating in the National Health and Nutrition Examination Surveys 2001-2018 with hypertension (defined by self-report of high blood pressure, systolic blood pressure ≥140 mmHg or diastolic ≥90 mmHg, or use of antihypertensive medications). Among 20,538 included adults, prevalence of albuminuria ≥300 mg/g was 2.8% in 2001-2006, 2.8% in 2007-2012, and 3.2% in 2013-2018. Among those with albuminuria ≥300 mg/g, no consistent trends were observed for the proportion receiving ACEi/ARB treatment from 2001-2018 among persons with diabetes, without diabetes, or overall. In 2013-2018, ACEi/ARB usage in the setting of albuminuria ≥300 mg/g was 55.3% (95% CI; 46.8%-63.6%) among adults with diabetes and 33.4% (95% CI; 23.1%-45.5%) among those without diabetes. Based on US population counts, these estimates represent 1.6 million adults with albuminuria ≥300 mg/g currently not receiving ACEi/ARB therapy, nearly half of whom do not have diabetes. ACEi/ARB underutilization represents a significant gap in preventive care delivery for adults with hypertension and albuminuria that has not substantially changed over time.
Keywords: Hypertension, Albuminuria, Angiotensin-Converting Enzyme Inhibitors, Angiotensin Receptor Antagonists, Guideline Adherence
Graphical Abstract
Introduction
Albuminuria has strong prognostic significance for cardiovascular disease, chronic kidney disease (CKD) progression, and mortality, irrespective of etiology and independent of estimated glomerular filtration rate (eGFR).1–5 Angiotensin converting enzyme inhibitors (ACEi) and angiotensin receptor blockers (ARB) are mainstays of treatment for albuminuria shown to delay progression to end-stage kidney disease and reduce cardiovascular risk.6–9 US hypertension guidelines from the Joint National Commission (JNC) and subsequently the American College of Cardiology/American Heart Association (ACC/AHA) have consistently included recommendations for nearly 2 decades that hypertensive individuals with albuminuria be treated with ACEi or ARB therapy (Table S1). Specifically, the JNC 7 guidelines in 2003 recommended ACEi/ARB treatment for a urine albumin/creatinine ratio (UACR) >200 mg/g.10 In 2014, published guidelines from a group of JNC 8 panel members recommended ACEi/ARB treatment for adults with UACR >30 mg/g, and ACC/AHA guidelines in 2017 recommended ACEi/ARB treatment for UACR ≥300 mg/g.11,12
Adherence to these guidelines implies that UACR should be checked in patients with hypertension to guide treatment decisions. However, despite some evidence suggesting that screening for albuminuria is cost-effective in hypertension,13,14 there has not been clear consensus guidance on albuminuria testing for this population: the 2017 ACC/AHA hypertension guidelines list UACR as an “optional” test for patients with hypertension and do not provide a recommendation for monitoring intervals.12 Prior studies have shown that while overall ACEi/ARB use has increased over time, it remains low among persons with albuminuria.15–17 This may be because albuminuria testing is infrequently performed in the setting of hypertension, particularly when compared to diabetes,18 where by contrast, American Diabetes Association guidelines have consistently recommended annual UACR testing—recommendations that have been widely disseminated and implemented as a national quality (Healthcare Effectiveness Data and Information Set; HEDIS) measure.19,20
The objectives of this study were to assess the prevalence and trend of ACEi/ARB treatment among participants in the National Health and Nutrition Examination Survey (NHANES) with hypertension and albuminuria according to diabetes status; examine the gap in guideline-concordant ACEi/ARB treatment based on JNC and ACC/AHA recommendations for albuminuria; and explore associations between UACR and ACEi/ARB treatment to inform the development of interventions aimed at enhancing guideline-concordant care delivery for adults with hypertension.
Methods
Study Design
We conducted a series of cross-sectional analyses using NHANES, a national survey of non-institutionalized US residents continuously conducted since 1999 by the Centers for Disease Control and Prevention’s National Center for Health Statistics, with response rates of 79.6% in 2001-2002 and 48.8% in 2017-2018.21 All data and materials are publicly available on the National Center for Health Statistics website.22 NHANES consists of an interview component and an examination component, which includes physical examination and laboratory testing in a Mobile Examination Center (MEC). All participants provided informed consent; protocol approval was obtained from the National Center for Health Statistics Research Ethics Review Board.
Study Population
We examined data from NHANES years 2001-2018 (total n = 91,351). For our analytic population, we included nonpregnant adults age 18 years or older (n = 52,403) who underwent both interview and MEC components (n = 50,086), who had blood pressure measured (n = 47,722) and a random UACR testing performed (n = 46,757). Blood pressure was measured by trained study personnel using a standardized protocol requiring at least 5 minutes of a seated rest period prior to three blood pressure measurements; the mean systolic and mean diastolic blood pressures across all measurements were used for analysis.22 We included participants with hypertension (n = 20,561), defined by a mean systolic blood pressure (SBP) ≥140 mmHg, mean diastolic blood pressure (DBP) ≥90 mmHg, use of antihypertensive medication, or a “yes” answer to the question, “Have you ever been told by a doctor or other health professional that you had hypertension, also called high blood pressure?”. Finally, we excluded persons with missing prescription medication data (final n for analysis = 20,538).
Definitions
The exposure of interest was UACR ≥300 mg/g, the cutoff above which ACEi/ARB therapy would be recommended by all contemporaneous US hypertension guidelines since JNC 7.10–12 Diabetes was defined as a glycohemoglobin A1c ≥6.5% or by a “yes” to the question, “Other than during pregnancy, have you ever been told by a doctor or health professional that you have diabetes or sugar diabetes?”23 CKD stage was defined according to Kidney Disease: Improving Global Outcomes (KDIGO) classification based on estimated glomerular filtration rate (eGFR), calculated by the CKD-EPI equation.24,25 Self-reported characteristics included age, sex, race/ethnicity (non-Hispanic White, non-Hispanic Black, Other), health insurance (y/n), routine site for healthcare (y/n), educational attainment of high school or greater (y/n), current tobacco use (y/n), heart failure (y/n), and coronary heart disease (y/n). Obesity was defined as body mass index (BMI) ≥30 kg/m2, based on measured height and weight.
Use of ACEi or ARB medications was ascertained during medication review during which participants were asked to show to study staff all medication containers for prescription medications they had taken within the last 30 days; medication names from container labels were directly matched to the Multum prescription drug database.26 ACEi/ARB use was defined as taking a medication within either class, including when taken as a component of a combination pill.
Statistical Analysis
Demographic and clinical characteristics for the included study population were examined by diabetes and UACR status. Over three consecutive six-year intervals (2001-2006, 2007-2012, and 2013-2018), we assessed the proportion of hypertensive adults with UACR ≥300 mg/g who were on ACEi/ARB therapy. The prevalence of ACEi/ARB use was estimated during each time interval, overall and by diabetes status. Temporal trends in age-adjusted ACEi/ARB use were assessed by fitting logistic regression models with time interval as a categorical predictor, and then using contrasts to test for linear trends in the corresponding coefficients.27
We then estimated the number of persons constituting the gap in guideline-concordant ACEi/ARB use by extrapolating the crude prevalence of hypertensive adults with UACR ≥300 not on ACEi/ARB therapy to the corresponding Current Population Survey estimates of the non-institutionalized civilian US population, as described by NHANES analytic guidelines.21,28 To further characterize this gap, we compared demographic and clinical characteristics of hypertensive adults with UACR ≥300 mg/g by ACEi/ARB treatment status using t tests for continuous variables and χ2 tests for categorical variables.
In a secondary analysis, we examined associations between albuminuria and ACEi/ARB treatment in the population of hypertensive adults in the latest time period, 2013-2018, stratified by diabetes status. Modified Poisson regression analysis was used to estimate unadjusted (Model 1) and adjusted prevalence ratios and 95% confidence intervals for the association between UACR (categorized as 0-29 mg/g, 30-299 mg/g, and ≥300 mg/g) and ACEi/ARB treatment.29 Analyses were adjusted for age, sex, and race/ethnicity (Model 2), and additionally for SBP and eGFR as continuous variables (Model 3). SBP was chosen given its strong association with albuminuria, relative to DBP.30 We tested for the presence of interaction between diabetes status and UACR. Because we did not find evidence of interaction (p = 0.20), we also performed an unstratified analysis, with diabetes status added to the adjustment set for Model 3.
All analyses were performed with Stata/IC 15.1 (StataCorp, College Station, TX, USA). All analyses were conducted accounting for NHANES survey weights, strata, and primary sampling units.
Sensitivity Analysis
Because of changing definitions for hypertension over time, we performed a sensitivity analysis using SBP ≥130 mmHg instead of 140 mmHg to define hypertension. In addition, because self-reported diagnosis of hypertension may not be reliable, we repeated our analysis using only SBP ≥140, DBP ≥90, or antihypertensive medication use to define hypertension.
Results
Population Characteristics
A total of 20,538 adults with hypertension were included in the analytic study population (5,860 in NHANES 2001-2006, 7,311 in NHANES 2007-2012, and 7,367 in NHANES 2013-2018). The prevalence of UACR ≥300 mg/g was 2.8% in 2001-2006, 2.8% in 2007-2012, and 3.2% in 2013-2018 (p = 0.38). Demographic and clinical characteristics of the study population are shown in Table 1. Irrespective of diabetes status, SBP was significantly higher among adults with UACR ≥300 mg/g compared to UACR <300 mg/g (149 mmHg versus 133 mmHg among adults without diabetes; 150 mmHg versus 132 mmHg among adults with diabetes; p <0.001 for both comparisons). The majority of adults with UACR ≥300 mg had SBP ≥140 mmHg (62.2% and 63.1% among adults without and with diabetes, respectively). Approximately half (52.6%) of adults with UACR ≥300 mg/g were taking two or more antihypertensive medications, although nearly a quarter (23.6%) were taking none. Compared to those with UACR <300 mg/g, adults with UACR ≥300 mg/g had greater use of beta blockers, calcium channel blockers, and loop diuretics (p <0.001 for all comparisons), while thiazide and potassium-sparing diuretic use was similar. Approximately half of adults with UACR ≥300 mg/g had an eGFR greater than 60 ml/min/1.73m2 (52.6% and 51.0% among adults without and with diabetes, respectively).
Table 1.
Characteristics of hypertensive US adults by diabetes and albuminuria status, NHANES 2001-2018
| Characteristic | No Diabetes | Diabetes | Overall | |||
|---|---|---|---|---|---|---|
| UACR <300 mg/g | UACR ≥300 mg/g | UACR <300 mg/g | UACR ≥300 mg/g | UACR <300 mg/g | UACR ≥300 mg/g | |
| n | 14,750 | 331 | 4,939 | 518 | 19,689 | 849 |
| Age in years, mean | 55.8 (0.2) | 60.4 (1.3) | 61.7 (0.3) | 62.7 (0.7) | 57.0 (0.2) | 61.7 (0.7) |
| Female (%) | 50.9 (0.5) | 46.7 (4.0) | 49.3 (1.0) | 40.9 (3.0) | 50.5 (0.4) | 43.3 (2.5) |
| Race/ethnicity (%) | ||||||
| Non-Hispanic white | 73.4 (1.2) | 58.6 (3.6) | 63.2 (1.6) | 52.5 (3.4) | 71.3 (1.2) | 55.2 (2.3) |
| Non-Hispanic Black | 12.0 (0.7) | 21.6 (2.5) | 16.1 (1.0) | 21.9 (2.2) | 12.8 (0.8) | 21.8 (1.7) |
| Other | 14.6 (0.8) | 19.9 (2.5) | 20.7 (1.2) | 25.4 (2.5) | 15.8 (0.8) | 23.0 (1.8) |
| Health insurance, any (%) | 88.0 (0.5) | 90.3 (2.1) | 90.9 (0.5) | 88.1 (2.1) | 88.6 (0.4) | 89.0 (1.4) |
| Routine site for healthcare (%) | 90.7 (0.3) | 94.1 (1.3) | 95.9 (0.5) | 90.9 (2.4) | 91.7 (0.3) | 92.3 (1.5) |
| High school education or above (%) | 82.7 (0.6) | 70.9 (3.4) | 75.4 (0.9) | 67.4 (2.4) | 81.2 (0.6) | 68.9 (1.9) |
| Current smoker (%) | 39.3 (0.8) | 44.6 (5.0) | 28.9 (1.1) | 32.1 (3.7) | 37.2 (0.7) | 37.4 (3.0) |
| Obesity (%) | 42.9 (0.6) | 38.8 (4.1) | 64.0 (1.1) | 64.3 (2.4) | 47.1 (0.6) | 53.6 (2.4) |
| Systolic BP (mmHg), mean | 133.3 (0.2) | 148.7 (1.9) | 132.4 (0.4) | 149.8 (1.5) | 133.1 (0.2) | 149.4 (1.2) |
| Diastolic BP (mmHg), mean | 74.2 (0.2) | 74.8 (1.2) | 69.2 (0.3) | 72.2 (1.2) | 73.2 (0.2) | 73.3 (0.8) |
| Systolic BP range (%) | ||||||
| <120 mmHg | 25.6 (0.6) | 14.2 (2.7) | 26.9 (1.0) | 12.4 (2.1) | 25.8 (0.5) | 13.2 (1.7) |
| 120-129 mmHg | 20.4 (0.5) | 11.5 (2.5) | 21.5 (0.8) | 9.3 (1.6) | 20.7 (0.4) | 10.2 (1.5) |
| 130-139 mmHg | 18.0 (0.4) | 12.1 (2.3) | 19.8 (0.8) | 15.3 (2.4) | 18.4 (0.4) | 13.9 (1.7) |
| ≥140 mmHg | 36.0 (0.6) | 62.2 (3.5) | 31.8 (1.0) | 63.1 (2.9) | 35.1 (0.6) | 62.7 (2.3) |
| Antihypertensive medication use (%) | ||||||
| ACEi or ARB | 34.0 (0.6) | 34.9 (3.4) | 66.7 (1.0) | 58.1 (2.9) | 40.7 (0.6) | 48.2 (2.3) |
| Beta blocker | 22.9 (0.5) | 34.3 (3.5) | 33.0 (1.1) | 45.0 (3.1) | 25.0 (0.5) | 40.4 (2.1) |
| Calcium channel blocker | 14.2 (0.4) | 32.3 (3.1) | 21.4 (0.9) | 34.0 (2.4) | 15.6 (0.4) | 33.3 (2.0) |
| Thiazide diuretic | 19.7 (0.5) | 16.3 (3.0) | 24.2 (0.8) | 19.8 (2.3) | 20.6 (0.5) | 18.3 (1.9) |
| Loop diuretic | 4.5 (0.2) | 15.2 (2.5) | 12.3 (0.6) | 24.7 (2.8) | 6.1 (0.2) | 20.6 (1.8) |
| Potassium-sparing diuretic | 4.8 (0.2) | 4.0 (1.5) | 5.0 (0.5) | 5.9 (1.4) | 4.8 (0.2) | 5.1 (1.0) |
| Number of antihypertensives (%) | ||||||
| 0 | 41.1 (0.7) | 30.9 (3.3) | 15.4 (0.8) | 18.1 (2.7) | 35.8 (0.6) | 23.6 (2.1) |
| 1 | 35.4 (0.5) | 27.4 (3.6) | 40.6 (1.0) | 21.3 (2.5) | 36.4 (0.5) | 23.9 (2.1) |
| 2 to 3 | 22.0 (0.6) | 34.1 (3.4) | 38.3 (1.0) | 42.4 (2.6) | 25.3 (0.5) | 38.9 (2.2) |
| ≥4 | 1.6 (0.1) | 7.6 (1.6) | 5.7 (0.5) | 18.2 (2.2) | 2.4 (0.2) | 13.7 (1.4) |
| eGFR (ml/min/1.73m2), mean | 86.3 (0.3) | 64.5 (2.6) | 81.9 (0.5) | 62.3 (2.1) | 85.4 (0.3) | 63.2 (1.7) |
| eGFR, ml/min/1.73m2 (%) | ||||||
| ≥90 | 45.2 (0.7) | 30.3 (3.8) | 40.3 (1.0) | 21.2 (2.9) | 44.2 (0.7) | 25.0 (2.5) |
| 60-89 | 43.3 (0.6) | 22.3 (3.3) | 40.6 (1.0) | 29.8 (3.2) | 42.7 (0.6) | 26.7 (2.4) |
| 45-59 | 8.2 (0.3) | 16.2 (2.7) | 12.1 (0.6) | 16.9 (2.6) | 9.0 (0.3) | 16.6 (1.8) |
| 30-44 | 2.8 (0.1) | 11.5 (2.0) | 5.2 (0.4) | 15.0 (2.1) | 3.3 (0.1) | 13.5 (1.5) |
| <30 | 0.6 (0.1) | 19.8 (3.0) | 1.7 (0.2) | 17.1 (2.4) | 0.8 (0.1) | 18.2 (1.7) |
| Coronary heart disease (%) | 6.1 (0.3) | 14.8 (2.8) | 13.1 (0.7) | 17.4 (2.5) | 7.6 (0.3) | 16.3 (1.8) |
| Heart failure (%) | 3.7 (0.2) | 12.3 (2.3) | 9.8 (0.6) | 18.1 (2.4) | 4.9 (0.2) | 15.6 (1.6) |
Reported figures are weighted for complex survey design used by NHANES to estimate nationally representative results. Standard errors for estimates are reported within parentheses. For categorical variables, column percentages are presented.
Abbreviations: BP = blood pressure; eGFR = estimated glomerular filtration rate; NHANES = National Health and Nutrition Examination Survey; UACR = urine albumin/creatinine ratio.
Trends in ACEi/ARB Use
From 2001-2018, overall ACEi/ARB usage among hypertensive adults with UACR ≥300 mg/g was stable (unadjusted proportions: 43.6%, 53.1%, and 47.5% respectively in 2001-2006, 2007-2012, and 2013-2018; ptrend = 0.41). Consistent trends in age-adjusted ACEi/ARB use were not observed overall or when stratified by diabetes status (Figure 1). In every time period, diabetes was associated with greater ACEi/ARB usage; in 2013-2018, unadjusted ACEi/ARB usage was 55.3% (95% CI; 46.8%-63.6%) among hypertensive adults with diabetes and 33.6% (95% CI; 23.4%-45.6%) among those without diabetes (p = 0.005). Extrapolated to the US population, these figures represent approximately 1.6 million adults who have UACR ≥300 mg/g and are not on ACEi/ARB therapy (approximately 870,000 adults with diabetes and 730,000 without diabetes).
Figure 1. Age-adjusted ACEi/ARB usage among hypertensive US adults with UACR ≥300 mg/g, overall and by diabetes status, NHANES 2001-2018 (n = 849).
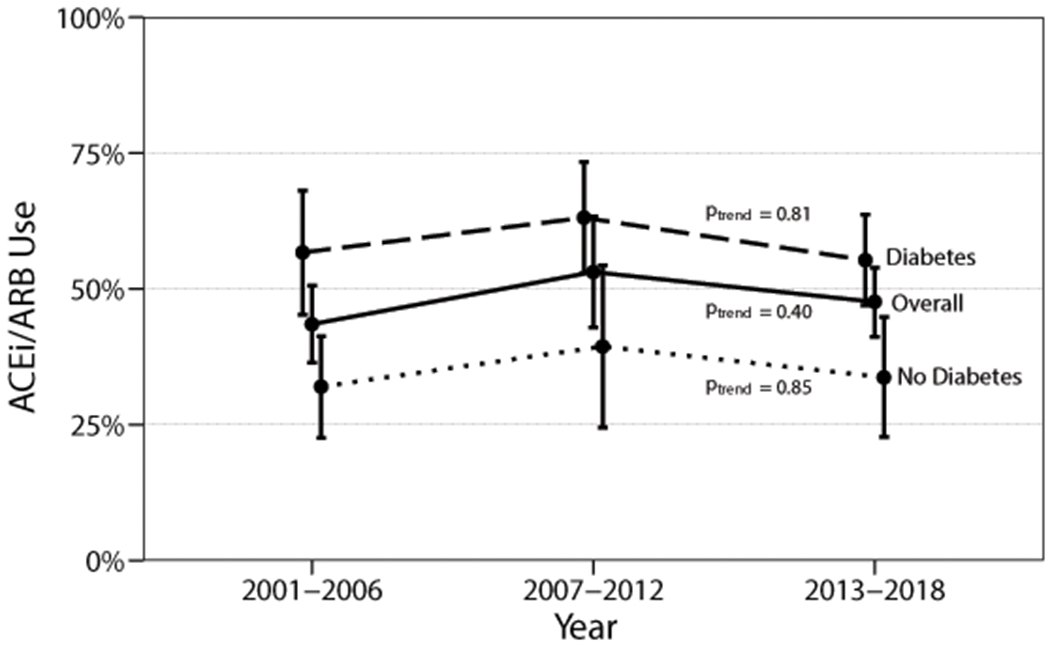
Abbreviations: ACEi = angiotensin converting enzyme inhibitor; ARB = angiotensin receptor blocker; NHANES = National Health and Nutrition Examination Survey; UACR = urine albumin/creatinine ratio.
Characteristics of Adults by ACEi/ARB Treatment Status
A comparison of characteristics of adults with UACR ≥300 mg/g by ACEi/ARB treatment status is shown in Table 2. Overall, the two groups were similar with respect to demographic and co-morbid characteristics (i.e., age, sex, race/ethnicity, SBP, heart failure, coronary heart disease) with the exception of diabetes status, DBP, and kidney function. ACEi/ARB users were more likely to have diabetes (69.1% versus 46.3%; p <0.001) than their counterparts not on ACEi/ARB treatment. Although mean eGFR was similar between ACEi/ARB users and non-users, the distribution was notably different: most ACEi/ARB users had eGFR in the 30-89 ml/min/1.73m2 range; ACEi/ARB users were less likely to have eGFR <30 or ≥90 ml/min/1.73m2.
Table 2.
Characteristics of Hypertensive US Adults with UACR ≥300 mg/g by ACEi/ARB Use
| Characteristic | No ACEi/ARB use (n = 427) |
ACEi/ARB use (n = 422) |
p |
|---|---|---|---|
| Age in years, mean | 61.3 (59.2-63.5) | 62.1 (60.1-64.1) | 0.60 |
| Female (%) | 44.0 (36.9-51.3) | 42.7 (36.3-49.3) | 0.78 |
| Race/ethnicity (%) | 0.46 | ||
| Non-Hispanic white | 56.7 (51.0-62.2) | 53.6 (47.5-59.6) | |
| Non-Hispanic Black | 22.1 (17.8-26.9) | 21.5 (17.3-26.3) | |
| Other | 21.3 (17.2-26.0) | 25.0 (20.6-30.0) | |
| Health insurance, any (%) | 86.7 (82.0-90.3) | 91.5 (86.8-94.7) | 0.11 |
| High school education or above (%) | 67.9 (61.7-73.6) | 69.9 (65.5-73.9) | 0.59 |
| Current smoker (%) | 41.5 (33.3-50.2) | 33.1 (25.7-41.4) | 0.16 |
| Obesity (%) | 53.4 (47.2-59.4) | 53.8 (47.2-60.2) | 0.92 |
| Systolic BP (mmHg), mean | 151 (148-154) | 148 (144-151) | 0.18 |
| Diastolic BP (mmHg), mean | 75 (73-77) | 71 (69-74) | 0.02 |
| Systolic BP range (%) | 0.34 | ||
| <120 mmHg | 11.9 (8.5-16.5) | 14.5 (10.2-20.2) | |
| 120-129 mmHg | 8.5 (5.2-13.4) | 12.1 (8.8-16.4) | |
| 130-139 mmHg | 13.1 (9.2-18.4) | 14.8 (10.6-20.4) | |
| ≥140 mmHg | 66.5 (59.6-72.8) | 58.6 (51.9-65.0) | |
| Diabetes (%) | 46.3 (38.9-53.9) | 69.1 (62.8-74.7) | <0.001 |
| eGFR (ml/min/1.73m2), mean | 65 (59-70) | 62 (58-66) | 0.43 |
| eGFR, ml/min/1.73m2 (%) | <0.001 | ||
| ≥90 | 33.1 (25.5-41.7) | 16.1 (11.8-21.6) | |
| 60-89 | 18.1 (13.2-24.3) | 36.0 (29.7-43.0) | |
| 45-59 | 15.4 (10.8-21.4) | 18.0 (13.3-23.7) | |
| 30-44 | 11.1 (8.0-15.2) | 16.2 (11.6-22.2) | |
| <30 | 22.4 (17.0-28.9) | 13.8 (10.1-18.5) | |
| Serum potassium (meq/L), mean | 4.1 (4.1-4.2) | 4.2 (4.1-4.3) | 0.12 |
| Coronary heart disease (%) | 13.5 (9.5-18.9) | 19.4 (14.2-25.8) | 0.13 |
| Heart failure (%) | 13.1 (9.6-17.6) | 18.4 (13.8-23.9) | 0.11 |
Figures within parentheses represent 95% confidence intervals. For categorical variables, column percentages are presented. P values are for t tests (for continuous variables) and chi-square tests (for categorical variables).
Abbreviations: ACEi = angiotensin converting enzyme inhibitor; ARB = angiotensin receptor blocker; BP = blood pressure; CI = confidence interval; eGFR = estimated glomerular filtration rate; NHANES = National Health and Nutrition Examination Survey.
Association of UACR with ACEi/ARB Use
Next, we examined associations between UACR and ACEi/ARB use in the latest time period, 2013-2018. There was no statistically significant interaction between diabetes and UACR (p for interaction = 0.20), so combined analyses are presented in addition to stratified results. In the combined unadjusted model, UACR 30-299 mg/g and UACR ≥300 mg/g were respectively associated with 25% and 10% increases in prevalent ACEi/ARB use (Table 3). In Model 2, adjusted for age, sex, and race/ethnicity, these associations were largely attenuated; this was predominantly the effect of adjusting for age. In the fully adjusted model, UACR ≥300mg/g was negatively and minimally associated with ACEi/ARB use (adjusted PR 0.95, 95% CI; 0.83-1.09).
Table 3.
Prevalence ratios and 95% confidence intervals for ACEi/ARB use among hypertensive US adults by albuminuria status, NHANES 2013-2018
| Urine albumin/creatinine ratio | Model 1* PR (95% CI) |
Model 2† PR (95% CI) |
Model 3‡ PR (95% CI) |
|---|---|---|---|
| Overall | |||
| <30 mg/g | 1.00 (reference) | 1.00 (reference) | 1.00 (reference) |
| 30-299 mg/g | 1.25 (1.16-1.35) | 1.12 (1.03-1.21) | 1.11 (1.03-1.19) |
| ≥300 mg/g | 1.10 (0.96-1.27) | 0.99 (0.85-1.16) | 0.95 (0.83-1.09) |
| No Diabetes | |||
| <30 mg/g | 1.00 (reference) | 1.00 (reference) | 1.00 (reference) |
| 30-299 mg/g | 1.21 (1.08-1.35) | 1.07 (0.95-1.21) | 1.15 (1.02-1.29) |
| ≥300 mg/g | 0.93 (0.66-1.30) | 0.85 (0.57-1.26) | 0.79 (0.55-1.12) |
| Diabetes | |||
| <30 mg/g | 1.00 (reference) | 1.00 (reference) | 1.00 (reference) |
| 30-299 mg/g | 0.98 (0.88-1.10) | 0.96 (0.87-1.08) | 1.02 (0.92-1.14) |
| ≥300 mg/g | 0.79 (0.69-0.91) | 0.78 (0.67-0.90) | 0.90 (0.75-1.08) |
Model 1 is unadjusted.
Model 2 is adjusted for age, sex, and race/ethnicity.
Model 3 is adjusted for Model 2 covariates plus systolic blood pressure (continuous), estimated glomerular filtration rate (continuous), and diabetes (overall model only).
Abbreviations: ACEi = angiotensin converting enzyme inhibitor; ARB = angiotensin receptor blocker; CI = confidence interval; NHANES = National Health and Nutrition Examination Survey; PR = prevalence ratio.
Sensitivity Analysis
In sensitivity analyses using alternative definitions of hypertension (SBP cutoff of ≥130 mmHg instead of ≥140 mmHg; omitting self-reported hypertension diagnosis), the proportion of ACEi/ARB use over time was similar, and no consistent trends were observed (Figures S1–S2). Prevalence ratios for ACEi/ARB use and UACR categories were not materially changed, including the minimal and statistically nonsignificant associations between UACR ≥300 mg/g and ACEi/ARB use (Tables S2–S3).
Discussion
In this nationally representative study, we found that ACEi/ARB therapy was substantially underutilized among hypertensive adults with severely increased albuminuria. Over half (53.5%) of these individuals were not on ACEi/ARB treatment, amounting to nearly 1.6 million US adults not receiving optimal medical therapy. Despite consistent recommendations for ACEi/ARB treatment for albuminuria by national hypertension guidelines spanning nearly 2 decades, we found no significant trends in the prevalence of ACEi/ARB use in the population of hypertensive adults with UACR ≥300 mg/g, irrespective of diabetes status. In addition, we found minimal association between presence of severe albuminuria and ACEi/ARB use.
Several possible explanations may account for why a person with UACR ≥300 mg/g may not be on ACEi/ARB therapy, including a lack of albuminuria recognition by clinicians, a knowledge gap in guideline- or evidence-based medical care for management of albuminuria, or clinical contraindications to ACEi/ARB therapy. Prior studies have demonstrated that albuminuria may be under-recognized due to undertesting. Among Medicare patients in 2016 with hypertension and no diabetes, only 6.6% had urine albumin testing.18 Similarly, among a cohort of primary care patients with hypertension and no diabetes, only 22.2% had UACR testing within one year of a hypertension diagnosis or elevated blood pressure.31
When UACR testing is performed and albuminuria is detected, provider knowledge about treatment guidelines and the indication for ACEi/ARB therapy can affect prescription rates. The majority of patients with hypertension and albuminuria are managed in the primary care setting, and adherence to guideline-based therapies for kidney health has been shown to be low across a variety of settings and treatments, including ACEi/ARB utilization.32–35 While we could not assess healthcare provider knowledge with NHANES data, suboptimal awareness of management guidelines for albuminuria could have played a role in our results.
Clinical contraindications for treatment with ACEi/ARB are unlikely to have substantively contributed to the lower prevalence of ACEi/ARB use in our study. Common relative contraindications to ACEi/ARB use include very low eGFR, hypotension, and hyperkalemia. In comparing the characteristics of ACEi/ARB users and non-users among hypertensive adults with UACR ≥300 mg/g, we found that the populations were largely similar across many clinical and demographic characteristics. Notably, among those not on ACEi/ARB therapy, approximately half had eGFR above 60 ml/min/1.73m2, mean serum potassium was 4.1, and nearly 80% had SBP ≥130 mmHg—suggesting that as potential contraindications, low baseline kidney function, hyperkalemia, and hypotension are unlikely to explain the gap in guideline-recommended ACEi/ARB therapy. However, we were unable to assess whether adverse effects prompted ACEi/ARB discontinuation, such as acute kidney injury, hyperkalemia, medication allergies, cough, or angioedema.
The finding of only minimal association between UACR ≥300 mg/g and ACEi/ARB use was surprising given that ACEi/ARB therapy has long been a mainstay of treatment for albuminuria. After adjustment, there was a weak inverse association between UACR ≥300 mg/g and ACEi/ARB use. Although an inverse association is the opposite direction we would expect to observe if elevated UACR was a stimulus for ACEi/ARB treatment, the 95% confidence interval included values both greater and less than 1. Nevertheless, even a modest positive association is not what we might expect if clinicians were adhering closely to guidelines for optimal hypertension treatment in the context of albuminuria. These findings are notable given that multiple iterations of US hypertension guidelines over the last 20 years have consistently recommended ACEi/ARB therapy in the setting of CKD, where the operational definition of CKD within each guideline has explicitly included UACR ≥300mg/g.10–12
Equally surprising was that the weak association between UACR and ACEi/ARB use was not different by diabetes status. We had hypothesized that UACR testing could explain greater ACEi/ARB use among individuals with diabetes due to its implementation as a national quality measure.20,31 However, these data suggest that while the prevalence of ACEi/ARB use is nearly double among individuals with hypertension and diabetes compared to those without diabetes, this higher use does not seem to be independently driven by presence of severe albuminuria. Thus, isolated efforts to strengthen recommendations for UACR testing among patients with hypertension would likely be insufficient to narrow the gap in evidence-based ACEi/ARB utilization. Education or clinical decision support providing guidance on manangement of albuminuria in patients without diabetes would reinforce these efforts.
Strengths of this study included a large, nationally representative sample of non-institutionalized adults with hypertension. The NHANES survey design allowed for ascertaining nationally representative prevalence of conditions and medication use without relying on documentation, diagnostic coding, or testing at the level of the provider or health system.
Our study had several limitations. The primary limitation was the cross-sectional design of NHANES. Causal inferences regarding UACR and ACEi/ARB use are limited due to possible temporal ambiguity and selection bias. In addition to albuminuria leading to greater use of ACEi/ARBs, as we hypothesized, their association may reflect the effect of ACEi/ARB treatment on reduction of albuminuria (reverse causation, implying a negative feedback loop). Thus, the direction and magnitude of the cross-sectional association between albuminuria and ACEi/ARB use is difficult to predict and interpret. However, despite this limitation in causal inference, there is an apparent gap in treatment identified in our descriptive analyses: a large number of adults with UACR ≥300 mg/g are not being treated with ACEi/ARBs. In addition, with measurements from a single timepoint, adults with albuminuria may not have persistent abnormalities if testing were repeated.36 Similarly, one-time blood pressure measurement, even when averaged over several readings, may misclassify hypertension status due to masked or white coat hypertension.37 Finally, since the NHANES study population is designed to capture a nationally representative sample, our results may not be generalizable to more specific populations, such as patients in an individual health system, or to underrepresented populations, such as those without health insurance.
Perspectives
In this nationally representative study, we found substantial underutilization of ACEi/ARB therapy for hypertensive adults with UACR ≥300 mg/g, a gap in evidence-based treatment that has persisted despite consistent guideline recommendations over nearly 2 decades and that comprises an estimated 1.6 million US adults based on the most recent time period. These findings offer a significant opportunity to reduce the risk of end-stage kidney disease, cardiovascular disease, and mortality by improving recognition and treatment for albuminuria among adults with hypertension.
Supplementary Material
Novelty and Significance.
What Is New?
Hypertension guidelines have long recommended angiotensin converting enzyme inhibitor (ACEi) or angiotensin receptor blocker (ARB) treatment when albuminuria ≥300 mg/g is present, but adherence to this recommendation is unknown.
What Is Relevant?
In a nationally representative sample, approximately half of US adults with hypertension and albuminuria were treated with ACEi or ARB medications, a proportion essentially unchanged from 2001-2018.
ACEi/ARB use was not associated with albuminuria ≥300 mg/g in adjusted analyses.
Summary
ACEi/ARB underutilization among hypertensive patients with albuminuria represents an opportunity to improve care for this high-risk population.
Acknowledgments:
Sources of Funding: Dr. Chu was supported by the National Institute Of Diabetes And Digestive And Kidney Diseases (NIDDK) of the National Institutes of Health under Award F32DK122629. The NIDDK had no role in design and conduct of the study; collection, management, analysis, and interpretation of the data; preparation, review, or approval of the manuscript; and decision to submit the manuscript for publication. Research reported in this publication is solely the responsibility of the authors and does not necessarily represent the official views or positions of the National Institutes of Health or the Centers for Disease Control and Prevention.
Footnotes
Disclosures: Dr. Crews serves on an advisory board of Bayer HealthCare Pharmaceuticals, Inc. The remaining authors have nothing to disclose.
References
- 1.Matsushita K, van der Velde M, Astor BC, Woodward M, Levey AS, de Jong PE, Coresh J, Gansevoort RT. Association of estimated glomerular filtration rate and albuminuria with all-cause and cardiovascular mortality: a collaborative meta-analysis of general population cohorts. Lancet. 2010;375(9731):2073–2081. doi: 10.1016/S0140-6736(10)60674-5 [DOI] [PMC free article] [PubMed] [Google Scholar]
- 2.Astor BC, Matsushita K, Gansevoort RT, van der Velde M, Woodward M, Levey AS, Jong PE de, Coresh J, Chronic Kidney Disease Prognosis Consortium, Astor BC, et al. Lower estimated glomerular filtration rate and higher albuminuria are associated with mortality and end-stage renal disease. A collaborative meta-analysis of kidney disease population cohorts. Kidney Int. 2011;79(12):1331–1340. doi: 10.1038/ki.2010.550 [DOI] [PMC free article] [PubMed] [Google Scholar]
- 3.Matsushita K, Coresh J, Sang Y, Chalmers J, Fox C, Guallar E, Jafar T, Jassal SK, Landman GWD, Muntner P, et al. Estimated glomerular filtration rate and albuminuria for prediction of cardiovascular outcomes: a collaborative meta-analysis of individual participant data. Lancet Diabetes Endocrinol. 2015;3(7):514–525. doi: 10.1016/S2213-8587(15)00040-6 [DOI] [PMC free article] [PubMed] [Google Scholar]
- 4.Hemmelgarn BR, Manns BJ, Lloyd A, James MT, Klarenbach S, Quinn RR, Wiebe N, Tonelli M, Alberta Kidney Disease Network. Relation between kidney function, proteinuria, and adverse outcomes. JAMA. 2010;303(5):423–429. doi: 10.1001/jama.2010.39 [DOI] [PubMed] [Google Scholar]
- 5.Hsu C, Chinchilli VM, Coca S, Devarajan P, Ghahramani N, Go AS, Hsu RK, Ikizler TA, Kaufman J, Liu KD, et al. Post–Acute Kidney Injury Proteinuria and Subsequent Kidney Disease Progression: The Assessment, Serial Evaluation, and Subsequent Sequelae in Acute Kidney Injury (ASSESS-AKI) Study. JAMA Intern Med. January 2020. doi: 10.1001/jamainternmed.2019.6390 [DOI] [PMC free article] [PubMed] [Google Scholar]
- 6.Jafar TH, Schmid CH, Landa M, Giatras I, Toto R, Remuzzi G, Maschio G, Brenner BM, Kamper A, Zucchelli P, et al. Angiotensin-converting enzyme inhibitors and progression of nondiabetic renal disease. A meta-analysis of patient-level data. Ann Intern Med. 2001;135(2):73–87. doi: 10.7326/0003-4819-135-2-200107170-00007 [DOI] [PubMed] [Google Scholar]
- 7.Jafar TH, Stark PC, Schmid CH, Landa M, Maschio G, de Jong PE, de Zeeuw D, Shahinfar S, Toto R, Levey AS, AIPRD Study Group. Progression of chronic kidney disease: the role of blood pressure control, proteinuria, and angiotensin-converting enzyme inhibition: a patient-level meta-analysis. Ann Intern Med. 2003;139(4):244–252. doi: 10.7326/0003-4819-139-4-200308190-00006 [DOI] [PubMed] [Google Scholar]
- 8.Xie X, Liu Y, Perkovic V, Li X, Ninomiya T, Hou W, Zhao N, Liu L, Lv J, Zhang H, Wang H. Renin-Angiotensin System Inhibitors and Kidney and Cardiovascular Outcomes in Patients With CKD: A Bayesian Network Meta-analysis of Randomized Clinical Trials. Am J Kidney Dis. 2016;67(5):728–741. doi: 10.1053/j.ajkd.2015.10.011 [DOI] [PubMed] [Google Scholar]
- 9.Agodoa LY, Appel L, Bakris GL, Beck G, Bourgoignie J, Briggs JP, Charleston J, Cheek D, Cleveland W, Douglas JG, et al. Effect of ramipril vs amlodipine on renal outcomes in hypertensive nephrosclerosis: a randomized controlled trial. JAMA. 2001;285(21):2719–2728. doi: 10.1001/jama.285.21.2719 [DOI] [PubMed] [Google Scholar]
- 10.Chobanian AV, Bakris GL, Black HR, Cushman WC, Green LA, Izzo JL, Jones DW, Materson BJ, Oparil S, Wright JT, Roccella EJ, National Heart, Lung, and Blood Institute Joint National Committee on Prevention, Detection, Evaluation, and Treatment of High Blood Pressure, National High Blood Pressure Education Program Coordinating Committee. The Seventh Report of the Joint National Committee on Prevention, Detection, Evaluation, and Treatment of High Blood Pressure: the JNC 7 report. JAMA. 2003;289(19):2560–2572. doi: 10.1001/jama.289.19.2560 [DOI] [PubMed] [Google Scholar]
- 11.James PA, Oparil S, Carter BL, Cushman WC, Dennison-Himmelfarb C, Handler J, Lackland DT, LeFevre ML, MacKenzie TD, Ogedegbe O, et al. 2014 Evidence-Based Guideline for the Management of High Blood Pressure in Adults: Report From the Panel Members Appointed to the Eighth Joint National Committee (JNC 8). JAMA. 2014;311(5):507–520. doi: 10.1001/jama.2013.284427 [DOI] [PubMed] [Google Scholar]
- 12.Whelton PK, Carey RM, Aronow WS, Casey DE, Collins KJ, Himmelfarb CD, DePalma SM, Gidding S, Jamerson KA, Jones DW, et al. 2017 ACC/AHA/AAPA/ABC/ACPM/AGS/APhA/ASH/ASPC/NMA/PCNA Guideline for the Prevention, Detection, Evaluation, and Management of High Blood Pressure in Adults: A Report of the American College of Cardiology/American Heart Association Task Force on Clinical Practice Guidelines. Hypertension. 2018;71(6):e13–e115. doi: 10.1161/HYP.0000000000000065 [DOI] [PubMed] [Google Scholar]
- 13.Hoerger TJ, Wittenborn JS, Segel JE, Burrows NR, Imai K, Eggers P, Pavkov ME, Jordan R, Hailpern SM, Schoolwerth AC, Williams DE, Centers for Disease Control and Prevention CKD Initiative. A health policy model of CKD: 2. The cost-effectiveness of microalbuminuria screening. Am J Kidney Dis. 2010;55(3):463–473. doi: 10.1053/j.ajkd.2009.11.017 [DOI] [PubMed] [Google Scholar]
- 14.Komenda P, Ferguson TW, Macdonald K, Rigatto C, Koolage C, Sood MM, Tangri N. Cost-effectiveness of primary screening for CKD: a systematic review. Am J Kidney Dis. 2014;63(5):789–797. doi: 10.1053/j.ajkd.2013.12.012 [DOI] [PubMed] [Google Scholar]
- 15.Murphy DP, Drawz PE, Foley RN. Trends in Angiotensin-Converting Enzyme Inhibitor and Angiotensin II Receptor Blocker Use among Those with Impaired Kidney Function in the United States. J Am Soc Nephrol. 2019;30(7):1314–1321. doi: 10.1681/ASN.2018100971 [DOI] [PMC free article] [PubMed] [Google Scholar]
- 16.Kantor ED, Rehm CD, Haas JS, Chan AT, Giovannucci EL. Trends in Prescription Drug Use among Adults in the United States from 1999–2012. JAMA. 2015;314(17):1818–1831. doi: 10.1001/jama.2015.13766 [DOI] [PMC free article] [PubMed] [Google Scholar]
- 17.Gu Q, Burt VL, Dillon CF, Yoon S. Trends in Antihypertensive Medication Use and Blood Pressure Control Among United States Adults With Hypertension. Circulation. 2012;126(17):2105–2114. doi: 10.1161/CIRCULATIONAHA.112.096156 [DOI] [PubMed] [Google Scholar]
- 18.2018 USRDS Annual Data Report: Epidemiology of Kidney Disease in the United States. Bethesda, MD: National Institutes of Health, National Institute of Diabetes and Digestive and Kidney Diseases; 2018. [Google Scholar]
- 19.American Diabetes Association. 11. Microvascular Complications and Foot Care: Standards of Medical Care in Diabetes—2019. Diabetes Care. 2019;42(Supplement 1):S124–S138. doi: 10.2337/dc19-S011 [DOI] [PubMed] [Google Scholar]
- 20.National Committee for Quality Assurance. HEDIS. NCQA; https://www.ncqa.org/hedis/. Accessed February 2, 2020. [Google Scholar]
- 21.NHANES Response Rates and Population Totals. https://wwwn.cdc.gov/nchs/nhanes/ResponseRates.aspx#population-totals. Accessed August 11, 2020.
- 22.Centers for Disease Control and Prevention (CDC). National Center for Health Statistics (NCHS). National Health and Nutrition Examination Survey Data. Hyattsville, MD: U.S. Department of Health and Human Services, Centers for Disease Control and Prevention; 1999. https://wwwn.cdc.gov/nchs/nhanes/. Accessed May 7, 2019. [Google Scholar]
- 23.International Expert Committee Report on the Role of the A1C Assay in the Diagnosis of Diabetes. Diabetes Care. 2009;32(7):1327–1334. doi: 10.2337/dc09-9033 [DOI] [PMC free article] [PubMed] [Google Scholar]
- 24.KDIGO CKD Work Group. KDIGO 2012 Clinical Practice Guideline for the Evaluation and Management of Chronic Kidney Disease. Kidney Int Suppl. 2013;3(1):1–150. [DOI] [PubMed] [Google Scholar]
- 25.Levey AS, Stevens LA, Schmid CH, Zhang YL, Castro AF, Feldman HI, Kusek JW, Eggers P, Van Lente F, Greene T, Coresh J. A New Equation to Estimate Glomerular Filtration Rate. Ann Intern Med. 2009;150(9):604–612. [DOI] [PMC free article] [PubMed] [Google Scholar]
- 26.National Center for Health Statistics. National Health and Nutrition Examination Survey 1988-2018 Data Documentation, Codebook, and Frequencies. https://wwwn.cdc.gov/Nchs/Nhanes/1999-2000/RXQ_DRUG.htm. Accessed April 14, 2020.
- 27.Vittinghoff E, Glidden DV, Shiboski SC, McCulloch CE. Regression Methods in Biostatistics. New York: Springer; 2005. [Google Scholar]
- 28.Johnson CL, Paulose-Ram R, Ogden CL, Carroll MD, Kruszon-Moran D, Dohrmann SM, Curtin LR. National health and nutrition examination survey: analytic guidelines, 1999-2010. Vital Health Stat 2. 2013;(161):1–24. [PubMed] [Google Scholar]
- 29.Zou G A Modified Poisson Regression Approach to Prospective Studies with Binary Data. Am J Epidemiol. 2004;159(7):702–706. doi: 10.1093/aje/kwh090 [DOI] [PubMed] [Google Scholar]
- 30.Xu H, Huang X, Risérus U, Cederholm T, Lindholm B, Ärnlöv J, Carrero JJ. Urinary albumin excretion, blood pressure changes and hypertension incidence in the community: effect modification by kidney function. Nephrol Dial Transplant. 2014;29(8):1538–1545. doi: 10.1093/ndt/gfu057 [DOI] [PubMed] [Google Scholar]
- 31.Lee J, Chu C, Guzman D, Fontil V, Velasquez A, Powe NR, Tuot DS. Albuminuria Testing by Race and Ethnicity among Patients with Hypertension with and without Diabetes. Am J Nephrol. June 2019:1–7. doi: 10.1159/000500706 [DOI] [PMC free article] [PubMed] [Google Scholar]
- 32.Litvin CB, Nietert PJ, Wessell AM, Jenkins RG, Ornstein SM. Recognition and Management of CKD in Primary Care. Am J Kidney Dis. 2011;57(4):646–647. doi: 10.1053/j.ajkd.2010.11.013 [DOI] [PMC free article] [PubMed] [Google Scholar]
- 33.Allen AS, Forman JP, Orav EJ, Bates DW, Denker BM, Sequist TD. Primary Care Management of Chronic Kidney Disease. J Gen Intern Med. 2011;26(4):386–392. doi: 10.1007/s11606-010-1523-6 [DOI] [PMC free article] [PubMed] [Google Scholar]
- 34.Bello AK, Ronksley PE, Tangri N, Kurzawa J, Osman MA, Singer A, Grill AK, Nitsch D, Queenan JA, Wick J, et al. Quality of Chronic Kidney Disease Management in Canadian Primary Care. JAMA Netw Open. 2019;2(9):e1910704–e1910704. doi: 10.1001/jamanetworkopen.2019.10704 [DOI] [PMC free article] [PubMed] [Google Scholar]
- 35.Tummalapalli SL, Powe NR, Keyhani S. Trends in Quality of Care for Patients with CKD in the United States. Clin J Am Soc Nephrol. 2019;14(8):1142–1150. doi: 10.2215/CJN.00060119 [DOI] [PMC free article] [PubMed] [Google Scholar]
- 36.Saydah SH, Pavkov ME, Zhang C, Lacher DA, Eberhardt MS, Burrows NR, Narva AS, Eggers PW, Williams DE. Albuminuria Prevalence in First Morning Void Compared with Previous Random Urine from Adults in the National Health and Nutrition Examination Survey, 2009–2010. Clin Chem. 2013;59(4):675–683. doi: 10.1373/clinchem.2012.195644 [DOI] [PMC free article] [PubMed] [Google Scholar]
- 37.Muntner P, Daichi S, Carey RM, Charleston JB, Gaillard T, Misra S, Myers MG, Ogedegbe G, Schwartz JE, Townsend RR, Urbina EM, Viera AJ, White WB, Wright JT. Measurement of Blood Pressure in Humans: A Scientific Statement From the American Heart Association. Hypertension. 2019;73(5):e35–e66. doi: 10.1161/HYP.0000000000000087 [DOI] [PMC free article] [PubMed] [Google Scholar]
Associated Data
This section collects any data citations, data availability statements, or supplementary materials included in this article.