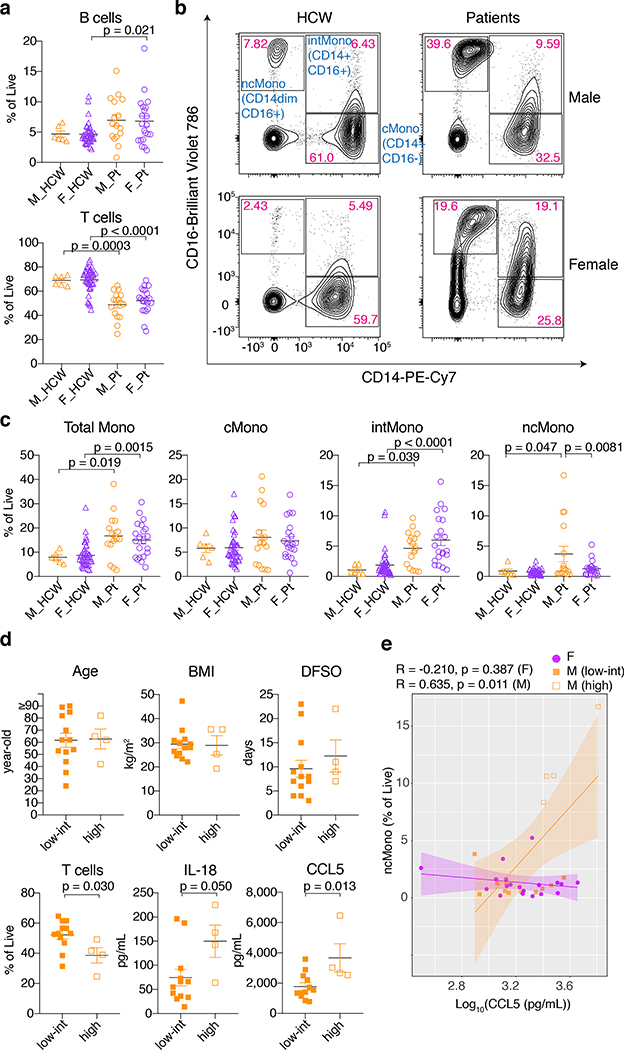
Fig. 2. PBMC composition differences between male and female Cohort A patients at the first sampling.
a, Comparison on the proportion of B cells and T cells in live PBMCs. n=6, 42, 16, and 21 for M_HCW, F_HCW, M_Pt, and F_Pt, respectively. b, Representative 2D plots for CD14 and CD16 in monocytes gate (live/singlets/CD19-CD3-/CD56-CD66b-). Numbers in red indicate the percentages of each population in the parent monocyte gate. c, Comparison between percentages of total Monocytes, cMono, intMono, ncMono in the live PBMCs. n=6, 42, 16, and 21 for M_HCW, F_HCW, M_Pt, and F_Pt, respectively. d, Comparison of age, BMI, DFSO, T cells (% of live PBMCs), and plasma IL-18/CCL5 levels between male patients who had high ncMono and low-intermediate ncMono. n=13 and 4 for “low-int” group and “high” group, respectively, for age, BMI and DFSO. n=12 and 4 for “low-int” group and “high” group, respectively, for T cells and IL-18/CCL5 levels. e, Correlation between plasma CCL5 levels and ncMono (% of live cells). Pearson correlation coefficients (R) and p-values for each sex are shown on top of the plot. ncMono-high male patients (n=4) are shown with orange open squares, and ncMono-low-int male patients (n=11) are shown with orange closed squares. n=19 for female patients (purple circles). Data are mean ± SEM in a, c, and d. One-way ANOVA with Bonferroni multiple comparison test was used in a and c, and unpaired two-tailed t-test used in d. All p-values < 0.10 are shown in the panels.

