Abstract
Silica membrane stabilized gold coated silver (Ag@Au) (i.e., internally etched silica coated Ag@Au (IE Ag@Au@SiO2)) nanoparticles promote surface-enhanced Raman scattering (SERS) activity and detection of uranium (VI) oxide (uranyl) under harsh solution phase conditions including in pH 3–7, ionic strengths up to 150 mM, and temperatures up to 37°C for at least 10 hours. These materials overcome traditional solution-phase plasmonic nanomaterial limitations including signal variability and/or degradation arising from nanoparticle aggregation, dissolution, and/or surface chemistry changes. Quantitative uranyl detection occurs via coordination to 3-mercaptopropionate (MPA), a result confirmed through changes in correlated SERS intensities for uranyl and COOH/COO− vibrational modes. Quantification is demonstrated down to 110 nM, a concentration below toxic levels. As pH varies from 3 to 7, the plasmonic properties of the nanoparticles are unchanged, and the uranyl signal depends on both the protonation state of MPA as well as uranyl solubility. High ionic strengths (up to 150 mM) and incubation at 37°C for at least 10 hours do not impact the SERS activity of uranyl even though slight silica dissolution is observed during thermal treatment. All in all, microporous silica membranes effectively protect the nanoparticles against variations in solution conditions thus illustrating robust tunability for uranyl detection using SERS.
Graphical Abstract
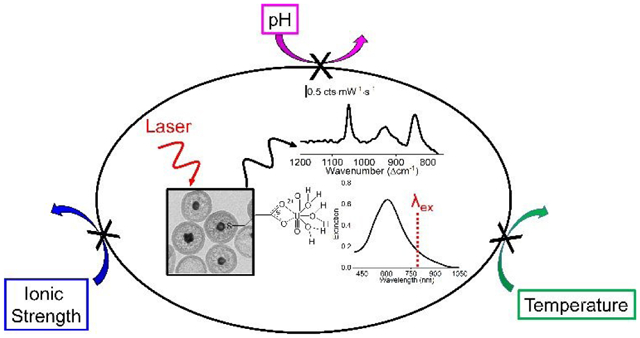
Microporous silica membranes facilitate plasmonic stability of Ag@Au nanoparticles against variations in pH, ionic strength, and temperature for SERS sensing.
Introduction
Nanomaterials that support a localized surface plasmon resonance (LSPR) promote electromagnetic enhancement in surface-enhanced Raman scattering (SERS) and subsequently, increase signals up to 9 orders of magnitude thereby promoting trace analyte detection.1, 2 When solution-phase nanostructures are used, aggregation often induces electromagnetic coupling between nanostructures resulting in varying SERS intensities3 thus limiting quantitative SERS-based signals. Surface modification using long chain polymers,4, 5 proteins,6, 7 or charged molecules can increase particle stability via electrostatic or steric mechanisms; however, SERS activity can be reduced because of the physical barrier generated by these as well as changes in pH8–10 and/or ionic strength.11–14
Previously, plasmonic nanoparticles encapsulated in microporous silica membranes were shown to exhibit stable optical properties while also promoting reproducible SERS activity.15–18 Other porous surface modification strategies have also been employed to promote the size dependent properties of other nanomaterials.19–23 Key materials design features include (1) silica membrane thickness of 30+ nm to reduce the likelihood of electromagnetic coupling between plasmonic cores and (2) nanopore diameters of ~2 nm to facilitate molecular diffusion through the silica layer toward the metal for SERS. In so doing, properties that depend on both molecular15, 16, 24 and nanoparticle15 properties were revealed. For instance, 4-mercaptobenzoic acid, which exhibits lower electrostatic repulsive forces with silica than 4-mercaptobenzoate, rapidly diffused through the silica membrane and was easily quantified with SERS. Changes in intermolecular interactions influenced SERS signals via chemical enhancements, a result only possible because of the preserved electromagnetic nanostructure properties. Reliable and quantitative SERS activity was demonstrated as long as solution pH was less than 9 as silica dissolution was triggered in more basic conditions.
In this study, we evaluate the performance of silica membrane encapsulated gold coated silver (Ag@Au) nanoparticles as nanosensors for the detection of uranium (VI) oxide (uranyl) as a function of ionic strength, pH, and temperature. Uranyl, a known biological and chemical toxin25 above 30 μg/L (or ~0.12 μM),25 is composed of a uranium atom axially coordinated to two oxygen atoms (bond order between 2–3) and equatorially coordinated to various ligands, and exhibits tunable solubility and toxicity as a function of these same parameters. While conventional methods26 provide excellent detection limits, vibrational spectroscopy including Raman scattering14, 27–30 offers several advantages including simple sample preparation and rapid detection. When coupled with plasmonic nanomaterials and SERS, advantages of low detection limits and sensitivity can also be realized.28 For instance, plasmonic nanospheres,29–31 nanostars,28, 32 and nanorods33, 34 suspended in solution have been used for uranyl detection using SERS down to nM concentrations. While both silver and/or gold nanoparticles have been employed, each offers distinct advantages (i.e., larger enhancements and superior chemical stability, respectively). Surface functionalization is typically used to improve selectivity with citrate31 and 4-mercaptobenzoic acid29 being common ligands. These serve dual roles by providing a steric barrier to reduce nanoparticle aggregation while also serving as coordination ligands for uranyl capture and SERS detection. Herein, 3-mercaptopropionic acid (MPA) is used for uranyl coordination (ΔGads = 7.98–8.47 kcal/mol).28 Impacts on several parameters are investigated. First, influences of solution pH ranging from 3–7 on the kinetics of uranyl detection are studied. Second, the materials and sensing are challenged at various ionic strengths (<150 mM). Third, nanostructures are equilibrated at temperatures between 23–37°C for 0–10 hours. Each parameter studied has the potential to influence both uranyl speciation/solubility as well as nanomaterial structure-function behaviour. As such, conditions in which these nanostructures can be used for sensing small molecules are examined.
Experimental
Chemical Reagents
Gold (III) chloride trihydrate (99.995%), 4-(2-hydroxyethyl)-1-piperazine propanesulfonic acid (EPPS, 99.5%), sodium citrate dihydrate (99%), Amberlite MB-150 resin, (3-aminopropyl) trimethoxysilane (APTMS, 97%), sodium nitrate (NaNO3, 99%), sodium silicate (27% m/v, 95%), tetraethyl orthosilicate (TEOS, 99%), silver perchlorate (99%), sodium borohydride (99%), MPA (99%), sodium hydroxide (97%), and hydroxylamine hydrochloride (99%) were purchased from Sigma. Ethanol, ammonium hydroxide (NH4OH, 99.9%), hydrochloric acid (HCl, 99.9%), and nitric acid (HNO3, 99.9%) were purchased from Fisher Scientific (Pittsburgh, PA). Spent uranium (98–102%) was purchased from Flinn Scientific. Ultrapure water (18.2 MΩ·cm−1) was obtained from a Barnstead Nanopure System and used for all experiments. Glassware was cleaned with aqua regia (3:1 HCl/HNO3), rinsed thoroughly with water, and dried in an oven (glass) or air-dried (plastic).
Ag@Au Nanoparticle Synthesis
Ag@Au nanoparticles were synthesized using a previously described seeded growth method.35, 36 Representative transmission electron microscopy (TEM) images and structural analyses are found in Fig. 1a and 1b, respectively. Briefly, 100 μL of 0.3 M citrate was added to 99.7 mL of degassed water. The solution was placed in an ice bath in the dark and stirred at 350 RPM. Next, 100 μL of freshly prepared 1 M Na borohydride and 1 min later, 100 μL of 100 mM Ag perchlorate were added. The resulting Ag seeds were stirred for 3 min then equilibrated un-agitated in the dark on ice for 3 hrs. The Ag nanoparticles exhibited an average diameter of 13.6±5.6 nm (N = 336, from TEM) and a molar extinction coefficient37 of 4.00 × 10⁹ M−1·cm−1.
Fig. 1.
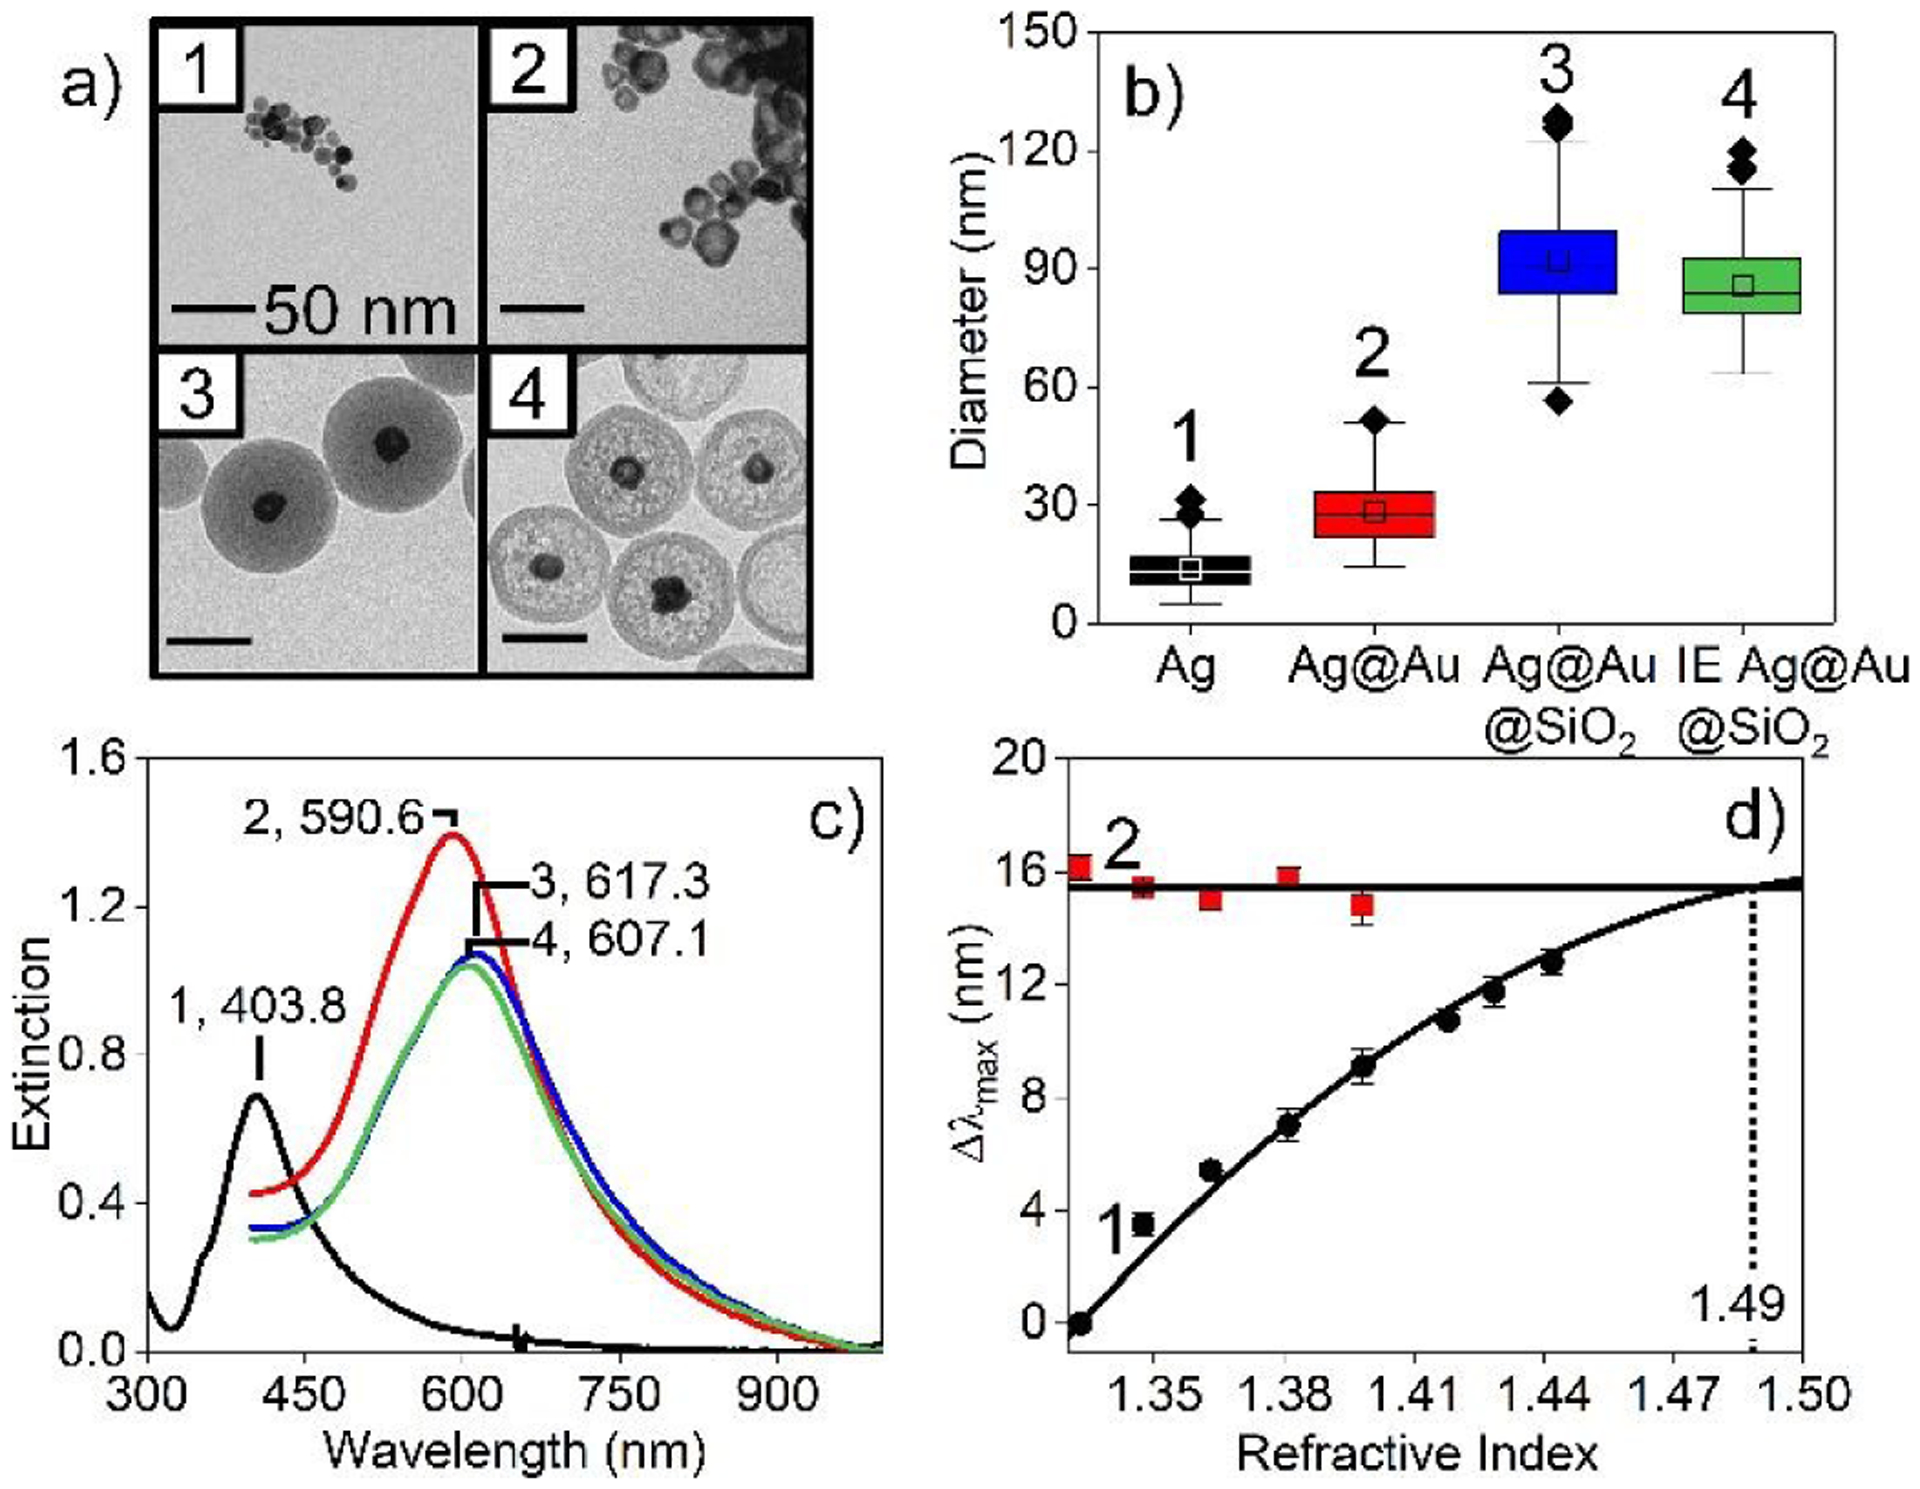
(a) TEM images (scale bars = 50 nm), (b) box and whisker plots associated with diameters (*=outliers), and (c) LSPR spectra of (1) Ag (diameter, d=13.6±5.6), (2) Ag@Au (28.1±9.0), (3) Ag@Au@SiO2 (91.6±11.8), and (4) IE Ag@Au@SiO2 nanoparticles (86.9±12.7). (d) Bulk refractive index sensitivity of Ag@Au nanoparticles (1) without and (2) with silica shells. 0–80% (w/v) sucrose solutions were used, and eq. 1 was used for analysis.
Next, 16.3 mL water and 155 μL of 0.3 M citrate were added to 45 mL of the as-synthesized Ag nanoparticles. After equilibrating this solution on ice with stirring for 2 min, 16.3 mL of both 6.25 mM hydroxylamine and 0.465 mM Au salt were added using a syringe pump at a rate of 3 mL/min. After 1 hr, stirring was stopped then stored at 2–4 °C for 18 hrs to ensure Ag@Au nanoparticle formation. These nanostructures were triply centrifuged and rinsed with water (30 min, 2000×g) before being redispersed in 1 mM citrate to a nanoparticle concentration of 0.25 nM. The Ag@Au nanoparticles exhibited an average diameter of 28.1±9.0 nm (N = 204) from TEM.
Ag@Au@SiO2 Nanoparticle Synthesis
Silica shells were formed around Ag@Au nanoparticles using a modified Stöber method.18, 38, 39 First, the pH and conductivity of 40 mL of as-synthesized Ag@Au nanoparticles were adjusted to 5 and ~110 μS/cm using NaOH and Amberlite resin, respectively. After filtering the resin, 46 μL of 1 mM, fresh APTMS was added dropwise while stirring at 350 RPM. After 30 min, 325 μL of 2.7% Na silicate was added dropwise to the solution, which was then stirred for 24 hrs. Next, silica condensation was promoted by adding ethanol to 1:4 water:ethanol. After 6 hrs, 32 μL of 1 mM APTMS, 32 μL TEOS, and 160 μL of concentrated NH4OH were added consecutively. After 16 hrs, the Ag@Au@SiO2 nanoparticles were triply centrifuged and dispersed in ethanol then water (45 min, 9383×g). Finally, the Ag@Au@SiO2 nanoparticles were passed through a Sephadex-50 column to remove particles not fully encapsulated in silica. These nanoparticles were stored in absolute ethanol until use and exhibited average overall diameters of 91.6±11.8 nm (N = 197) and silica shell thicknesses of 31.8±7.4 nm (propagated error).
Synthesis of Internally Etched (IE) Ag@Au@SiO2 Nanoparticles
Silica membranes were formed around Ag@Au nanoparticles using a previously published protocol.17, 38, 40 To do so, aliquots of Ag@Au@SiO2 nanoparticles were triply centrifuged (7607×g for 20 min) and dispersed in water to remove ethanol then passed through a Sephadex-G50 column. Next, the nanoparticles were diluted to ~0.37 nM using water. Internal etching was initiated via addition of NH4OH (1.5 M final concentration). The extinction maximum wavelength (λmax) associated with the metallic nanoparticles shifted from 617.3 to 607.1 nm before the reaction was quenched using 100 mM HNO3 (pH=5). The resulting internally etched (IE) Ag@Au@SiO2 nanoparticles were immediately centrifuged and redispersed in water three times (7 min, 7607×g for the first rinse and 15 min, 7607×g for other washes) then passed through a Sephadex-G50 column. The resulting materials were either used immediately or stored in ethanol. The IE Ag@Au@SiO2 nanoparticles exhibited diameters of 86.9 ± 12.7 nm (N=162) and silica + void thicknesses of 29.4±7.8 nm (propagated error) (see Fig. 1b).
Nanoparticle Functionalization
Ag@Au and IE Ag@Au@SiO2 nanoparticles were then functionalized with MPA. First, a 10 mM EPPS buffer was prepared (pH 5 (adjusted using HNO3 and NaOH) and ionic strength of 10 mM (adjusted using NaNO3)). Next, the nanostructures were dispersed in buffer to 1 nM. Next, MPA was added to 100 μM (final concentration). After 24 hrs, the carboxylated Ag@Au nanoparticles were washed three times in 1 mM NaOH and once in water (30 min, 2000×g). Carboxylated IE Ag@Au@SiO2 nanoparticles were washed three times in 10 mM EPPS (15 min, 7607×g) and passed through a Sephadex-50 column before being redispersed in 10 mM EPPS.
TEM
TEM was performed using a JEOL TEM-1230 microscope equipped with a Gatan CCD. The nanoparticle solution was diluted by 50% using ethanol, and ~10 μL of this solution was deposited onto 400 mesh copper grids coated with Formvar and carbon (Ted Pella) then dried at room temperature. At least ~200 nanoparticles (N) were analyzed (Image Pro Analyzer) to estimate average nanoparticle diameters. Silica shell thicknesses were determined by propagation of error using Ag@Au and Ag@Au@SiO2 nanoparticle diameters.
Extinction and SERS Spectroscopies
LSPR spectra of Ag and all Ag@Au nanoparticles were collected using quartz and methacrylate cuvettes (path length = 1 cm), respectively. Deuterium (UV) and halogen (visible) bulbs were used for excitation. LSPR spectra were collected in transmission geometry with an integration time (tint) of 25 ms, 50 averages, and a boxcar of 5. Spectra were collected from 200–900 nm or 400–1000 nm using UV–vis spectroscopy (i-trometer BWTek). Representative LSPR spectra are shown in Fig. 1c. Extinction maximum wavelengths (λmax) were determined from the 0-point crossing of first derivative spectra.
The characteristic electromagnetic field decay length (ld) and linear (m1) and non-linear (m2) refractive index sensitivities for Ag@Au nanoparticles were determined41 as shown in Fig. 1d. Briefly, the λmax observed in LSPR spectra for Ag@Au and Ag@Au@SiO2 nanoparticles incubated in 0–60% (w/w) sucrose were measured after a ~5 min incubation, plotted as a function of refractive index, and analyzed using the following equation:41
| (eq. 1) |
where Δλmax is the LSPR wavelength shift; nsilica and nwater are the silica and bulk refractive indices, respectively; and t is the silica membrane thickness. The intersection of these responses indicates an effective refractive index of silica (1.49). Values of m1, m2, and ld are 170 nm/RIU, 450 nm/RIU2, and ~9 nm, respectively, and are similar in magnitude to Ag@Au spheres,17, 42 Au shells,43, 44 and Au nanospheres.41, 42
SERS measurements were performed using an ExamineR spectrometer (DeltaNu) with an excitation wavelength (λex) of 785 nm, laser power (P) = 40 mW, integration time (tint) = 30 s, and 15 averages. Samples contained 0.7 nM carboxylated IE Ag@Au@SiO2 nanoparticles in 10 mM EPPS (pH 3–7 and 10–150 mM ionic strength). Once uranyl was added, samples were vortexed for 20 sec, then SERS spectra were collected for 30 min. Control spectra (carboxylated IE Ag@Au@SiO2 nanoparticles dispersed in corresponding buffers) were collected then subtracted from uranyl containing data. Spectral deconvolution was performed in the uranyl window (900–700 cm−1) by identifying vibrational band centres using second derivative analysis and Gaussian functions where features with signal to noise greater than 3 and full width at half maximum values greater than 8 cm−1 were considered significant. Relative fractions of soluble uranyl at equilibrium were simulated as a function of pH and total uranyl concentration using Hydra and Medusa, a chemical and formation constant database. Uranyl complexes were constructed using Crystal Maker based on previously reported parameters for uranyl.45, 46
Results and Discussion
Mechanism of Uranyl Detection using Carboxylated Silica Encapsulated Ag@Au Nanoparticles
Uranyl neutralizes the surface potential induced by carboxylate upon coordination28 thereby yielding varying plasmonic properties and SERS intensities when solution-phase nanoparticles are used.30, 47 Carboxylated IE Ag@Au@SiO2 nanoparticles overcome this instability because of its microporous silica membrane structure, which both promotes optical stability and facilitates SERS detection. This is demonstrated in Fig. 2a where LSPR spectra of carboxylated IE Ag@Au@SiO2 nanoparticles before and after 5.9 μM uranyl addition are shown. Three important observations are noted. First, spectral lineshape, full width at half maximum (Γ), and extinction magnitude at the λmax remain unchanged thereby suggesting that uranyl does not influence plasmonic stability. Second, the λmax systematically red-shifts ~2 nm with time then saturates after ~10 min (Fig. 2b–1). This occurs as uranyl coordinates to the carboxylate groups, which causes the local refractive index near the metal to increase until surface saturation is achieved. Finally, these data are analyzed using a modified form of Fick’s second law:15
| (eq. 2) |
where Ct is the molecular concentration at the metal surface at a given time (t), Cs is concentration the initial of molecules at the exterior of the silica membrane, x is the membrane thickness, and Deff is the effective diffusion coefficient for uranyl to pass through the membrane. Assuming Ct/Cs is proportional to time dependent λmax values, Deff is determined as ~2033 nm2/min.
Fig. 2.
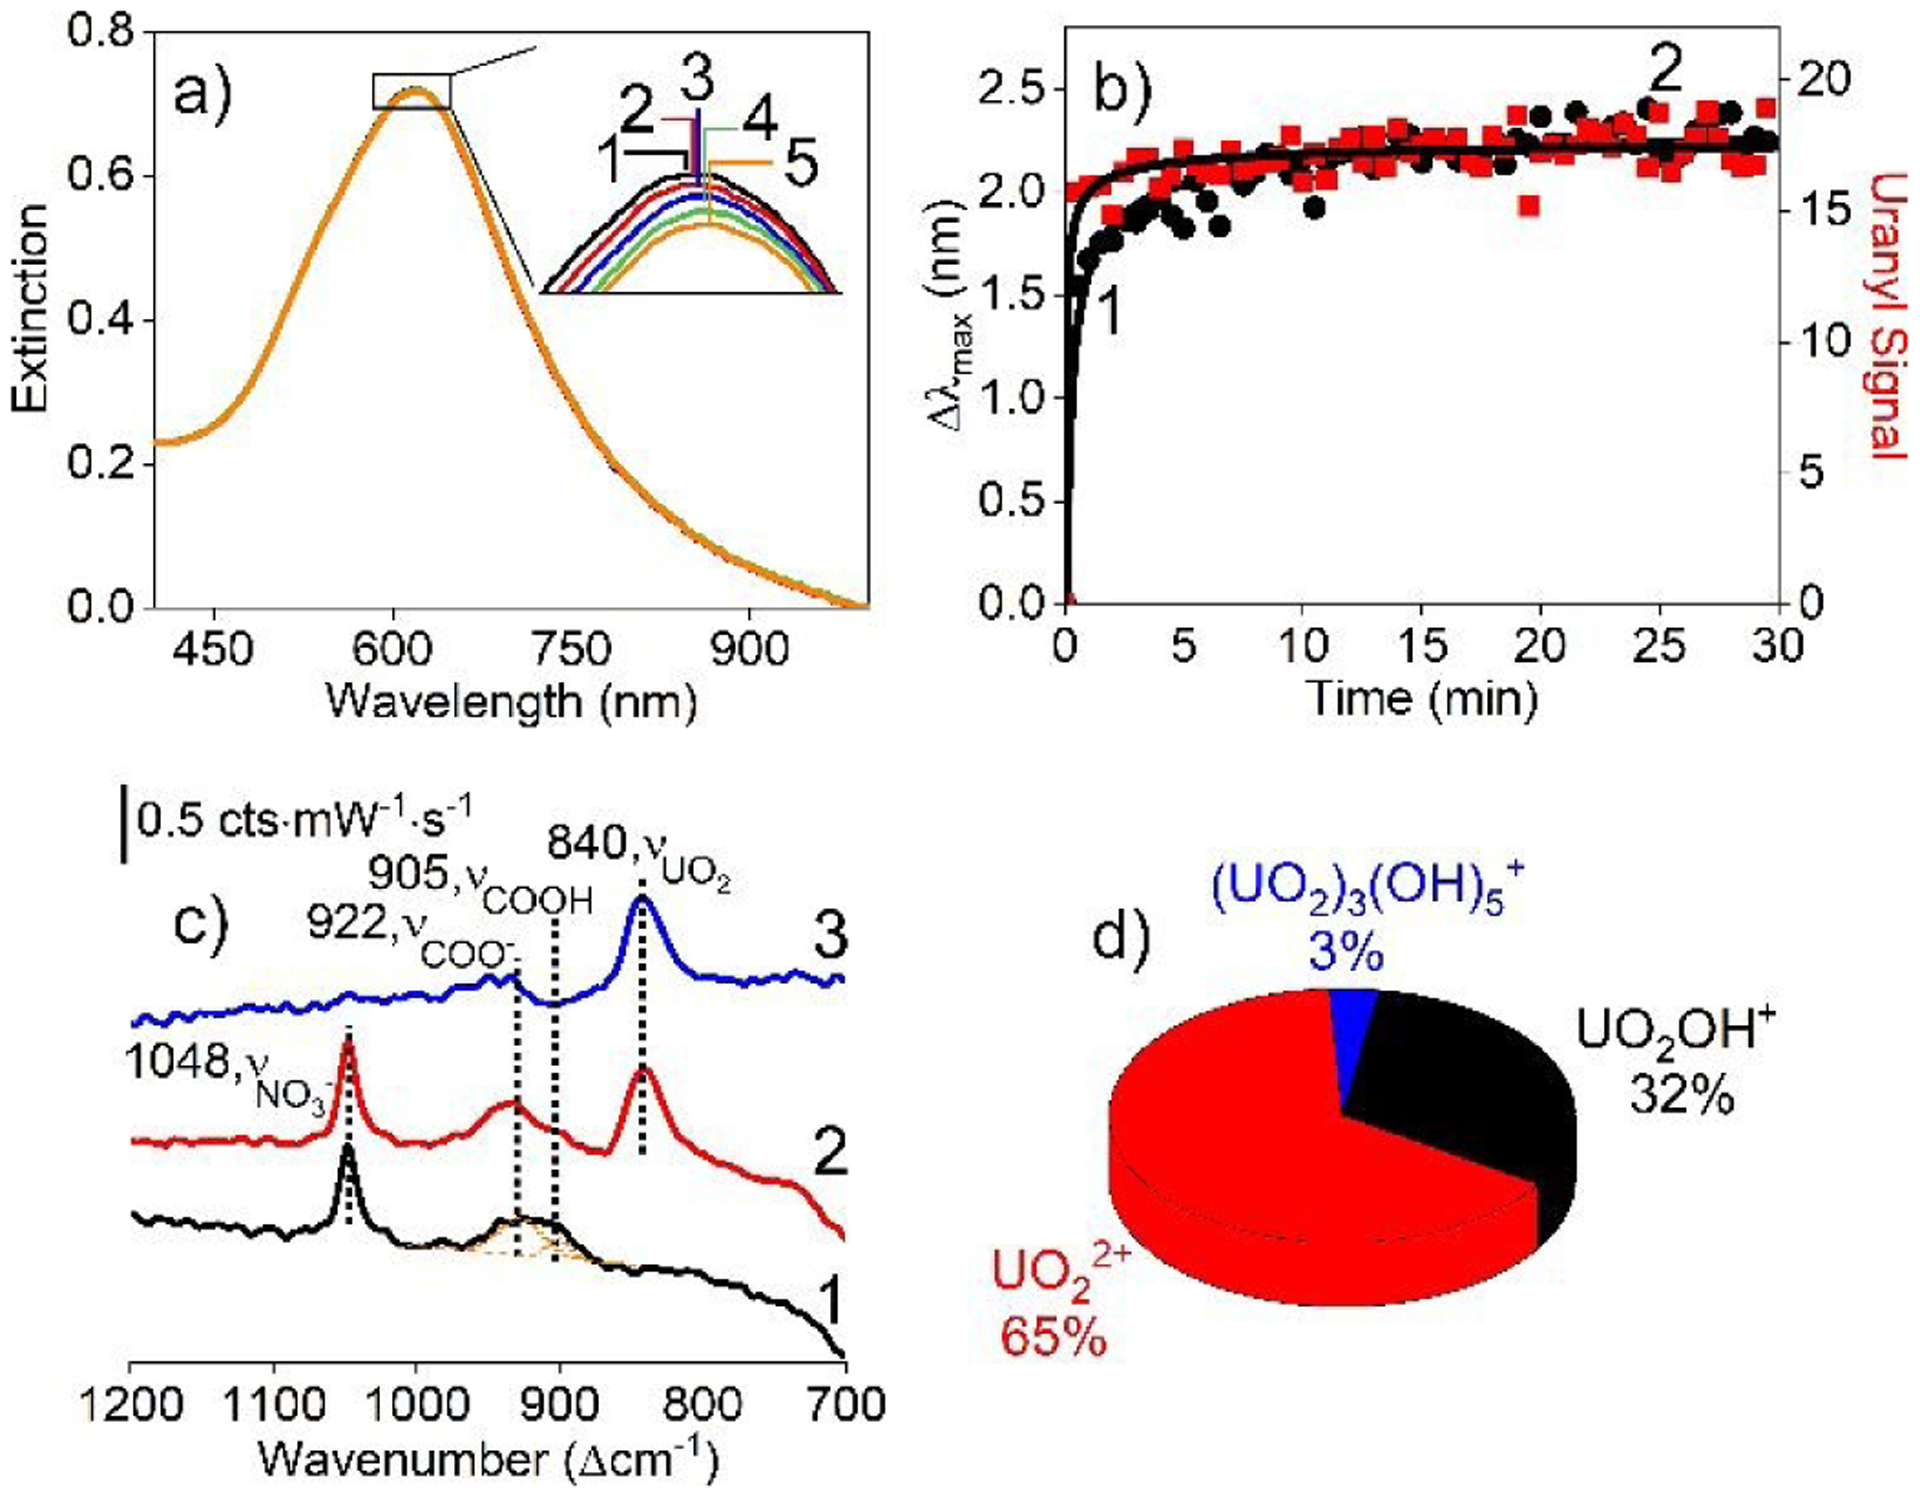
(a) LSPR spectra of 0.7 nM carboxylated IE Ag@Au@SiO2 nanoparticles (1) before (λmax = 617.8 nm) and after incubation in 5.9 μM uranyl for (2) 5, (3) 10, (4) 20, and (5) 30 min (λmax = 620.1 nm). (b) Time-dependent (1) Δλmax and (2) uranyl signal observed in SERS (area from 870 – 800 cm−1) (t=0 is when uranyl is added). Data are fit using Fick’s second law of diffusion. (c) Representative SERS spectra collected (1) before and (2) after uranyl addition and (3) corresponding difference spectrum. Experimental conditions: λex= 785 nm, tint=30 s, P = 40 mW, 15 averages. (d) Theoretical fraction of uranyl species at pH 5 and 40 mM ionic strength.
SERS data further support successful uranyl coordination. As shown in Fig. 2c–1, carboxylated IE Ag@Au@SiO2 nanoparticles contain three features including symmetric stretches for nitrate, COO−, and COOH located at 1048, 922, and 905 cm−1, respectively, indicating the presence of free nitrate and both protonated and deprotonated MPA, which is reasonable given the solution pH (5) is near the surface pKa of carboxylate (4.3).48 Upon uranyl addition (Fig. 2c–2), nitrate and carboxylate intensities remain unchanged while the COOH stretch decreases and a new band centred between 870–800 cm−1 and associated with uranyl28 develops. These changes are more easily observed in difference spectra as shown in Fig. 2c–3. We hypothesize that uranyl coordination causes the COO− stretch to red shift to a vibrational frequency similar to COOH then dampens. A similar effect was previously observed when Pb2+ coordinated to carboxylate,49 a result attributed to either an increase in electron density in the metal or restricted vibrational motion upon coordination. Of note, COOH does not coordinate with uranyl.50 Because the carboxylate density on Au is greater than in solution and much higher than UO2OH+ at pH 5 (2 μM), ligand exchange readily occurs between COO− and OH− thus facilitating uranyl coordination. Because all soluble uranyl species are cationic (see relative abundances in Fig. 2d), all species can diffuse through the silica membrane for SERS detection.16, 51
Fig. 3.
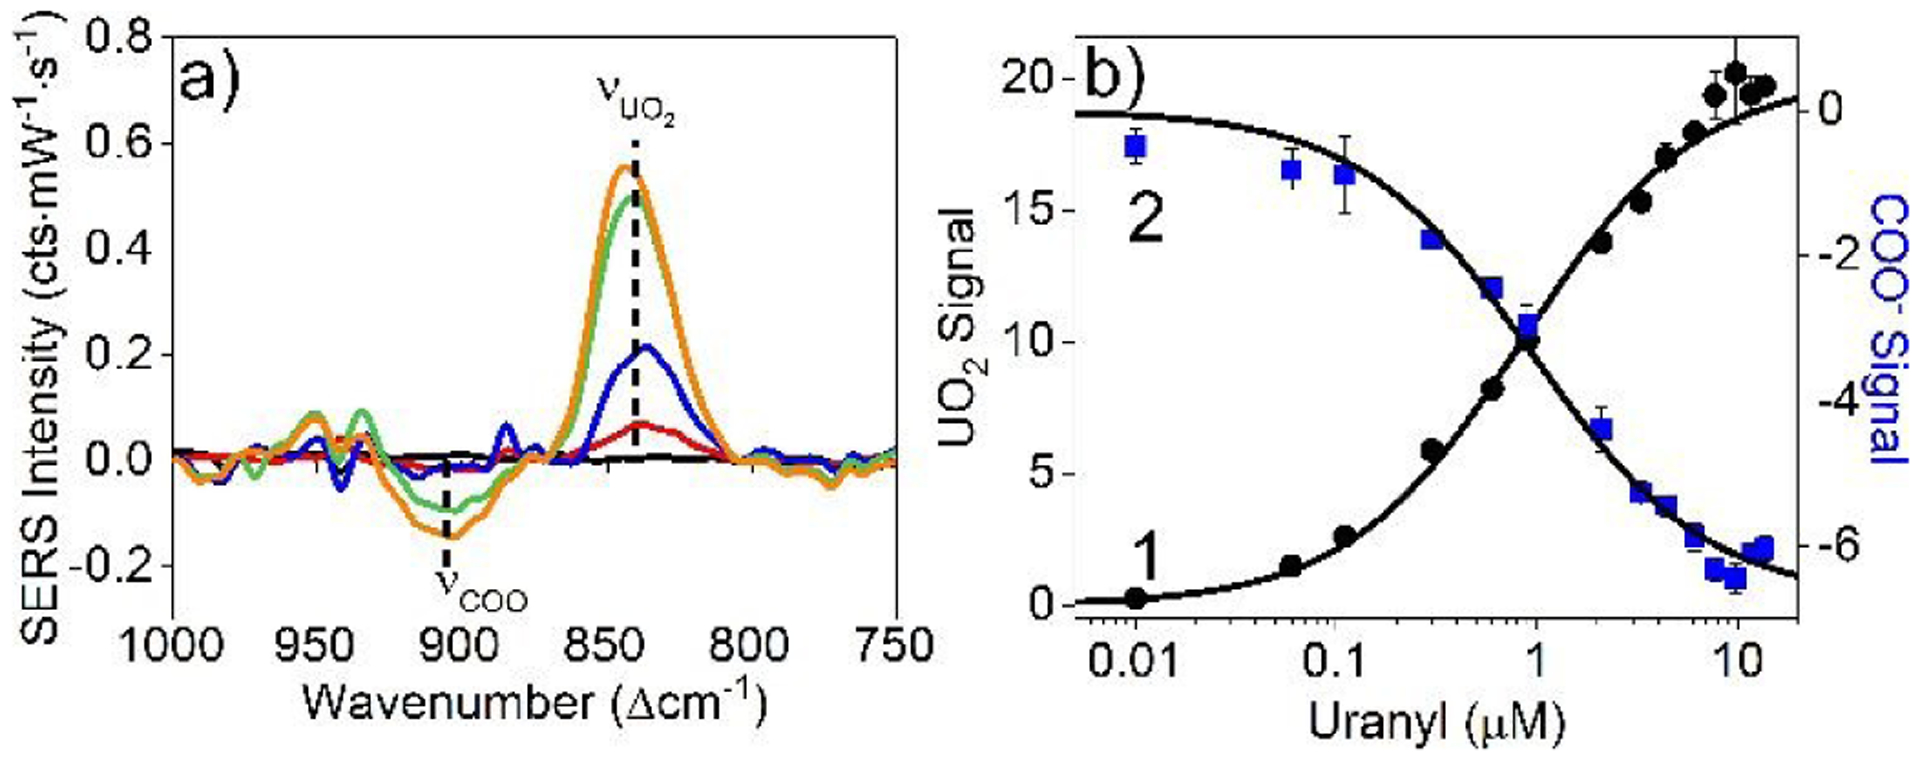
(a) SERS difference spectra of (black) 0, (red) 0.11, (blue) 0.33, (green) 3.3, and (orange) 13.6 μM uranyl. Experimental conditions: λex = 785 nm, tint = 30 s, P = 40 mW, 10 mM EPPS buffer, 0.7 nM carboxylated IE Ag@Au@SiO2 nanoparticles. Samples were equilibrated for 30 min prior to analysis. (b) Correlated (1) uranyl (870–800 cm−1) and (2) carboxylate (940–870 cm−1) SERS signals (integrated areas). Black solid lines represent Langmuir adsorption isotherm analysis.
In contrast to the COOH/COO− stretches, the uranyl vibrational mode increases systematically with time as observed in Fig. 2b–2. Analysis of the time-dependent uranyl envelope (area from 870 to 800 cm−1) using Fick’s second law reveals an effective diffusion coefficient of 16000 nm2/min. This value is ~8 times larger than what was observed using LSPR (Fig. 2b–1). This suggests that SERS signals are more sensitive to slight changes in surface chemistry than refractive index changes indicated in LSPR.52 Furthermore, LSPR and SERS signals scale with the electric field to the second and fourth powers, respectively. As such, the effective diffusion coefficient reported using SERS data is significantly larger than the value reported from LSPR. Despite these differences, both signals saturate after ~15 min indicating equilibrium is achieved.
Further evidence that supports uranyl coordination is shown in Fig. 3 where uranyl concentration varied from 0 – 13.6 μM and SERS measurements collected after 30 min. As uranyl concentration increases, uranyl intensity increases while the COOH/COO− features decrease thereby suggesting cooperativity. Plotting these signals as a function of uranyl concentration and applying the Langmuir adsorption model,28 Keq and ΔGads are quantified as 1.18±0.08 μM−1 and 8.28±0.04 kcal/mol, respectively, for uranyl – carboxylate coordination (Fig. 3b). These values are consistent with previously published values for similar molecular species,28 which further supports the proposed binding mechanism as determined using SERS. The limit of detection (LOD) for uranyl is ~110 nM, which is the lowest uranyl concentration detected that exhibits a signal that is at least 3 times the noise. Quantitative detection from the LOD up to 8 μM sets the dynamic range.
Closer evaluation of the uranyl window suggests that uranyl speciation is retained. As shown in Fig. 4, the uranyl envelope observed in concentration dependent SERS spectra are plotted with corresponding spectral deconvolution. In all spectra above the noise limit, three vibrational features are observed and centred at 851±1 (Γ=18±2), 839±1 (18±2), and 827±1 (18±2) cm−1. Assignments are shown in the insets for Fig. 4 and are UO2(bidentate-COO), UO2(monodentate-COO)(bidentate-COO), and UO2(OH)(bidentate-COO), respectively. These are based on water-soluble uranyl species initially present, the presence of carboxylate, and previously published vibrational frequencies for uranyl and their dependence on ligand coordination. For instance, the two most abundant uranyl species at pH 5 are UO22+ and UO2OH+ (see Fig. 2d) and exhibit vibrational frequencies at 870±114, 24, 53 and 848±224, 54 cm−1, respectively. Because monodentate and bidentate carboxylate ligand coordination induce ~13 and ~24 cm−1 red-shifts, respectively,50 the assignments are made (Table 1). It should be noted that UO2(bidentate-COO) complexes can arise from either direct coordination between carboxylate and UO22+ or via ligand exchange of OH− in UO2OH+ by carboxylate.
Fig. 4.
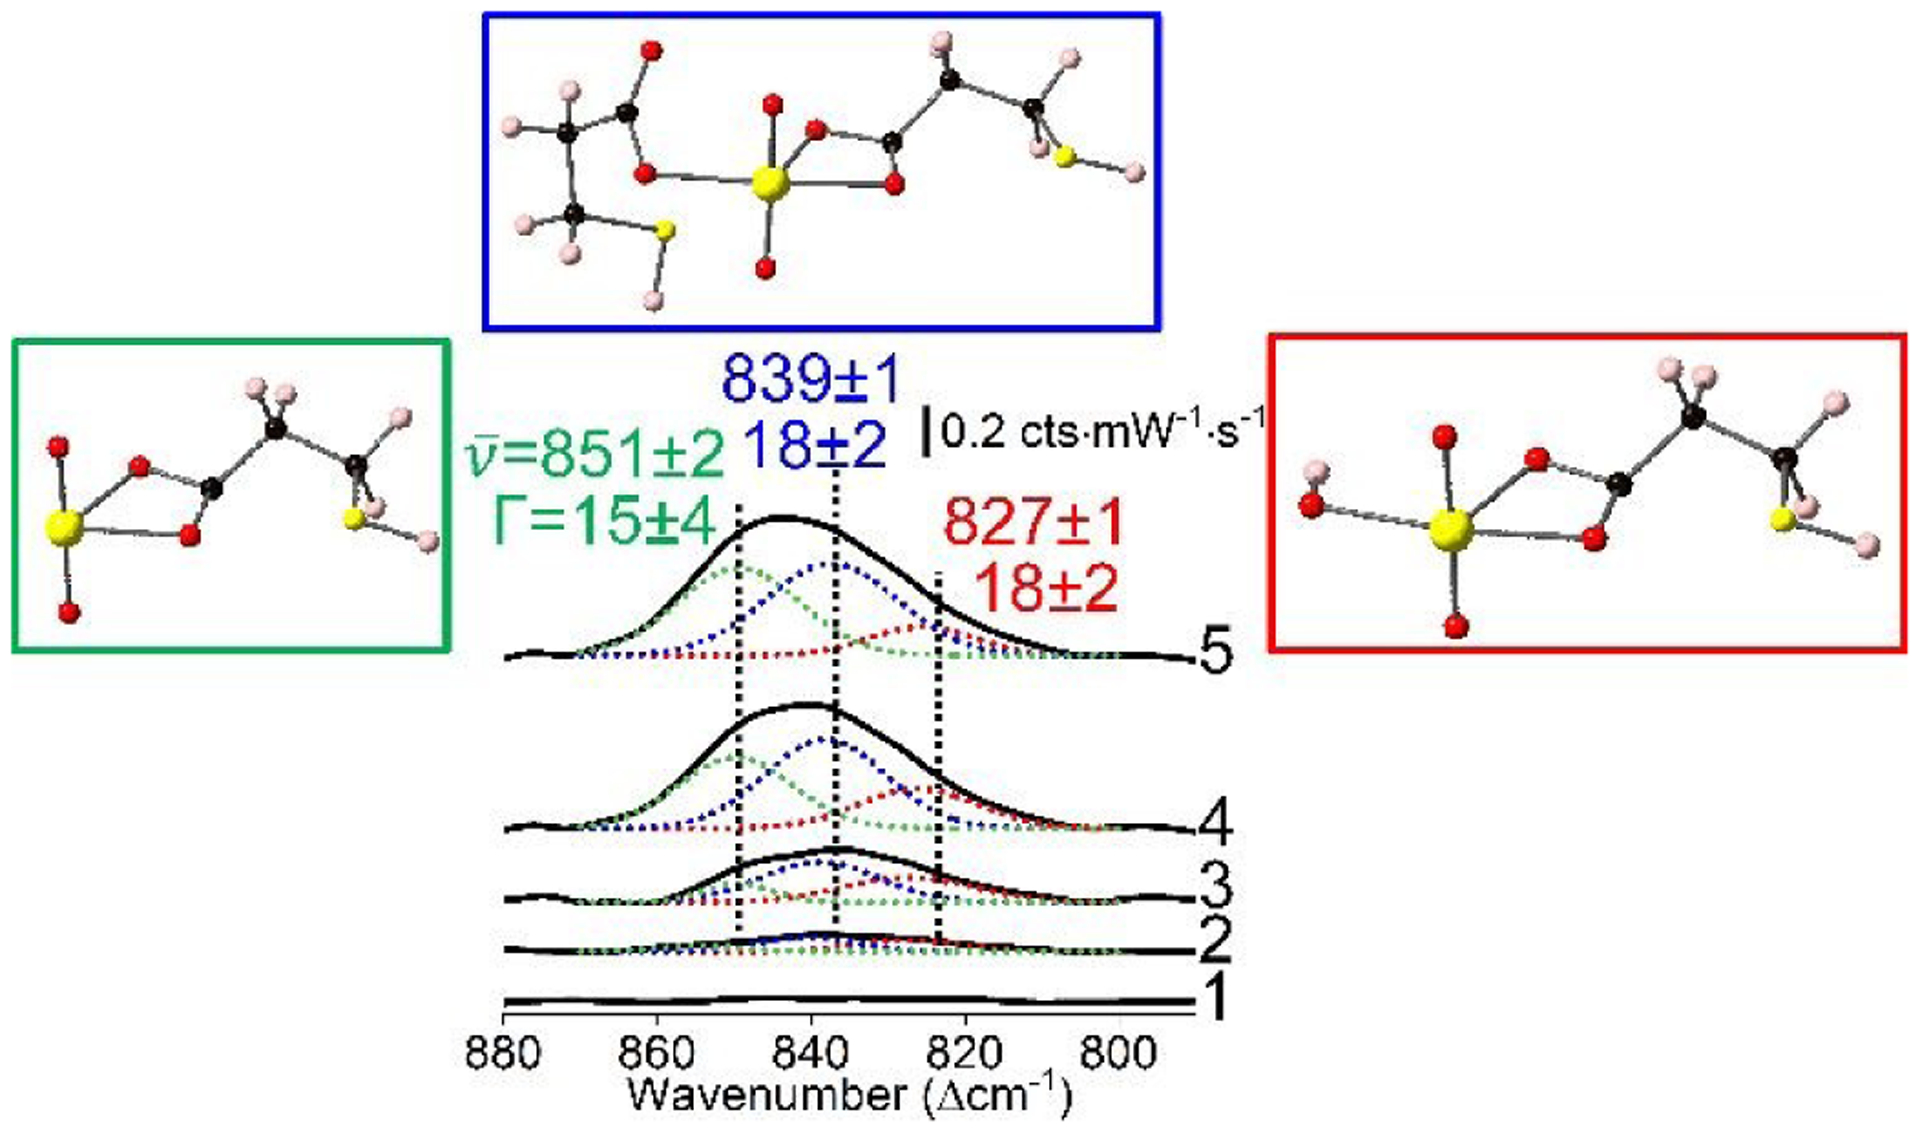
SERS spectra and deconvolution of the uranyl envelope for (1) 0, (2) 0.11, (3) 0.33, (4) 3.3, and (5) 13.6 μM uranyl. Most likely species are shown and are UO2(bi-COO)+, UO2(mono-COO)(bi-COO), and UO2(OH)(bi-COO) at 851, 839, and 827 cm−1, respectively. Same parameters as Fig. 3.
Table 1.
Vibrational Band Analysis and Corresponding Uranyl Speciation Assignments.
| Raman | SERS | (Δcm−1) | ||
|---|---|---|---|---|
| Solution Species | (Δcm−1) | Assignment | (Δcm−1) | |
| UO22+ | 870±1 | UO2(bi-COO)+ | 851±1 | 19±1 |
| UO2OH+ | 848±2 | 3±2 | ||
| UO22+ | 870±1 | UO2(mono-COO)(bi-COO) | 839±1 | 31±1 |
| UO2OH+ | 848±2 | 9±2 | ||
| UO2OH+ | 848±2 | UO2OH(mono-COO) | 827±1 | 21±2 |
pH-Dependent Uranyl Detection and Coordination
Previously, carboxylated gold nanostars were used for successful uranyl detection using SERS.27, 28 Quantitative detection, however, was limited to basic solutions where gold nanostar stability was maintained. Furthermore, uranyl speciation is highly pH dependent,54 which can impact solubility and detectability. Silica membrane-encapsulated nanoparticles have the potential to expand the range of solution pHs in which plasmonic stability is retained because the isoelectric point of silica is ~2.55 Here, carboxylated IE Ag@Au@SiO2 nanoparticles are incubated in uranyl solutions with pHs ranging from 3–7. SERS measurements are then evaluated as a function of time to evaluate implications on detection.
The advantages of incorporating silica membranes on Ag@Au nanoparticle for improved stability is demonstrated in Fig. 5. In this study, carboxylated Ag@Au nanoparticles and those encapsulated by silica membranes are suspended in buffers ranging in pH from 3–7, and LSPR spectra are collected. This pH range was selected as it straddles the pKa of the carboxylate group.48 Both nanoparticle samples show nearly identical and pH independent LSPR spectra when the pH is above the pKa (that is, above 5). At more acidic pHs, the non-silica coated nanostructures exhibit plasmonic changes consistent with aggregation because of MPA protonation and neutralized surface potential. These plasmonic variations are quantified by evaluating changes in λmax, Γ, and flocculation area from 850–950 nm. In contrast, pH does not influence the plasmonic properties and stability of the silica membrane stabilized nanostructures. Slight (<2 nm) variations in the λmax are observed over the course of 1 hour thereby suggesting these nanostructures are both chemically and physically stable. Spectral comparisons are shown in Fig. 5c and 5d. These results encourage the further investigation of silica membrane encapsulated nanoparticles for uranyl detection.
Fig. 5.
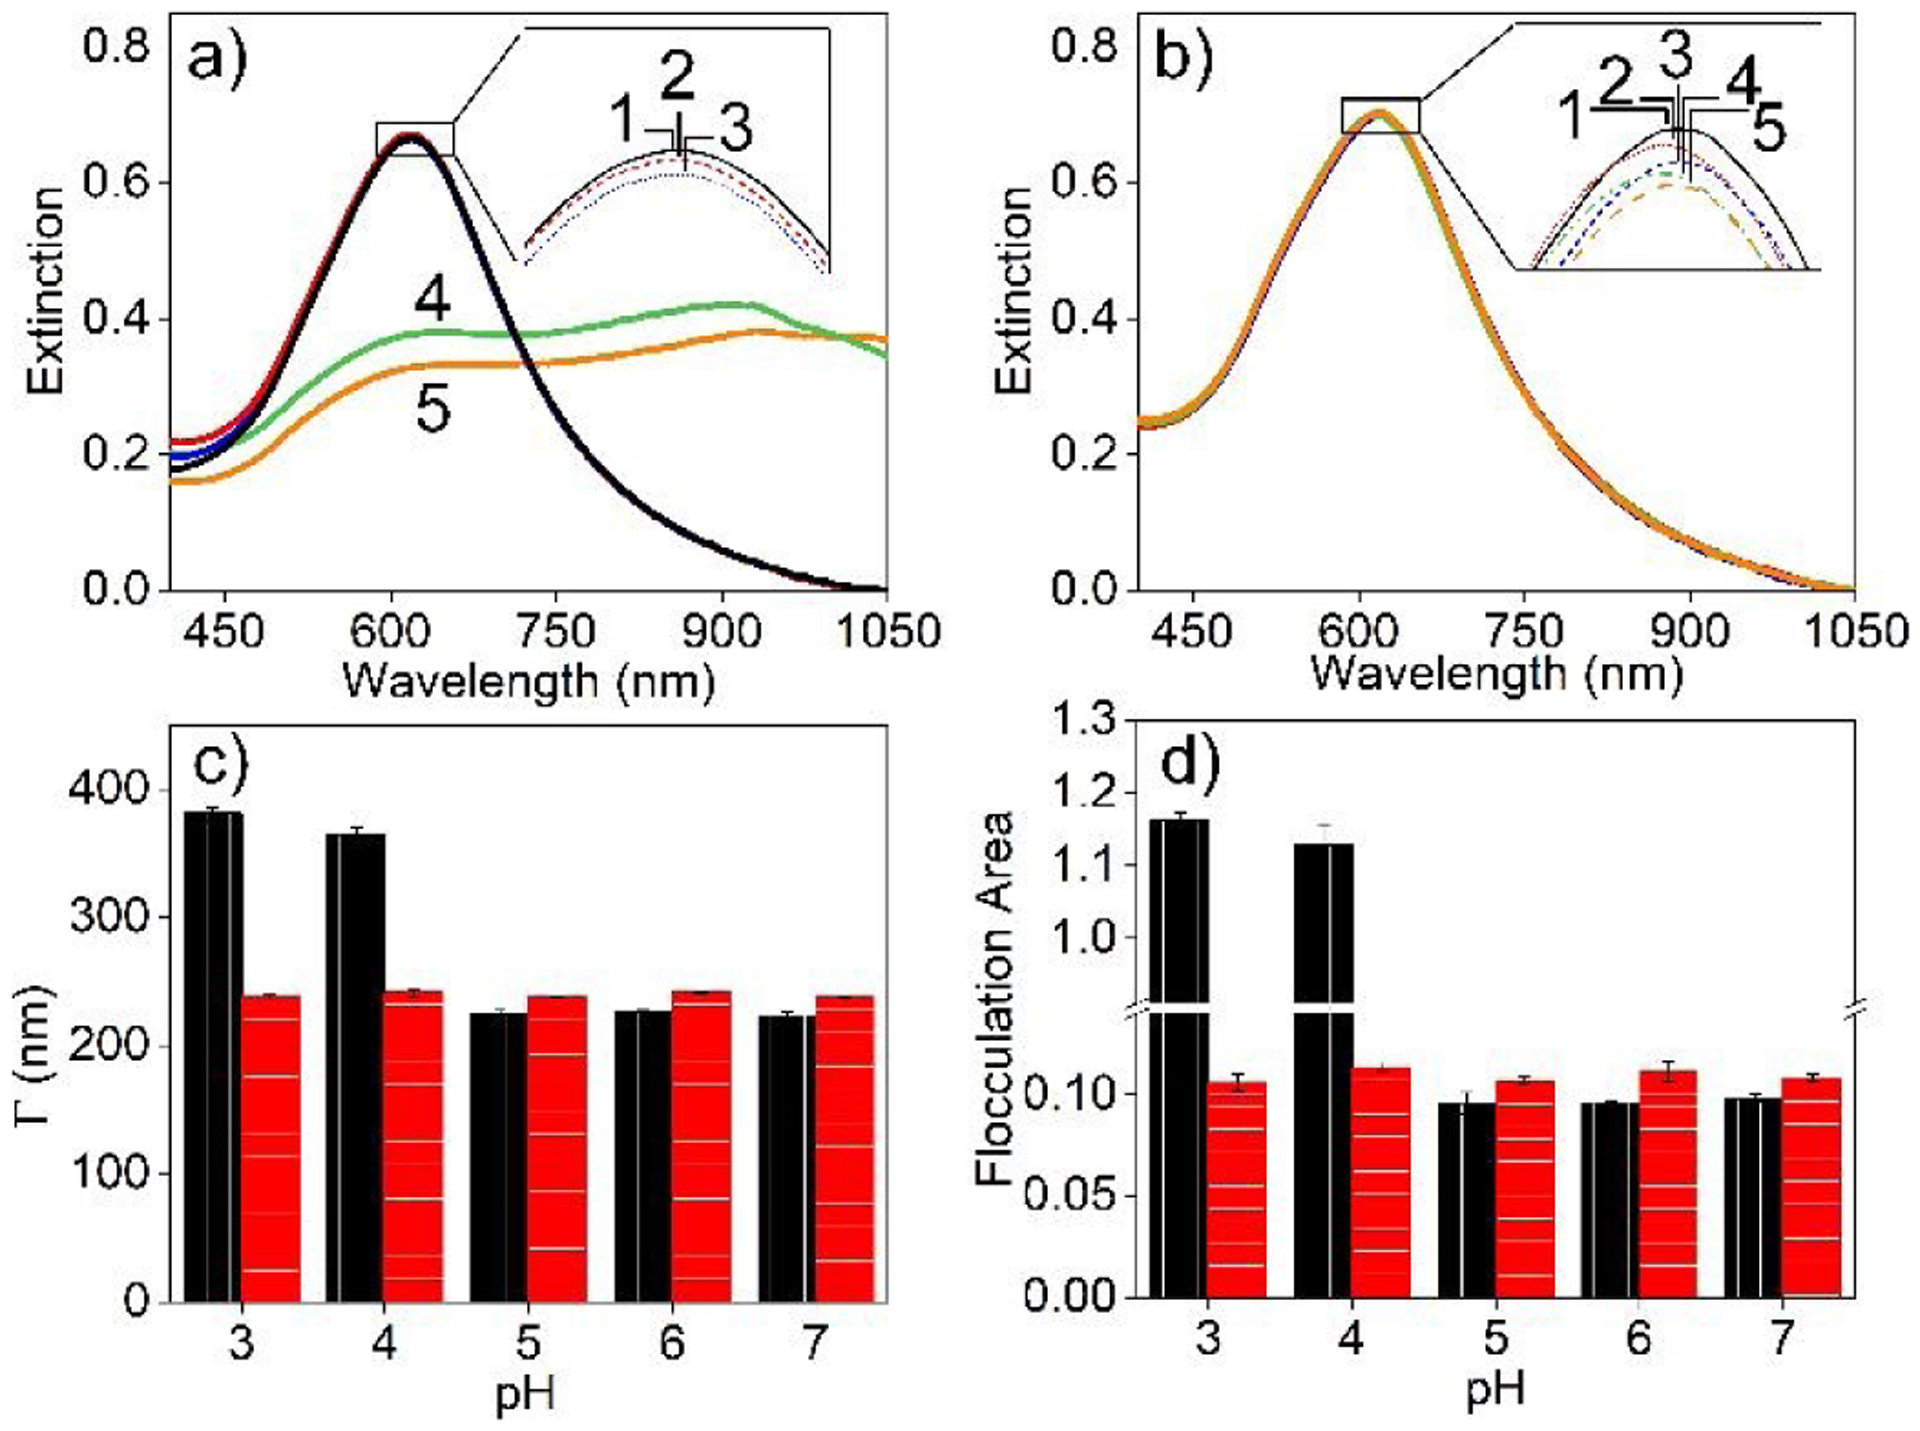
LSPR spectra of (a) carboxylated Ag@Au and (b) carboxylated IE Ag@Au@SiO2 nanoparticles incubated at pH (1) 7, (2) 6, (3) 5, (4) 4, and (5) 3. All samples were incubated for 1 hr except Ag@Au nanoparticle at pH 3 and 4, which were incubated for 1 min. Incubation conditions: 10 mM EPPS and 10 mM ionic strength. Comparison of spectral (c) Γ for the feature centered at ~600 nm and (d) relative flocculation area (ratio of spectral area from 850–950 to 560–660 nm) for carboxylated (black) Ag@Au and (red) IE Ag@Au@SiO2 nanoparticles.
Both uranyl concentration and MPA protonation affect uranyl binding kinetics and detection using carboxylated IE Ag@Au@SiO2 nanoparticles. Example time dependent SERS spectra of 2 μM uranyl are shown in Fig. 6a. These spectra are deconvoluted as previously described revealing three main features centred at 851, 840, and 826 cm−1. For simplicity and because the result is not influenced by finer evaluation, total uranyl band area is included and summarized in Fig. 6b. Three observations are noted. First, uranyl is rapidly detected for all solutions except at pH 3 (because MPA is protonated (Fig. 6c), which reduces the likelihood of uranyl coordination).29, 50 Second, the SERS signal for uranyl varies by less than 13% from 1–8 min. This further supports that uranyl coordination occurs rapidly then undergoes slight structural or chemical changes as the system equilibrates. Third, SERS signals for uranyl increases from pH 3 to 6 then decreases at pH 7. These observations are attributed to increasing relative amounts of carboxylate (vs. carboxylic acid) on the gold surface and decreasing soluble uranyl concentration, respectively. A similar result was previously observed,54 which we attribute to varying concentrations of these uranyl complexes at equilibrium. While pH impacts both nanoparticle surface potential and uranyl solubility, systematic and reproducible responses are observed.
Fig. 6.
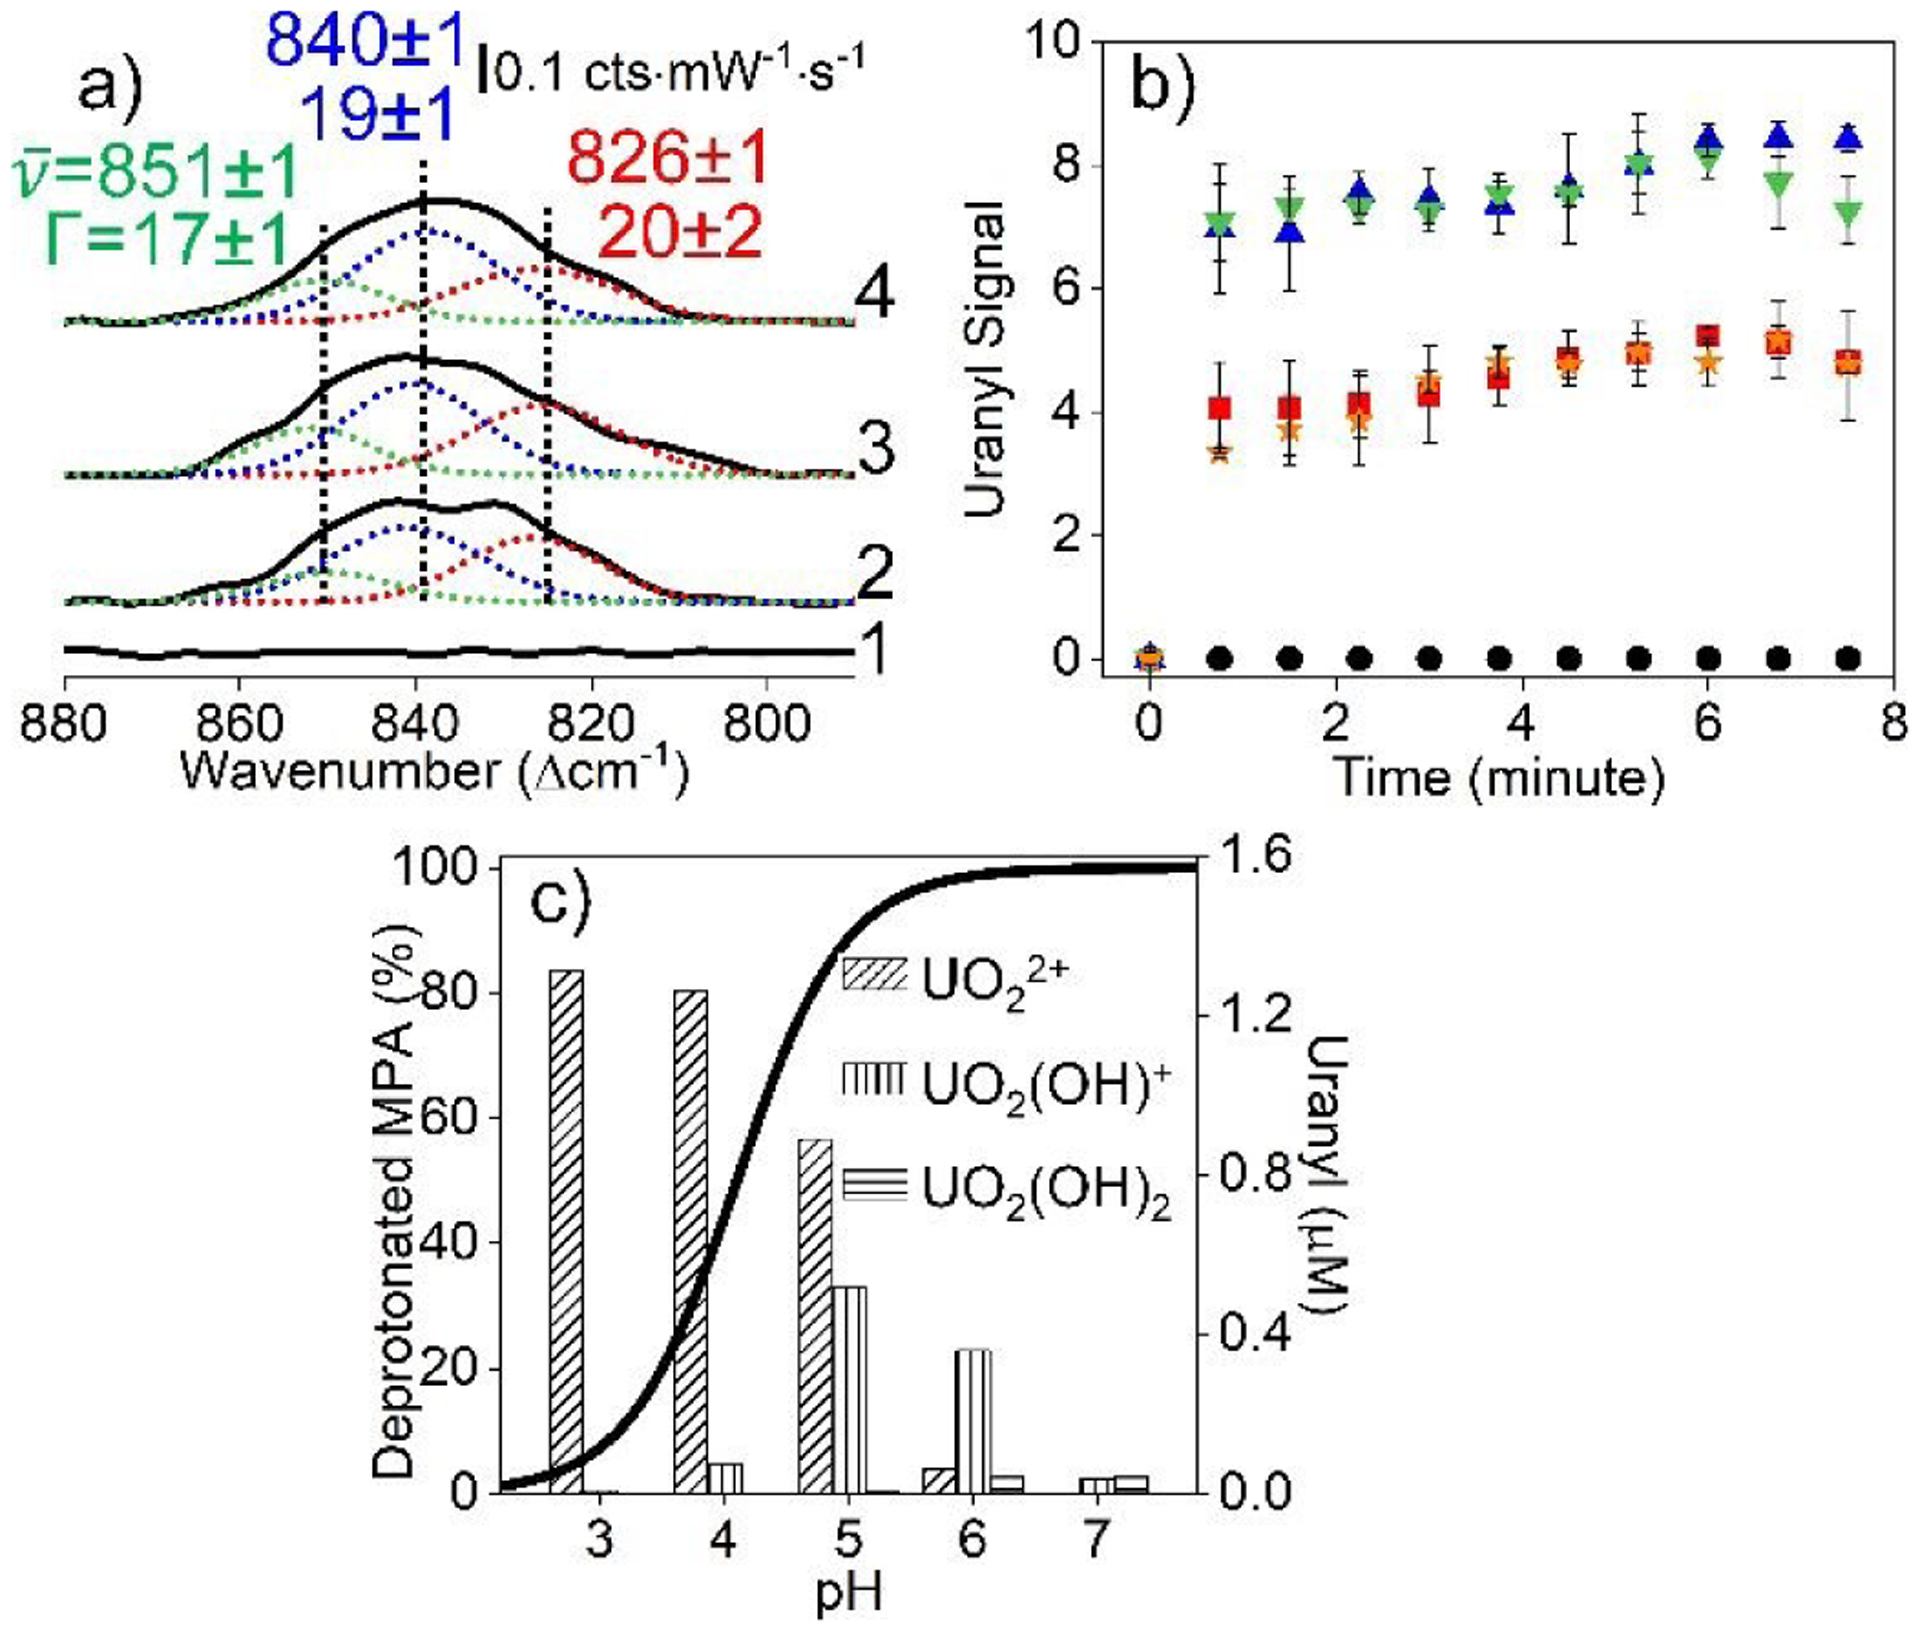
(a) SERS spectral deconvolution of the uranyl window (1) before and after uranyl addition for (2) 1, (3) 2, and (4) 8 min. Experimental conditions: λex = 785 nm, tint = 30 s, P = 40 mW, 10 mM EPPS buffer (pH 6 and 10 mM ionic strength, 0.7 nM carboxylated IE Ag@Au@SiO2 nanoparticles. (b)Time-dependent SERS signals (area) for total uranyl signal (area from 870 – 800 cm−1) at pH (black circle) 3, (red square) 4, (blue triangle) 5, (green upside down triangle) 6, and (orange star) 7. (c) Estimated MPA deprotonation using the Henderson–Hasselbalch equation (surface pKa = 4.3). The right axis is the theoretical equilibrium concentrations of soluble uranyl species (uranyl concentration = 2 μM, ionic strength = 10 mM).
Influence of Ionic Strength and Temperature on Carboxylated IE Ag@Au@SiO2 Nanoparticles for SERS Detection of Uranyl
SERS detection of uranyl is influenced by nanoparticle stability. For instance, increasing ionic strength causes double layer thickness surrounding the nanostructures to decrease thereby inducing nanoparticle aggregation and as result, fluctuations in SERS signals.11, 12 Silica membrane encapsulation of SERS-active nanoparticles has the potential to minimize plasmonic implications, an impact we compare here. To do so, both carboxylated Ag@Au and IE Ag@Au@SiO2 nanoparticles are incubated with uranyl in 10 mM EPPS at pH 7 from 10–150 mM ionic strength, and LSPR and SERS spectra are monitored. While larger SERS signals are detected in more acidic solutions, uranyl speciation varies less at pH 7 thus improving the robustness. As shown in Fig. 7a, carboxylated Ag@Au nanoparticles are only optically stable below 100 mM then begin to aggregate. This is evident from the ~35 nm red-shift in λmax, ~70% decrease in extinction magnitude at the λmax, ~70% increase in Γ, and a 600% increase in flocculation area from 850 to 950 nm. These trends are qualitatively similar to pH-induced nanoparticle instabilities. In contrast, silica membrane stabilized nanostructures reveal no plasmonic variations at these same ionic strengths (Fig. 7b) for at least an hour. This suggests that the silica membrane stabilized nanostructures are ideal for SERS detection of uranyl. SERS difference spectra further support the assertion that uranyl detection is not impacted by varying ionic strength. These data are summarized in Fig. 7c and 7d. As ionic strength increases, neither carboxylate nor uranyl features vary significantly. While uranyl signal varies slightly at the highest ionic strength, this change is not significantly different from other measurements to a 99% confidence interval.
Fig. 7.
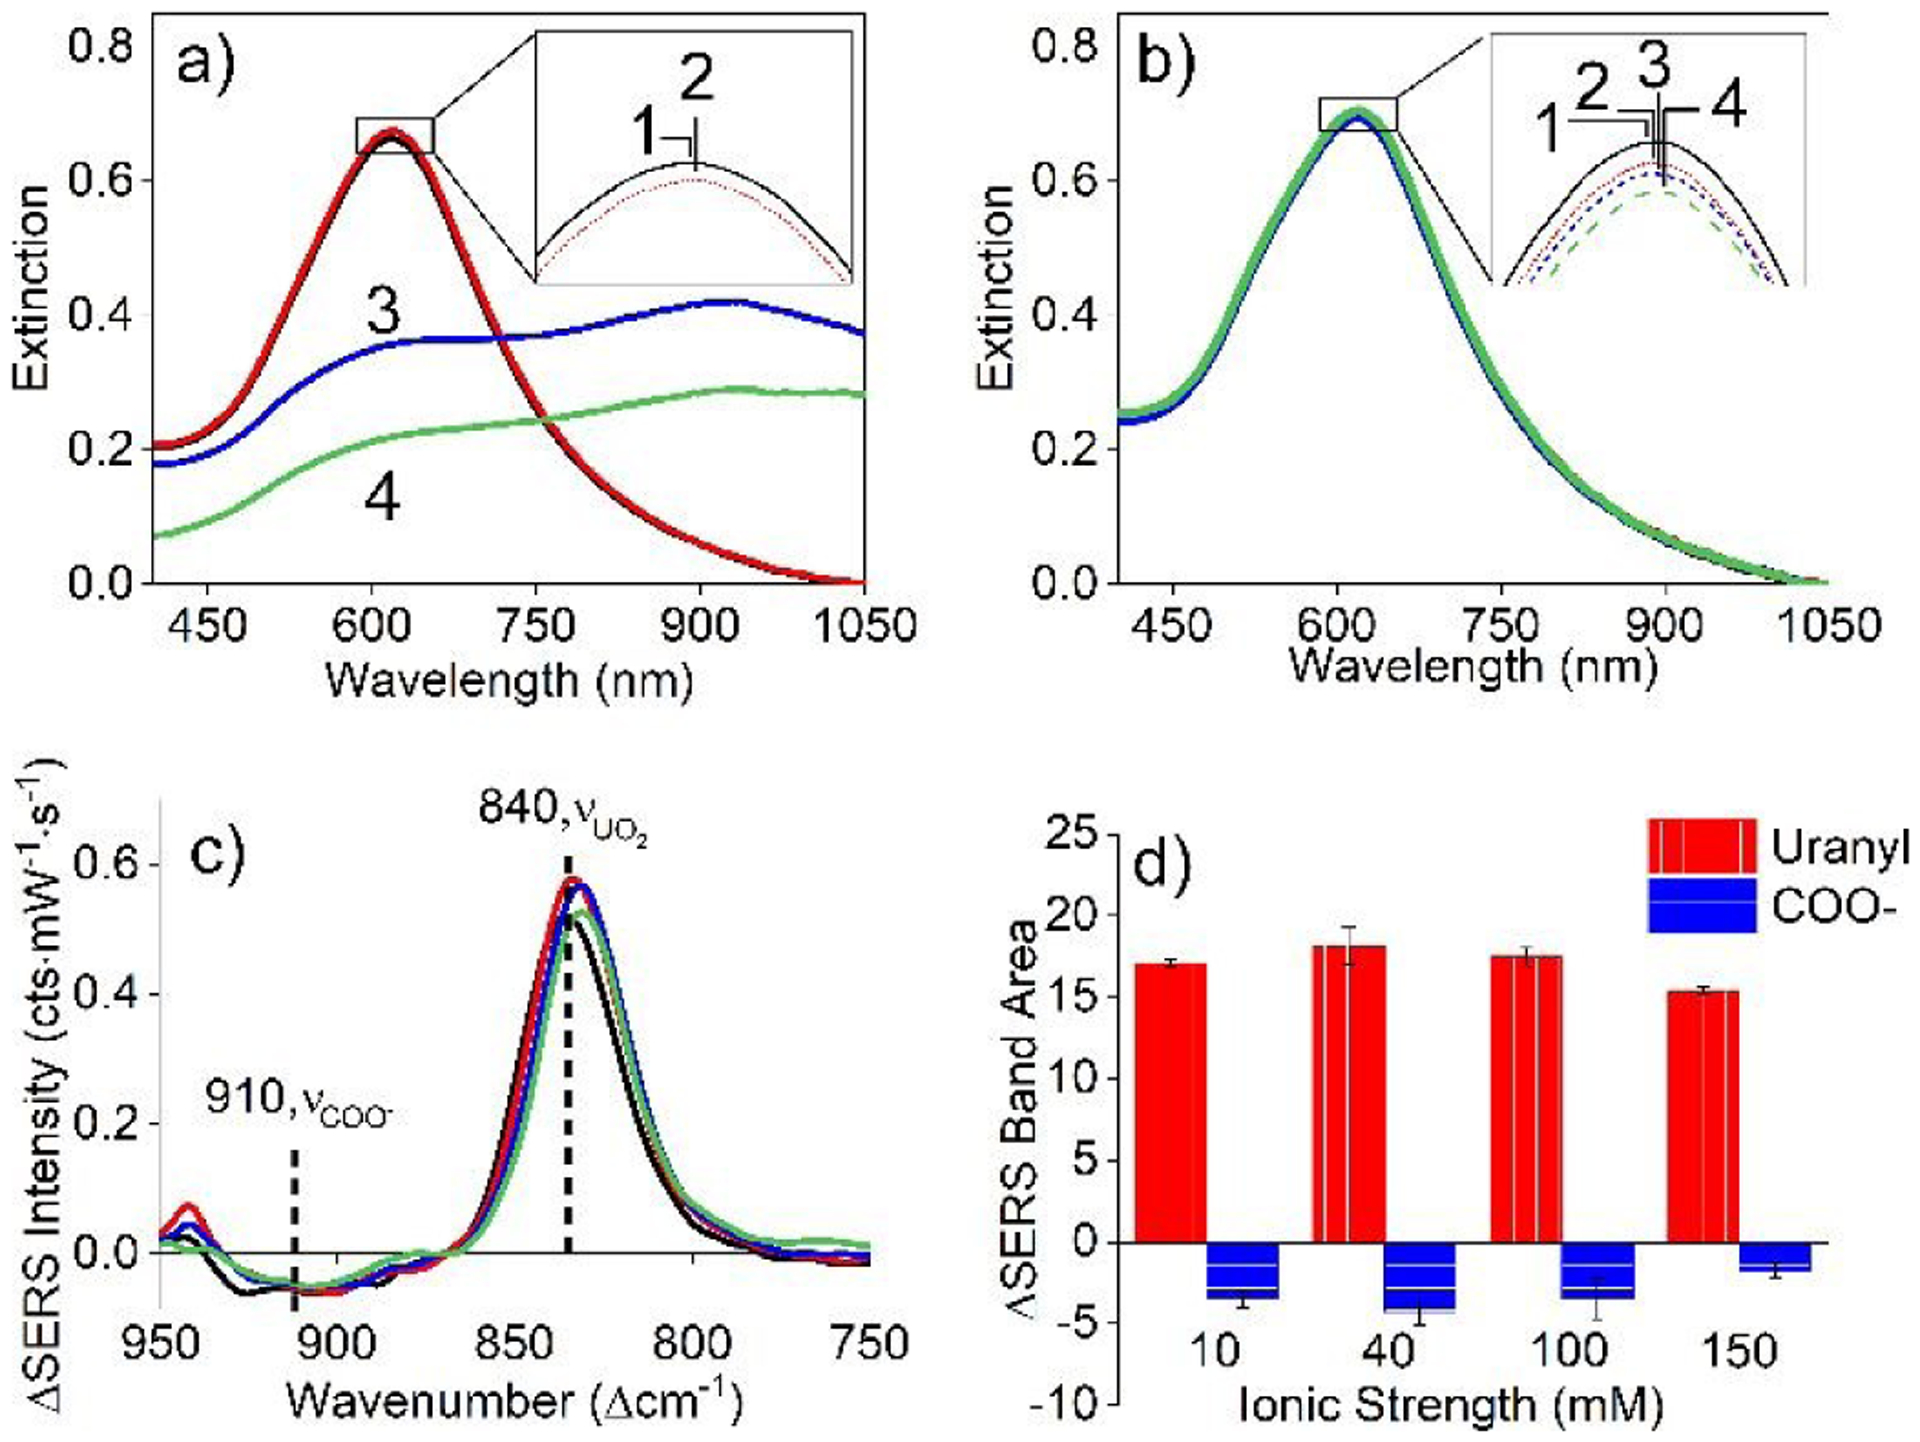
(a) LSPR spectra of carboxylated Ag@Au nanoparticles at (1) 10 and (2) 40 mM ionic strengths after 1 hr and (3) 100 and (4) 150 mM after 1 min. (b) LSPR spectra of carboxylated IE Ag@Au@SiO2 nanoparticles at (1) 10, (2) 40, (3) 100, and (4) 150 mM ionic strengths for 1 hr. Incubation conditions: 10 mM EPPS at pH 7. (c) SERS difference spectra for 13.6 μM uranyl at (1) 10, (2) 40, (3) 100, and (4) 150 mM ionic strengths. SERS conditions: λex = 785 nm, tint = 30 s, P = 40 mW, 10 mM EPPS buffer (pH 7). (d) Analysis of ionic strength dependent spectral changes for (red, vertical lines) uranyl and (blue, horizontal lines) carboxylate using carboxylated IE Ag@Au@SiO2 nanoparticles.
A second parameter that can also influence nanoparticle stability is temperature. Previously, silica dissolution was promoted with prolonged incubation (i.e., 9 hours) at 37°C.56 Here, we systematically monitor impacts of silica membrane dissolution from 23 to 37°C on the stability and SERS activity of carboxylated IE Ag@Au@SiO2 nanoparticles. In this study, IE Ag@Au@SiO2 nanoparticles are incubated in 10 mM EPPS (pH 7, ionic strength = 10 mM) at each temperature, and LSPR spectra are collected over the course of 10 hrs. Subsequently, MPA functionalization is performed, and the materials are utilized for SERS detection of 2 μM uranyl using the same buffer conditions used for temperature equilibration.
As shown in Fig. 8a, temperature induces a slight impact on silica morphology but does not significantly alter SERS activity. For instance, silica membranes are still present after incubation at 37°C for 10 hours. Furthermore, the LSPR spectra for IE Ag@Au@SiO2 nanoparticles are nearly indistinguishable after 10 hrs of equilibration at 23–37°C. As shown in Fig. 8b, only two slight variations are noted upon thermal treatment. First, the λmax initially shifts +1 nm upon equilibration at temperatures less than 29°C then blue shifts 1–2 nm. These small shifts indicates minor changes in silica density. Second, a ~4 nm blue shift is observed for the λmax for samples incubated at the two highest temperatures. As shown in Fig. 8c, the local refractive index decreases by ~0.03, a change that indicates a slight decrease in silica density from 2.07 to 1.92 g/cm3.41
Fig. 8.
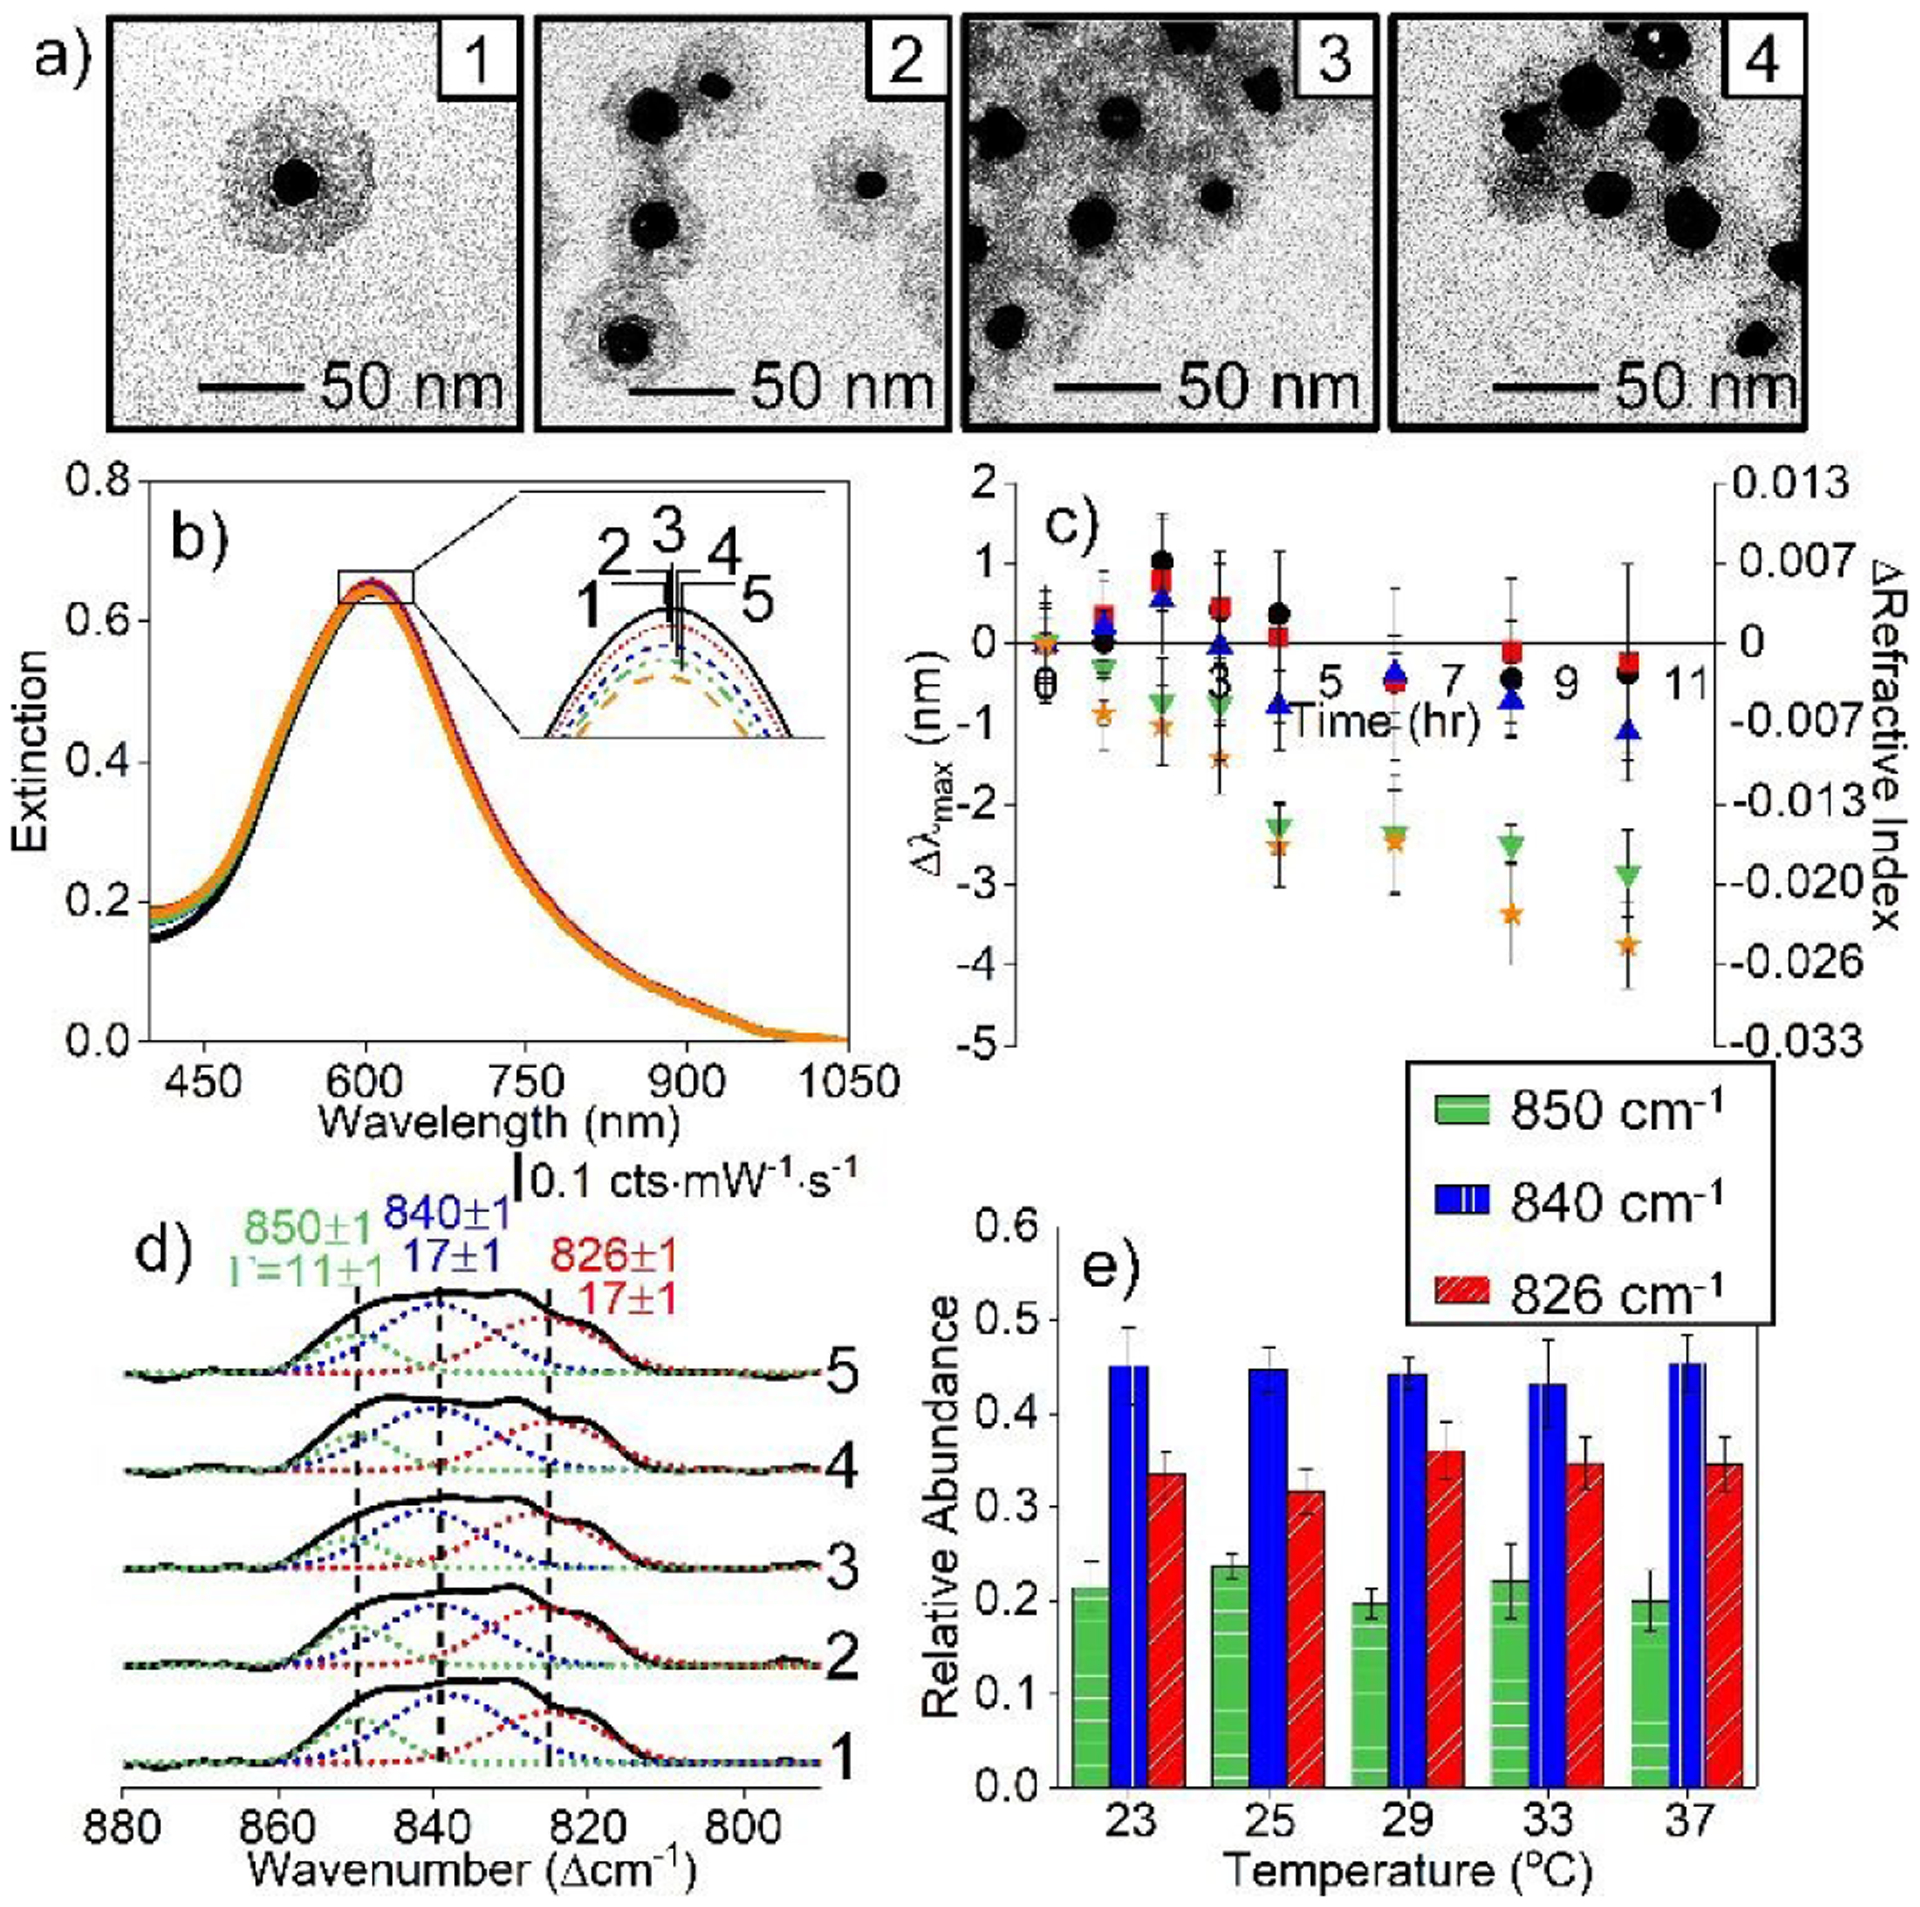
(a) TEM of IE Ag@Au@SiO2 nanoparticles after incubating in 10 mM EPPS (pH 7 and ionic strength of 10 mM) at (1) 23, (2) 29, (3) 33, and (4) 37°C for 10 hours. (b) LSPR spectra of IE Ag@Au@SiO2 nanoparticles for 10 hours and (c) time-dependent Δλmax in 10 mM EPPS (pH 7) at (circle) 23, (square) 25, (triangle) 29, (upside down triangle) 33, and (star) 37°C. (d) Representative deconvoluted SERS spectra and (E) Change in relative signals at vibrational frequencies of 826 (red), 840 (blue), and 850 cm−1 (green) as a function of incubation temperature (10 hours). Same experimental parameters as in other figures.
Despite slight silica morphology changes, these materials can still be carboxylated and used for uranyl detection. Representative SERS difference spectra and uranyl signal analysis are shown in Fig. 8d and 8e, respectively. These data support that uranyl detection is successful even after the nanomaterials are challenged thermally at temperatures from 23–37°C. That is, the three uranyl vibrational features at 850, 840, and 826 cm−1 are consistently observed and their relative abundances do not change. The total uranyl signals for each nanoparticle sample are not statistically different except when the nanostructures were equilibrated at the highest temperature (see Fig. 8c). All in all, these studies illustrate an important development for SERS-based nanosensors through materials engineering and evaluation of both the surface ligand and analyte signals.
Conclusions
Microporous silica membranes maintain the plasmonic properties of carboxylated Ag@Au nanoparticles and promote SERS activity of uranyl in a wide range of pHs, ionic strengths, and temperatures. Signal transduction depends on both the protonation state of MPA as well as uranyl solubility. Four important conclusions were made. First, uranyl detection down to ~110 nM was detected, a value below toxic uranyl concentrations. Second, uranyl coordination and detection occurs within one minute and depends on the pH-dependent soluble uranyl concentrations and the fraction of protonated MPA. SERS activity arising from the composite nanoparticles was successfully monitored using synergistic changes in both surface ligands and uranyl, whereas nanoparticles without silica membranes readily aggregated. Third, carboxylated IE Ag@Au@SiO2 nanoparticles retained both their plasmonic stability and SERS activity at all ionic strengths studied. Finally, silica dissolution was insignificant at temperatures up to 37°C for at least 10 hours. Slight silica dissolution was apparent at the highest temperature (37°C), a result consistent with previous silica stability studies. Importantly, the detection of relative amounts of uranyl was not impacted. All in all, microporous silica membrane stabilized plasmonic nanoparticles exhibit robust and tunable properties that can be exploited for SERS based sensing; however, this application is limited by inherent uranyl solubility and MPA protonation.
Acknowledgements
This work was funded by the National Institute of Environmental Health Sciences of the National Institutes of Health (R01ES027145). This research was facilitated by the IR/D (Individual Research and Development) program associated with AJH’s appointment at the National Science Foundation.
Footnotes
Conflicts of interest
There are no conflicts to declare.
References
- 1.Maher R, in Raman Spectroscopy for Nanomaterials Characterization, ed. Kumar CSR, Springer-Verlag Berlin Heidelberg, Germany, 2012, DOI: 10.1007/978-3-642-20620-7_10, ch. 10, pp. 215–260. [DOI] [Google Scholar]
- 2.Haes AJ, Haynes CL, McFarland AD, Schatz GC, van Duyne RP and Zou S, MRS Bull, 2005, 30, 368–375. [Google Scholar]
- 3.Phan HT and Haes AJ, J. Phys. Chem. C, 2019, 123, 16495–16507. [DOI] [PMC free article] [PubMed] [Google Scholar]
- 4.Sun F, Galvan DD, Jain P and Yu Q, Chem. Commun, 2017, 53, 4550–4561. [DOI] [PubMed] [Google Scholar]
- 5.Ajitha B, Kumar Reddy YA, Reddy PS, Jeon H-J and Ahn CW, RSC Advances, 2016, 6, 36171–36179. [Google Scholar]
- 6.Velasco-Aguirre C, Morales F, Gallardo-Toledo E, Guerrero S, Giralt E, Araya E and Kogan MJ, Int. J. Nanomedicine, 2015, 10, 4919–4936. [DOI] [PMC free article] [PubMed] [Google Scholar]
- 7.Sanghi R and Verma P, Bioresour. Technol, 2009, 100, 501–504. [DOI] [PubMed] [Google Scholar]
- 8.Jiang L, Guan J, Zhao L, Li J and Yang W, Colloids Surf. Physicochem. Eng. Aspects, 2009, 346, 216–220. [Google Scholar]
- 9.Shim J-Y and Gupta VK, J. Colloid Interface Sci, 2007, 316, 977–983. [DOI] [PubMed] [Google Scholar]
- 10.Guan J, Jiang L, Li J and Yang W, J. Phys. Chem. C, 2008, 112, 3267–3271. [Google Scholar]
- 11.Kong C, Gao L and Chen Z, Microchim. Acta, 2018, 185, 488. [DOI] [PubMed] [Google Scholar]
- 12.Sun M, Liu F, Zhu Y, Wang W, Hu J, Liu J, Dai Z, Wang K, Wei Y, Bai J and Gao W, Nanoscale, 2016, 8, 4452–4457. [DOI] [PubMed] [Google Scholar]
- 13.Wang J, Li YF, Huang CZ and Wu T, Anal. Chim. Acta, 2008, 626, 37–43. [DOI] [PubMed] [Google Scholar]
- 14.Lu G, Forbes TZ and Haes AJ, Anal. Chem, 2016, 88, 773–780. [DOI] [PubMed] [Google Scholar]
- 15.Phan HT and Haes AJ, J. Phys. Chem. C, 2018, 122, 14846–14856. [Google Scholar]
- 16.Lu G, Shrestha B and Haes AJ, J. Phys. Chem. C, 2016, 120, 20759–20767. [Google Scholar]
- 17.Shrestha KB and Haes JA, J. Opt, 2015, 17, 114017. [Google Scholar]
- 18.Liz-Marzán LM, Giersig M and Mulvaney P, Langmuir, 1996, 12, 4329–4335. [Google Scholar]
- 19.Zhang W, Zu L, Kong B, Chen B, He H, Lan K, Liu Y, Yang J and Zhao D, iScience, 2018, 3, 149–160. [DOI] [PMC free article] [PubMed] [Google Scholar]
- 20.Liang X, Wang Y-S, You T-T, Zhang X-J, Yang N, Wang G-S and Yin P-G, Nanoscale, 2017, 9, 8879–8888. [DOI] [PubMed] [Google Scholar]
- 21.Liang X, Liang B, Pan Z, Lang X, Zhang Y, Wang G, Yin P and Guo L, Nanoscale, 2015, 7, 20188–20196. [DOI] [PubMed] [Google Scholar]
- 22.Gao R, Liang X, Yin P, Wang J, Lee YL, Hu Z and Liu X, Nano Energy, 2017, 41, 535–542. [Google Scholar]
- 23.Yang J, Shen D, Wei Y, Li W, Zhang F, Kong B, Zhang S, Teng W, Fan J, Zhang W, Dou S and Zhao D, Nano Research, 2015, 8, 2503–2514. [Google Scholar]
- 24.Nguyen Trung C, Begun GM and Palmer DA, Inorg. Chem, 1992, 31, 5280–5287. [Google Scholar]
- 25.Journal, 2015.
- 26.Lu G, Haes AJ and Forbes TZ, Coord. Chem. Rev, 2018, 374, 314–344. [DOI] [PMC free article] [PubMed] [Google Scholar]
- 27.Lu G, Johns AJ, Neupane B, Phan HT, Cwiertny DM, Forbes TZ and Haes AJ, Anal. Chem, 2018, 90, 6766–6772. [DOI] [PMC free article] [PubMed] [Google Scholar]
- 28.Lu G, Forbes TZ and Haes AJ, Analyst, 2016, 141, 5137–5143. [DOI] [PubMed] [Google Scholar]
- 29.Trujillo MJ and Camden JP, ACS Omega, 2018, 3, 6660–6664. [DOI] [PMC free article] [PubMed] [Google Scholar]
- 30.Jiang J, Wang S, Deng H, H. W, J. C and Liao J, Royal Soc. Open Sci, 2018, 5, 181099. [DOI] [PMC free article] [PubMed] [Google Scholar]
- 31.Trujillo MJ, Jenkins DM, Bradshaw JA and Camden JP, Anal. Methods, 2017, 9, 1575–1579. [Google Scholar]
- 32.Harder RA, Wijenayaka LA, Phan HT and Haes AJ, J. Raman Spectrosc, 2020, n/a. [DOI] [PMC free article] [PubMed] [Google Scholar]
- 33.Jiang J, Zhao F, Shi S, Du Y, Chen J, Wang S, Xu J, Li C and Liao J, ACS omega, 2019, 4, 12319–12324. [DOI] [PMC free article] [PubMed] [Google Scholar]
- 34.Jiang J, Ma L, Chen J, Zhang P, Wu H, Zhang Z, Wang S, Yun W, Li Y, Jia J and Liao J, Microchim. Acta, 2017, 184, 2775–2782. [Google Scholar]
- 35.Cui Y, Ren B, Yao J-L, Gu R-A and Tian Z-Q, J. Phys. Chem. B, 2006, 110, 4002–4006. [DOI] [PubMed] [Google Scholar]
- 36.Srnova-Sloufova I, Vlckova B, Bastl Z and Hasslett TL, Langmuir, 2004, 20, 3407–3415. [DOI] [PubMed] [Google Scholar]
- 37.Paramelle D, Sadovoy A, Gorelik S, Free P, Hobley J and Fernig DG, Analyst, 2014, 139, 4855–4861. [DOI] [PubMed] [Google Scholar]
- 38.Roca M and Haes AJ, J. Am. Chem. Soc, 2008, 130, 14273–14279. [DOI] [PubMed] [Google Scholar]
- 39.Stöber W, Fink A and Bohn E, J. Colloid Interface Sci, 1968, 26, 62–69. [Google Scholar]
- 40.Yao T, Luthjens LH, Gasparini A and Warman JM, Radiat. Phys. Chem, 2017, 133, 37–44. [Google Scholar]
- 41.Volkert AA, Pierre MCS, Shrestha B and Haes AJ, RSC Advances, 2015, 5, 3774–3780. [Google Scholar]
- 42.Chen H, Kou X, Yang Z, Ni W and Wang J, Langmuir, 2008, 24, 5233–5237. [DOI] [PubMed] [Google Scholar]
- 43.Tao Y, Guo Z, Zhang A, Zhang J, Wang B and Qu S, Opt. Commun, 2015, 349, 193–197. [Google Scholar]
- 44.Tuersun P, Optik, 2016, 127, 250–253. [Google Scholar]
- 45.Zegke M, Zhang X, Pidchenko I, Hlina JA, Lord RM, Purkis J, Nichol GS, Magnani N, Schreckenbach G, Vitova T, Love JB and Arnold PL, Chem. Sci, 2019, 10, 9740–9751. [DOI] [PMC free article] [PubMed] [Google Scholar]
- 46.Serezhkina LB, Vologzhanina AV, Klepov VV and Serezhkin VN, Crystallogr. Rep, 2010, 55, 773–779. [Google Scholar]
- 47.Phan HT, Heiderscheit TS and Haes AJ, J. Phys. Chem. C, 2020, 124, 14287–14296. [DOI] [PMC free article] [PubMed] [Google Scholar]
- 48.Kesal D, Christau S, Krause P, Möller T and Von Klitzing R, Polymers, 2016, 8, 134. [DOI] [PMC free article] [PubMed] [Google Scholar]
- 49.Ho WKH, Bao ZY, Gan X, Wong K-Y, Dai J and Lei D, The J. Phys. Chem. Letters, 2019, 10, 4692–4698. [DOI] [PubMed] [Google Scholar]
- 50.Quilès F and Burneau A, Vib. Spectrosc, 1998, 18, 61–75. [Google Scholar]
- 51.Yamaguchi A, Mekawy MM, Chen Y, Suzuki S, Morita K and Teramae N, J. Phys. Chem. B, 2008, 112, 2024–2030. [DOI] [PubMed] [Google Scholar]
- 52.Pierre MCS, Mackie PM, Roca M and Haes AJ, J. Phys. Chem. C, 2011, 115, 18511–18517. [Google Scholar]
- 53.Gál M, Goggin PL and Mink J, J. Mol. Struct, 1984, 114, 459–462. [Google Scholar]
- 54.Nguyen-Trung C, Palmer DA, Begun GM, Peiffert C and Mesmer RE, J. Solution Chem, 2000, 29, 101–129. [Google Scholar]
- 55.Antonio Alves Júnior J and Baptista Baldo J, NJGC, 2014, 4, 29–37. [Google Scholar]
- 56.Yang S-A, Choi S, Jeon SM and Yu J, Sci. Rep, 2018, 8, 185. [DOI] [PMC free article] [PubMed] [Google Scholar]


