

Abstract
Background:
Long-term alcohol consumption has been linked to structural and functional brain abnormalities. Furthermore, with persistent exposure to ethanol (EtOH), nutrient deficiencies often develop. Thiamine deficiency is a key contributor to alcohol-related brain damage and is suspected to contribute to white matter pathology. The expression of genes encoding myelin proteins in several cortical brain regions is altered with EtOH exposure. However, there is limited research regarding the impact of thiamine deficiency on myelin dysfunction.
Methods:
A rat model was used to assess the impact of moderate chronic EtOH exposure (CET; 20% EtOH in drinking water for one or six months), pyrithiamine-induced thiamine deficiency treatment (PTD), both conditions combined (CET-PTD), or CET with thiamine injections (CET+T) on myelin-related gene expression (Olig1, Olig2, MBP, MAG, and MOG) in the frontal and parietal cortices and the cerebellum.
Results:
The CET-PTD treatments caused the greatest suppression in myelin-related genes in the cortex. Specifically, the parietal cortex was the region that was most susceptible cortical to PTD-CET-induced alterations in myelin-related genes. In addition, PTD treatment, with and without CET, caused minor fluctuations in the expression of several myelin-related genes in the frontal cortex. In contrast, CET alone and PTD alone suppressed several myelin-related genes in the cerebellum. Regardless of the region, there was significant recovery of myelin-related genes with extended abstinence and/or thiamine restoration.
Conclusion:
Moderate chronic EtOH alone had a minor effect on the suppression of myelin-related genes in the cortex; however, when combined with thiamine deficiency, the reduction was amplified. There was a suppression of myelin-related genes following long-term EtOH and thiamine deficiency in the cerebellum. However, the suppression in the myelin-related genes mostly occurred 24-h after EtOH removal or following thiamine restoration; within three weeks of abstinence or thiamine recovery, gene expression rebounded.
Keywords: alcohol, thiamine deficiency, white matter, cortex, cerebellum
1. Introduction
Prolonged excessive alcohol abuse is often accompanied by structural and functional abnormalities of the brain, such as volume reductions in white matter (Harper and Kril, 1985; de la Monte, 1988) and cortical grey matter (Pfefferbaum et al., 1995; Mann et al., 2001), as well as shrinkage of the cerebellum and subcortical structures (Sullivan and Pfefferbaum, 2009; see also Miguel-Hidalgo, 2018 for a review). Furthermore, neuroimaging studies have revealed that two brain networks, the frontocerebellar circuit and Papez’s limbic circuit, are altered in patients with prolonged alcohol use disorder (AUD), compared to healthy controls (Ritz et al., 2016). Although, both white and grey matter damage occurs in several cortical regions (frontal cortex, parietal lobe, cingulate cortex, medial temporal lobe) as well as the cerebellum, in patients with uncomplicated AUD and those with alcohol-related Korsakoff’s syndrome (KS), extended pathology in the thalamus and hypothalamus appears to be a unique signature of KS (Pitel et al., 2012). To investigate circuit-level dysfunction, Segobin et al. (2019) used tractography to segment the thalamus according to its connections to the prefrontal cortex, hippocampus and cerebellum. They found that relative to healthy controls, patients with uncomplicated AUD and KS had comparable atrophy in the thalamic-frontal circuit involved in executive functioning. In contrast, the thalamic-frontal and the thalamic-cerebellar circuit involved in motor functioning were spared following chronic alcohol exposure. Similar to previous work, damage to the anterior thalamus and its connections within the Papez limbic circuit, specifically the hippocampus, were greater in KS patients, relative to patients with uncomplicated AUD, which displayed atrophy compared to healthy controls (see Segobin et al., 2019). Thus, understanding white matter pathology across a range of cortical regions sensitive to alcohol toxicity and thiamine deficiency is critical to solving the puzzle of how different etiologies contribute to the pathophysiology in alcohol-related brain damage.
KS is caused by severe thiamine deficiency, most often associated with chronic alcohol abuse, and can lead to both unrecoverable brain damage and behavioral dysfunction (Arts et al., 2017; Kopelman et al., 2009; Kril and Harper, 2012, Phillips et al., 1990). KS has been replicated using animal models through a variety of treatments, including chronic EtOH treatment (CET), a thiamine-deficient diet alone or combined with CET, a thiamine deficient diet combined with injections of pyrithiamine, called pyrithiamine-induced thiamine deficiency (PTD), and a combination of CET and PTD (Pires et al., 2005; Toledo Nunes et al., 2019; Vedder et al., 2015).
The effects of prolonged EtOH consumption and thiamine deficiency on the brain are complex (Alfonso-Loeches et al., 2012; Fernandez-Lizarbe et al., 2013; Toledo Nunes et al., 2019; Vedder et al., 2015). Several preclinical studies have revealed that exposure to severe EtOH alone or combined with thiamine deficiency leads to white matter damage in the cortex and the cerebellum. Neuroinflammation is a critical mechanism associated with alcohol-related brain damage and has been suggested to participate in the myelin and white matter disruptions observed after prolonged heavy alcohol consumption (Alfonso-Loeches et al., 2012; Toledo Nunes et al., 2019).
Human imaging studies have shown that prefrontal white matter is severely affected in people suffering from AUD combined with KS, and a negative correlation has been found between white matter volume and maximum daily alcohol consumption (Harper, 2009; Kril et al., 1997). Furthermore, white matter loss has also been reported in rodents treated with binge or chronic EtOH exposure, as well as thiamine deficiency (He et al., 2007; Kril et al., 1997; Langlais and Savage, 1995; Navarro and Mandyam, 2015; Obernier et al., 2002). There are also deficits in the macro- and ultrastructure of the corpus callosum following ethanol consumption paired with PTD, that is greater than PTD or ethanol alone (He et al, 2007). Experimental studies using the PTD model in rodents have shown long-lasting deficits in cortical thickness and volume months after treatment in both the frontal cortex and the parietal cortex, indicating that these regions are highly susceptible to the damage caused by thiamine deficiency (Langlais and Savage, 1995; Langlais and Zhang, 1997).
In AUDs the cerebellum is another area with increased sensitivity to thiamine deficiency, as evident in the degeneration of white matter (Hammoud and Jimenez-Shahad, 2019). Chronic AUD has been shown to cause ataxia and cerebellar atrophy, as seen using Computed Tomography (CT) and Magnetic Resonance Imaging (MRI) imaging (Geibprasert et al., 2010). Furthermore, an overall reduction of white matter in the cerebellum, particularly the vermis and the intermediate and lateral zones, has been associated with severe AUD (Harper, 1998).
Previous studies have shown that excessive alcohol consumption in humans leads to myelin gene and protein expression disruptions in the prefrontal and motor cortices, as well as in the cerebellum (Jacobus et al., 2013; Lewohl et al., 2000; Luciana, 2013; Adams, 1976). There are several myelin-related genes that modulate myelin levels and function. Oligodendrocyte transcription factor 1 (Olig1) is a transcription factor expressed during oligodendrocyte differentiation (Fu et al., 2002). Oligodendrocyte transcription factor 2 (Olig2) is a transcription factor that plays a role in glia genesis and is expressed in pre-myelinating oligodendrocyte progenitors and differentiated myelinating oligodendrocytes (Navarro and Mandyam, 2015). Both Olig1 and Olig2 are expressed by oligodendrocytes during maturation and regeneration (Fu et al., 2002; Marie et al., 2001). In contrast, myelin basic protein (MBP) is expressed mostly in mature oligodendrocytes. MBP is present in both the central nervous system and the peripheral nervous system and modulates the formation and maintenance of myelin (Brenhouse and Andersen, 2011). In humans, following abstinence from alcohol MBP expression level deficits return to normal levels and may contribute to white matter recovery via remyelination (Miguel-Hidalgo, 2018). Myelin-associated glycoprotein (MAG) is expressed by mature oligodendrocytes and by myelinating glia in the central nervous system and the peripheral nervous system (Brenhouse and Andersen, 2011; Matthieu et al., 1974), whereas MBP functions in the formation and maintenance of myelin (Figlewicz et al., 1981). Myelin oligodendrocyte protein (MOG) is expressed by mature oligodendrocytes; it is located on the outside of the myelin sheath and is related to the autoimmune response (Cao et al., 2013).
In the frontal cortex, the MAG, MBP, MOG, and Olig1 genes have been significantly reduced with chronic EtOH exposure in both humans and rodents (Wolstenholme et al., 2017; Alfonso-Loeches et al., 2012; Miguel-Hidalgo et al., 2017; Miguel-Hidalgo, 2018). There is evidence that a history of severe AUD, to the extent that nutritional deficiency is present, leads to reductions in some myelin-related genes, such as MBP, MAG, and MOG in humans (Lewohl et al., 2005). Miguel-Hidalgo (2018) suggested that thiamine deficiency may be the underlying cause of an alteration in gene expression following chronic AUDs.
Considering that the molecular mechanisms involved in alcohol-related brain damage and disturbances in myelination after chronic EtOH exposure and thiamine deficiency treatment remain unknown, the goal of the present study was to assess the short-term (20% EtOH in drinking water for one month) and long-term impacts of chronic EtOH exposure (20% EtOH in drinking water for six months) and the effect of thiamine deficiency alone or combined with chronic EtOH on myelin-related gene expression during the EtOH/thiamine deficiency and following acute and protracted abstinence periods. We hypothesized that a combination of chronic EtOH and thiamine deficiency would lead to the greatest disruption in myelin-related gene expression, followed by thiamine deficiency alone, chronic EtOH, and chronic EtOH with the restoration of thiamine conditions. We also hypothesized that the longer the abstinence period, the greater the chance for a recovery in myelin-related gene expression, particularly in the chronic ethanol treatment groups.
2. Materials and Methods
2.1. Subjects
Adult male Sprague Dawley rats (2–3 months old; n=40 for Experiment 1; n=145 for Experiment 2; Envigo, Frederick, MD) were randomly assigned to treatment conditions and housed in standard plexiglass cages with chew blocks and nesting materials. Two to three rats were housed per cage, and all rats within a cage received identical procedures. Initially, there was ad libitum access to food and water within a vivarium at Binghamton University (20–22°C with a 12:12 light/dark cycle and light onset at 07:00 hours). All rats were given a two-week acclimation period prior to experimentation. All experiments were approved by the Institutional Animal Care and Use Committee at the State University of New York at Binghamton and conducted according to the National Institute of Health’s Guide for the Care and Use of Laboratory Animals (National Research Council, 2011).
2.2. Experimental Conditions
The rats were separated into two different studies: Experiment 1 (n=40) and Experiment 2 (n=145). In both studies, rats were randomly assigned to one of the experimental groups, as seen in Figure 1-A and described below. Figure 1-A summarizes the treatment conditions and timeline for the experiments.
Figure 1.
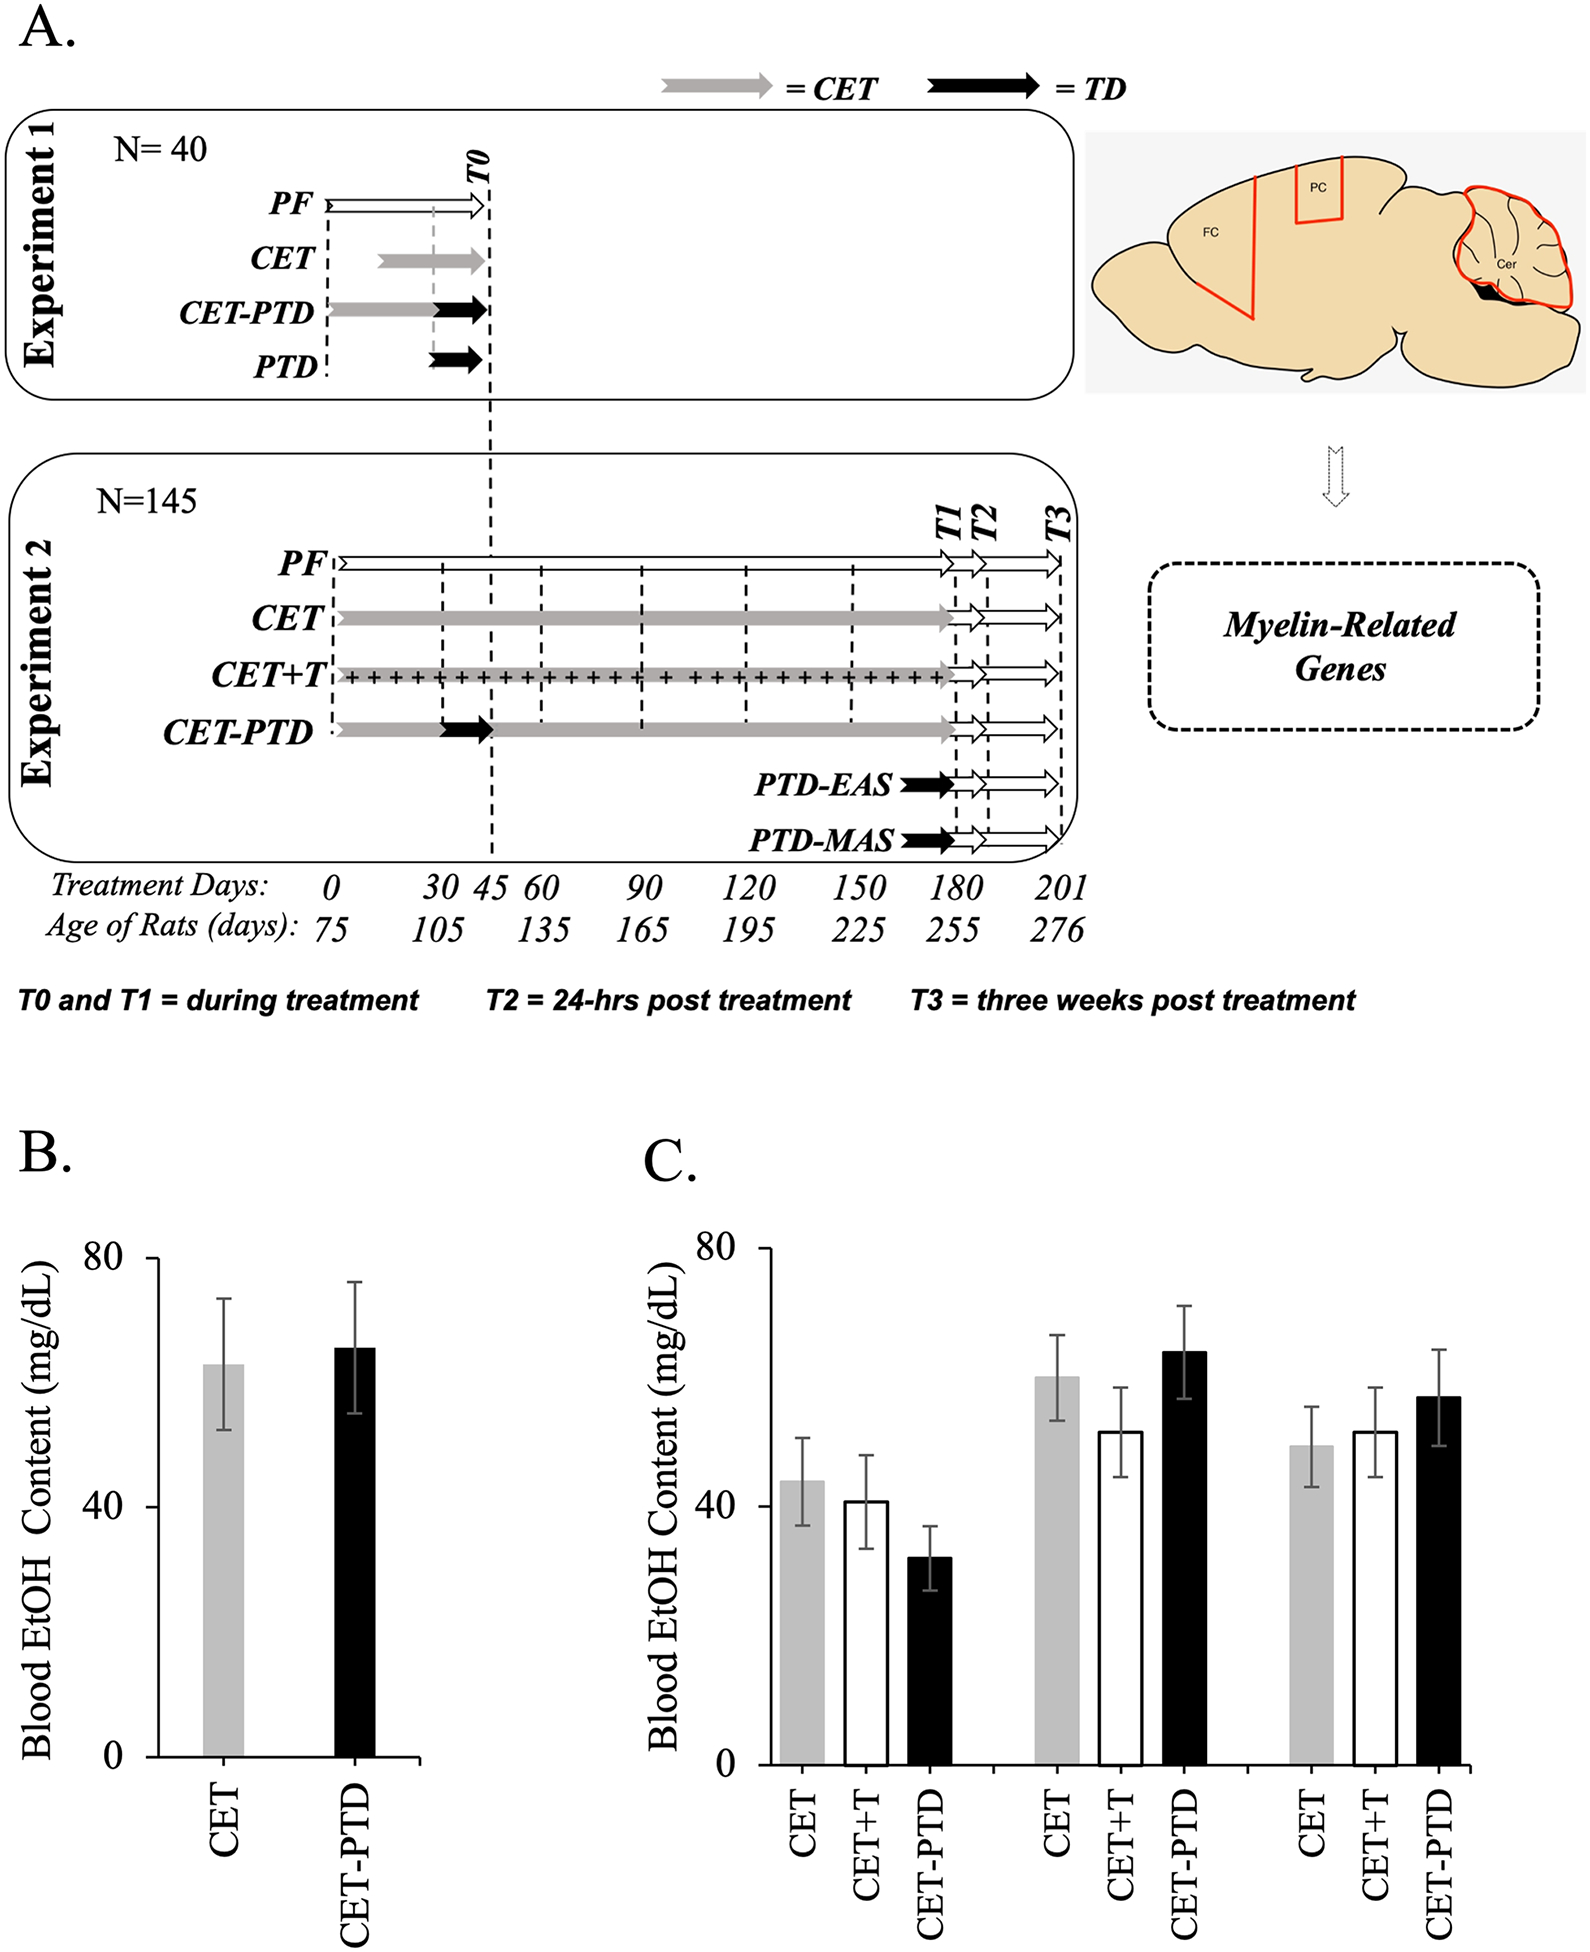
A. Experimental timeline for the subjects of Experiments 1 and 2. In Experiment 1, the subjects were assigned to one of four groups—PF (Pair Fed control), CET (Chronic EtOH Treatment), CET-PTD (CET combined with Pyrithiamine-Induced Thiamine Deficiency), or PTD (Pyrithiamine-Induced Thiamine Deficiency) *—which were reversed after the loss of the righting reflex but prior to seizure. In Experiment 2, subjects were assigned at random to one of six groups; PF control, CET, CET-PTD, CET+T (Chronic ethanol treatment with injections of thiamine), PTD-EAS (PTD – Early acute stage) in which subjects were reversed 1h after seizure, and PTD-MAS (PTD – Moderate acute stage)in which subjects were reversed 4h after seizure. Brain samples (frontal cortex [FC], parietal cortex [PC] and cerebellum [Cer]) were collected in different time-points: T0=during treatment in Experiment 1; T1=during treatment in Experiment 2; T2=24-h post-treatment; T3=three weeks post-treatment). B. BECs (mean ± SEM) following one month of treatment for Experiment 1. This time point signifies the end of the CET treatment for Experiment 1. C. BECs (mean ± SEM) for Experiment 2. BECs were collected after one month, three months (halfway through the CET treatment), and six months (at the conclusion of the CET treatment).
*NOTE: The PTD subjects in Experiment 1 most resemble the PTD-EAS subjects of Experiment 2.
2.2.1. Chronic EtOH Treatment (CET)
Exposure to EtOH was conducted through a forced consumption procedure in which EtOH, provided in drinking bottles, was the only liquid available for consumption (Aloe and Tirassa, 1992; Cadete-Leite et al., 2003). Rats were weaned for five days at each concentration, increasing the exposure at intervals of 6, 9, 12, and, finally, 20% v/v EtOH in drinking water. Rats in Experiment 1 (n=10) were treated for one month with the forced consumption model. In Experiment 2 (n=24), the rats consumed the 20% v/v solution of EtOH daily for six months. During the CET treatments, the rats were given a diet consisting of Purina rat chow.
2.2.2. Combined CET and Thiamine Treatment (CET+T)
The rats received the same EtOH treatment as the CET group and received intraperitoneal (ip) injections of thiamine hydrochloride dissolved in sterile water (0.4 mg/kg, ip; Sigma-Aldrich) three times per week on Mondays, Wednesdays, and Fridays. The thiamine treatment was administered for the duration of the EtOH consumption only in Experiment 2 (n=24), as the duration of that study was more than six months (see Ciccia and Langlais, 2000).
2.2.3. PTD Treatment
The subjects received ad libitum access to thiamine deficient chow (Harlan Laboratories, Inc., Indianapolis, IN) with daily ip pyrithiamine hydrobromide injections dissolved in sterile water (0.25 mg/kg; Sigma-Aldrich Corp., St. Louis, MO). The Experiment 1 rats assigned to the PTD group (n=10) were euthanized after the animals presented the lost right reflex but prior to the presentation of seizure. In Experiment 2, the PTD rats were separated into two groups based on the severity of the thiamine deficiency: the early acute stage (EAS) and the moderate acute stage (MAS). Rats in the PTD-EAS group were reversed 1h after seizure (n=25), and those in the PTD-MAS group were reversed 4h after seizure (n=24) with an injection of thiamine hydrochloride (100 mg/kg, i.p. dissolved in sterile water).
2.2.4. Combined CET and PTD Treatments (CET-PTD)
The rats were faded into drinking a 20% v/v EtOH solution (over about 2 weeks) and then maintained on the 20% v/v EtOH drinking solution for 30 days (Experiment 1) or 6 months (Experiment 2). After 30 days of the CET treatment, the rats began 15 days of the PTD treatment. The rats in Experiment 1 (n=10) were euthanized when they presented the lost right reflex during the PTD treatment (time point 0 [T0]). Rats from Experiment 2 (n=24) were reversed 1h after seizure; they were returned to regular chow after the PTD treatment and continued the CET treatment.
2.2.5. Pair-fed (PF) Control
For both Experiment 1 (n=10) and Experiment 2 (n=24), the rats in the control group were given free access to water and regular chow during treatment. During the thiamine deficiency protocol, the PF rats were provided the equivalent thiamine deficient food consumption of the PTD rats. The PF rats received daily injections of thiamine during the time that they would have been given thiamine deficient chow.
After the completion of the experimental procedures for Experiment 1 (n=40), the rats were designated to the same time point, T0. The CET group (n=10) was treated with CET for 30 days before the EtOH treatment was stopped and then euthanized. The CET-PTD group (n=10) was treated with CET for 45 days and treated with PTD starting at day 30 of CET. The PTD group (n=10) was treated with PTD as described above. PTD-treated rats were euthanized after the loss of the righting reflex and before seizure.
In Experiment 2 (n=145), as previously described (Toledo Nunes et al., 2019), the rats were randomly divided into three recovery phase time points after which they were euthanized: T1 during the final treatment day, T2 during acute recovery (24-h post-treatment), and T3 during delayed recovery (three weeks post-treatment). Levels of gene expression recorded at T1 reflect alterations during the active treatment or intoxication condition, whereas levels of gene expression recorded at T2 reflects how acute withdrawal contributes to alterations in gene expression. Delayed recovery, represented by T3, provides a time point to examine either persistent alterations or protracted recovery. In the PTD-EAS treatment group, T1 rats (n=9) were euthanized within 1h after the presentation of seizure, whereas, in the PTD-MAS treatment group, T1 rats (n=8) were euthanized 4h following the presentation of seizure. All PTD treatments had a duration of approximately 15 days. In the groups receiving CET treatment (CET, CET+T, CET-PTD; n=8/group), T1 coincided with euthanasia during the intoxication phase while the rats had 20% EtOH in the drinking water. In the acute and delayed recovery phases, the rats, regardless of their treatment condition (n=7–9/group), were sacrificed either 24-h post-treatment at T2 or three weeks post-treatment at T3 after being weaned. The frontal cortex, the parietal cortex, and the cerebellum were dissected at 4°C using a brain matrix block (Harvard apparatus, MA, USA) and then stored at −80°C. Previous studies have determined that the microstructure of white matter, MBP-positive fibers, exists through out these regions and peaks at adulthood (Bjelke and Seiger, 1989; Yang et al 2017). Samples were analyzed for myelin-related gene expression through RT-PCR.
2.3. Blood Collection
In Experiment 1, blood samples from the tail vein were collected in the PF, CET, and CET-PTD groups one month into treatment. In Experiment 2, blood samples were collected in the PF, CET, CET+T, and CET-PTD groups at months 1, 3, and 6 during treatment. Blood EtOH concentration (BEC) was determined using an Analox machine (Analox Instruments USA, Lunenburg, MA). Figure 1-BC shows the BECs obtained.
2.4. RT-PCR Analysis for Myelin-related Genes
Oligodendrocytes, the cells responsible for producing myelin in the central nervous system, have four stages of maturation: oligodendrocyte progenitor cells, preoligodendrocytes, immature oligodendrocytes, and mature oligodendrocytes (Barateiro and Fernandes, 2014; Trapp et al., 1997). As oligodendrocytes mature, different genes are expressed to promote a multitude of functions. Figure 2A is adapted from Barateiro and Fernandes (2014) and shows the progression of oligodendrocyte maturation. Olig2 is expressed through all stages of maturation. Olig1 is expressed only in the oligodendrocyte progenitor cells and the mature oligodendrocyte stage of maturation, while MBP, MAG, and MOG are only expressed during the mature oligodendrocyte stage of maturation (Barateiro and Fernandes, 2014).
Figure 2.
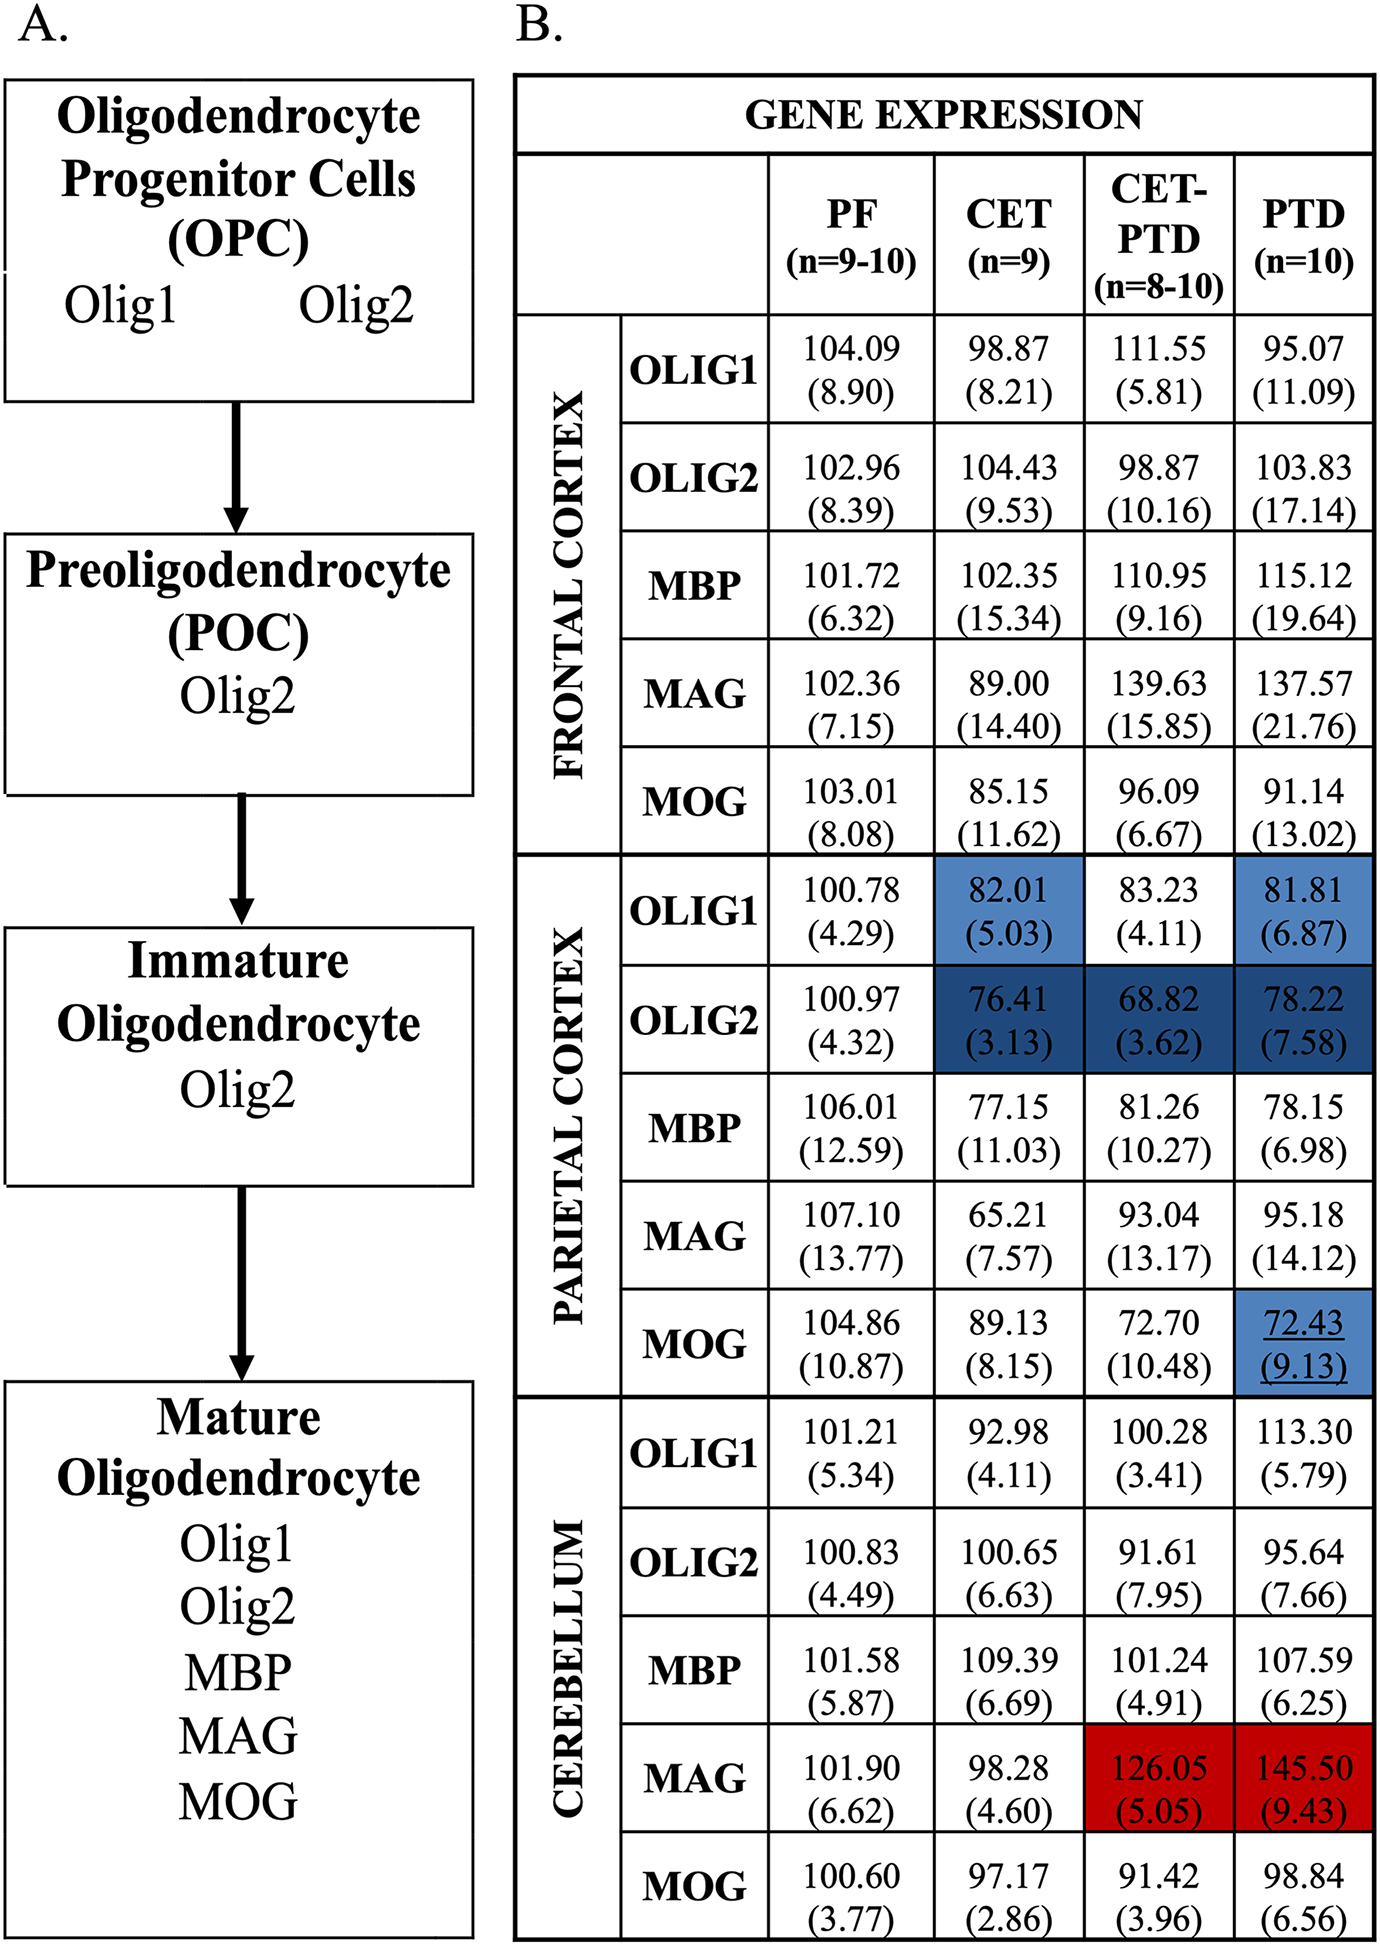
A. Four steps of oligodendrocyte maturation—oligodendrocyte precursor cells, preoligodendrocytes, immature oligodendrocytes, mature oligodendrocytes—adapted from Barateiro and Fernandes (2014). During the stages of oligodendrocyte maturation, cells express different genes, which act as useful markers and indicate the cells’ current stage of maturation. B. Heat map of gene expression for Experiment 1 in the frontal cortex, the parietal cortex, and the cerebellum. Heat map of gene expression of the myelin-related genes, Olig1, Olig2, MBP, MAG, and MOG, in the frontal cortex, the parietal cortex, and the cerebellum. Gene expression was relative to the PF group (% of PF expression). The standard error of the mean is represented in parentheses. Post hoc contrasts were used to compare the PF group to the experimental conditions. Differences in gene expression are represented by color with the red schema representing an increase in expression relative to PF and the blue schema representing a decrease relative to PF (p<0.05). The darker shades of red (increase) or blue (decrease) represents p<0.01, whereas the lighter shades represents a p-value between 0.02 and 0.01.
The frontal cortex and the parietal cortex were homogenized in 500 μL of the Trizol RNA reagent, and the cerebellum was homogenized in 1500 μL of the Trizol reagent (Invitrogen, Grand Island, NY) and 5 mm stainless steel beads using a Qiagen Tissue Lyser (Qiagen, Valencia, CA). Total RNA was extracted using RNeasy mini columns (Qiagen) according to the manufacturer’s instructions. RNA quality was determined using a Nanodrop micro-volume spectrophotometer (NanoDrop 2000, Thermo Scientific, Wilmington, DE). Synthesis of cDNA was performed via the reverse transcription kit (Qiagen), as previously described (Doremus-Fitzwater et al., 2015).
PCR was run using a CFX 384 RT-PCR Detection System (Bio-Rad, #185–5485) for 40 cycles with each biological sample in duplication, and the final product for each subject was the average of the two replications. During the cycle, the samples were denatured for 30 seconds at 95°C, annealed for 30 seconds at 60°C, and extended for 30 seconds at 72°C. The results were normalized using the mitochondrial ribosomal protein L13 (MRPL13) or the 18s ribosomal RNA subunit (18S rRNA) as the housekeeper genes. The gene targets, the accession numbers, and the primer sequences of the desired genes are listed in Table 1. The myelin-related gene expression of Olig1, Olig2, MBP, MAG, and MOG was assessed across the frontal cortex, the parietal cortex, and the cerebellum.
Table 1.
Primer sequence and accession number, forward sequence (top) and reverse sequence (bottom) employed in RT-PCR assays for the assessment of myelin-related gene targets.
| Gene Target | Accession Number | Primer Sequence |
|---|---|---|
| Mitochondrial ribosomal protein L13 (MRPL13) | NM_17330.2 | 5′-ATGAACACCAACCCGTCTCG-3′ 5′-CCACCATCCGCTTTTTCTTGTC-3′ |
| 18s Ribosomal RNA subunit (18S rRNA) | NR_046237.1 | 5′-GTTCCGACCATAAACGATGC-3′ 5′-CGCTCCACCAACTAAGAACG-3′ |
| Oligodendrocyte transcription factor 1 (OLIG1) | NM_021770.4 | 5′-ATTGCCTCCCCACCATAAGC-3′ 5′-GATGCTCGCGGGTACAAAAC-3′ |
| Oligodendrocyte transcription factor 2 (OLIG2) | NM_001100557.1 | 5′-AGCCAGGTTCTCTTTCGCAG-3′ 5′-CCGGAGACGATCTAGGCTTTC-3′ |
| Myelin basic protein (MBP) | NM_001025291.1 | 5′-GGCATCACAGAAGAGACCCTC-3′ 5′-GTCAAGGATGCCCGTGTCT-3′ |
| Myelin-associated glycoprotein (MAG) | NM_017190.4 | 5′-CCAGACCATCCAACCTTCTGTAT-3′ 5′-GTCTCCTGATTCCGCTCCAA-3′ |
| Myelin oligodendrocyte protein (MOG) | NM_022668.2 | 5′-CGCCGTGGAGTTGAAAGTAGA-3′ 5′-AGTGAGGATCAAAAGTCCGATGG-3′ |
2.5. Statistical Analysis
2.5.1. Experiment 1
Statistical analyses were performed in SPSS (IBM SPSS Statistics Version 22). An analysis of variance (ANOVA) was used to determine whether the thiamine status altered the BECs.
To examine the initial treatment effects in myelin-related gene expression for all experimental conditions (PF, CET, CET-PTD, PTD), a one-way ANOVA was conducted at T0 (one month into treatment). Following a significant main effect, post hoc contrasts were used to compare the each group to PF control. A significance value of p≤0.02 was used to address type 1 error arising from multiple contrasts. A one-way repeated measure ANOVA was utilized to examine differences in myelin-related gene expression across the brain structures (the frontal cortex, the parietal cortex, and the cerebellum). This analysis examined how the gene expression levels were altered with regard to the brain regions. Following a significant main effect, post hoc contrasts were used to target a specific alteration in the myelin genes as a function of treatment conditions. A significance value of p≤0.02 was used to address type 1 error arising from multiple contrasts.
2.5.2. Experiment 2
A repeated measure ANOVA was used to assess the BECs at months 1, 3, and 6 for all groups receiving EtOH (CET, CETT, CET-PTD). One-way ANOVAs were used to analyze target gene expression across PF groups (T1, T2, T3); if there was no significant difference between PF1, PF2, and PF3, a single ultimate control group was used (PF). Two analyses were conducted with specific objectives: the first analysis was done to examine the effect of the treatment across each time point and the effect of the recovery time in each experimental condition. Differences in myelin-related gene expression as a function of the experimental condition (PF, CET, CET+T, CET-PTD, PTD-EAS, PTD-MAS) were analyzed with a one-way ANOVA at each time point (T1–T3). The second analysis was done to examine the changes in myelin-related gene expression across time points in each experimental condition. Post hoc contrasts were used to compare each time point. All values were expressed as a mean percent expression ± standard error. A significance value of p≤0.02 was used to address type 1 error arising from multiple contrasts.
A repeated measure ANOVA was used to analyze gene expression with regard to the brain region (the frontal cortex, the parietal cortex, and the cerebellum), the experimental conditions, and the time points (T1, T2, T3), as well as the interaction between each condition with the others and the overall interaction. A significance value of p≤0.02 was used to address type 1 error arising from multiple contrasts.
3. Results
3.1. Experiment 1
3.1.1. Blood EtOH Concentrations (BECs)
Figure 1B displays the BECs of the CET and CET-PTD groups. Thiamine status did not alter the BECs. The average BEC was around 62–65 (± 33) mg/dl, below the 80 mg/dl threshold associated with binge drinking, suggesting moderate levels of EtOH consumption (Reilly et al., 2014). No differences were reported in BEC levels between the CET and CET-PTD groups (F(1,18)=0.03, p=0.86).
3.1.2. Treatment Effects on Myelin-related Gene Expression
Frontal Cortex
The analysis showed no main treatment effect relative to the PF group on the gene expression levels of Olig1, Olig2, MBP, MAG, or MOG (F(2, 21)<2.61, p>0.07) in the frontal cortex. Data for the myelin-related gene expression for Experiment 1 are shown in Figure 2B.
Parietal Cortex
A main treatment effect was observed in Olig1 and Olig2 gene expression in the parietal cortex (Olig1: F(3,35)=3.16; Olig2: F(3,34)=7.28; both: p≤0.04) due to a significant decrease in both genes in the CET (p≤0.015) and PTD (p≤0.014) groups compared to the PF group. Significant decrease was also observed in Olig2 gene expression in CET-PTD (p=0.0001) group compared to the PF group. Data expressing the gene expression levels in the parietal cortex are shown in Figure 2B.
The analysis also revealed a trending treatment effect on the gene expression levels of MOG (F(3,34)=2.59, p=0.07), and the post hoc analysis revealed that MOG gene expression decreased in the PTD (p=0.02) group compared to the PF group. No main treatment effects in the gene expression levels were found for MBP or MAG (F(3, 35)<1.03, p>0.39).
Cerebellum
The analysis revealed a main treatment effect on the gene expression levels of MAG (F(3,35)=11.15, p<0.001). A post hoc analysis exposed a significant increase in the gene expression of MAG in the CET-PTD (p=0.012) and PTD (p=0.0001) experimental conditions compared to the PF group. In contrast, there was no main treatment effect in the gene expression levels for Olig2, MBP, and MOG (F(3,35)<0.84, p>0.48). Data on the gene expression levels in the cerebellum is shown in Figure 2B.
3.1.3. Brain Region Effects
There was differential expression levels for some myelin-related genes as a function of brain region (F(3,149)≥3.22, p≤0.025). The post hoc tests showed that the gene expression levels for Olig2 (p=0.004), MBP (p=0.009), and MAG (p=0.008) were all lower in the parietal cortex than in the frontal cortex. Furthermore, the gene expression levels for MBP (p=0.02) and MAG (p=0.008) were greater in the cerebellum than in the parietal cortex. No differences were seen in gene expression levels between the frontal cortex and the cerebellum for Olig1, Olig2, MBP, or MAG. MOG gene expression analysis revealed no significant effect between the brain regions (F(3,15)=1.691, p=0.17).
3.2. Experiment 2
3.2.1. Blood EtOH Concentrations (BECs)
The average BEC levels were around 60 mg/dl, below the binge drinking threshold of 80 mg/dl (Reilly et al., 2014), modeling moderate EtOH consumption. No differences were reported in the BEC levels between the groups with varied thiamine status (months 1, 3, and 6: p>0.05). However, over time, the BEC levels increased: 38.88 (±6.13) for month 1, 58.42 (±6.30) for month 3, and 52.53 (±3.90) for month 6 (F(2,134)=8.05, p=0.0005). BECs for Experiment 2 are displayed in Figure 1C.
3.2.2. Treatment and Recovery Effects on Myelin-related Gene Expression
Appropriate treatment effect comparisons relative to the PF control group were assessed for several myelin genes across the cortices and the cerebellum. However, the analysis revealed a significant effect in MBP gene expression (F(2,21)=5.063, p=0.02) on in the cerebellum across the PF groups as a function of the time point. Therefore, the MBP analysis was compared to the respective time points as opposed to the ultimate control. All other target gene expression across the PF groups revealed no differences across time points (F(2,21)<1.25, p>0.31). Therefore, an ultimate PF control was utilized.
Frontal Cortex
Figure 3 shows the heat map for the gene expression of myelin-related genes for all experimental conditions at the three different time points in the frontal cortex. MOG gene expression during treatment (T1) changed as a function of the treatment (F(5, 53)=2.78, p=0.03). The post hoc analyses revealed a suppression of this gene in the PTD-MAS group (p=0.01) during treatment with an extended recovery time (p>0.21) compared to the PF group. There was no main treatment effect in the gene expression for Olig1, Olig2, MBP, or MAG (F(5,58)=1.85, p≥0.12).
Figure 3.
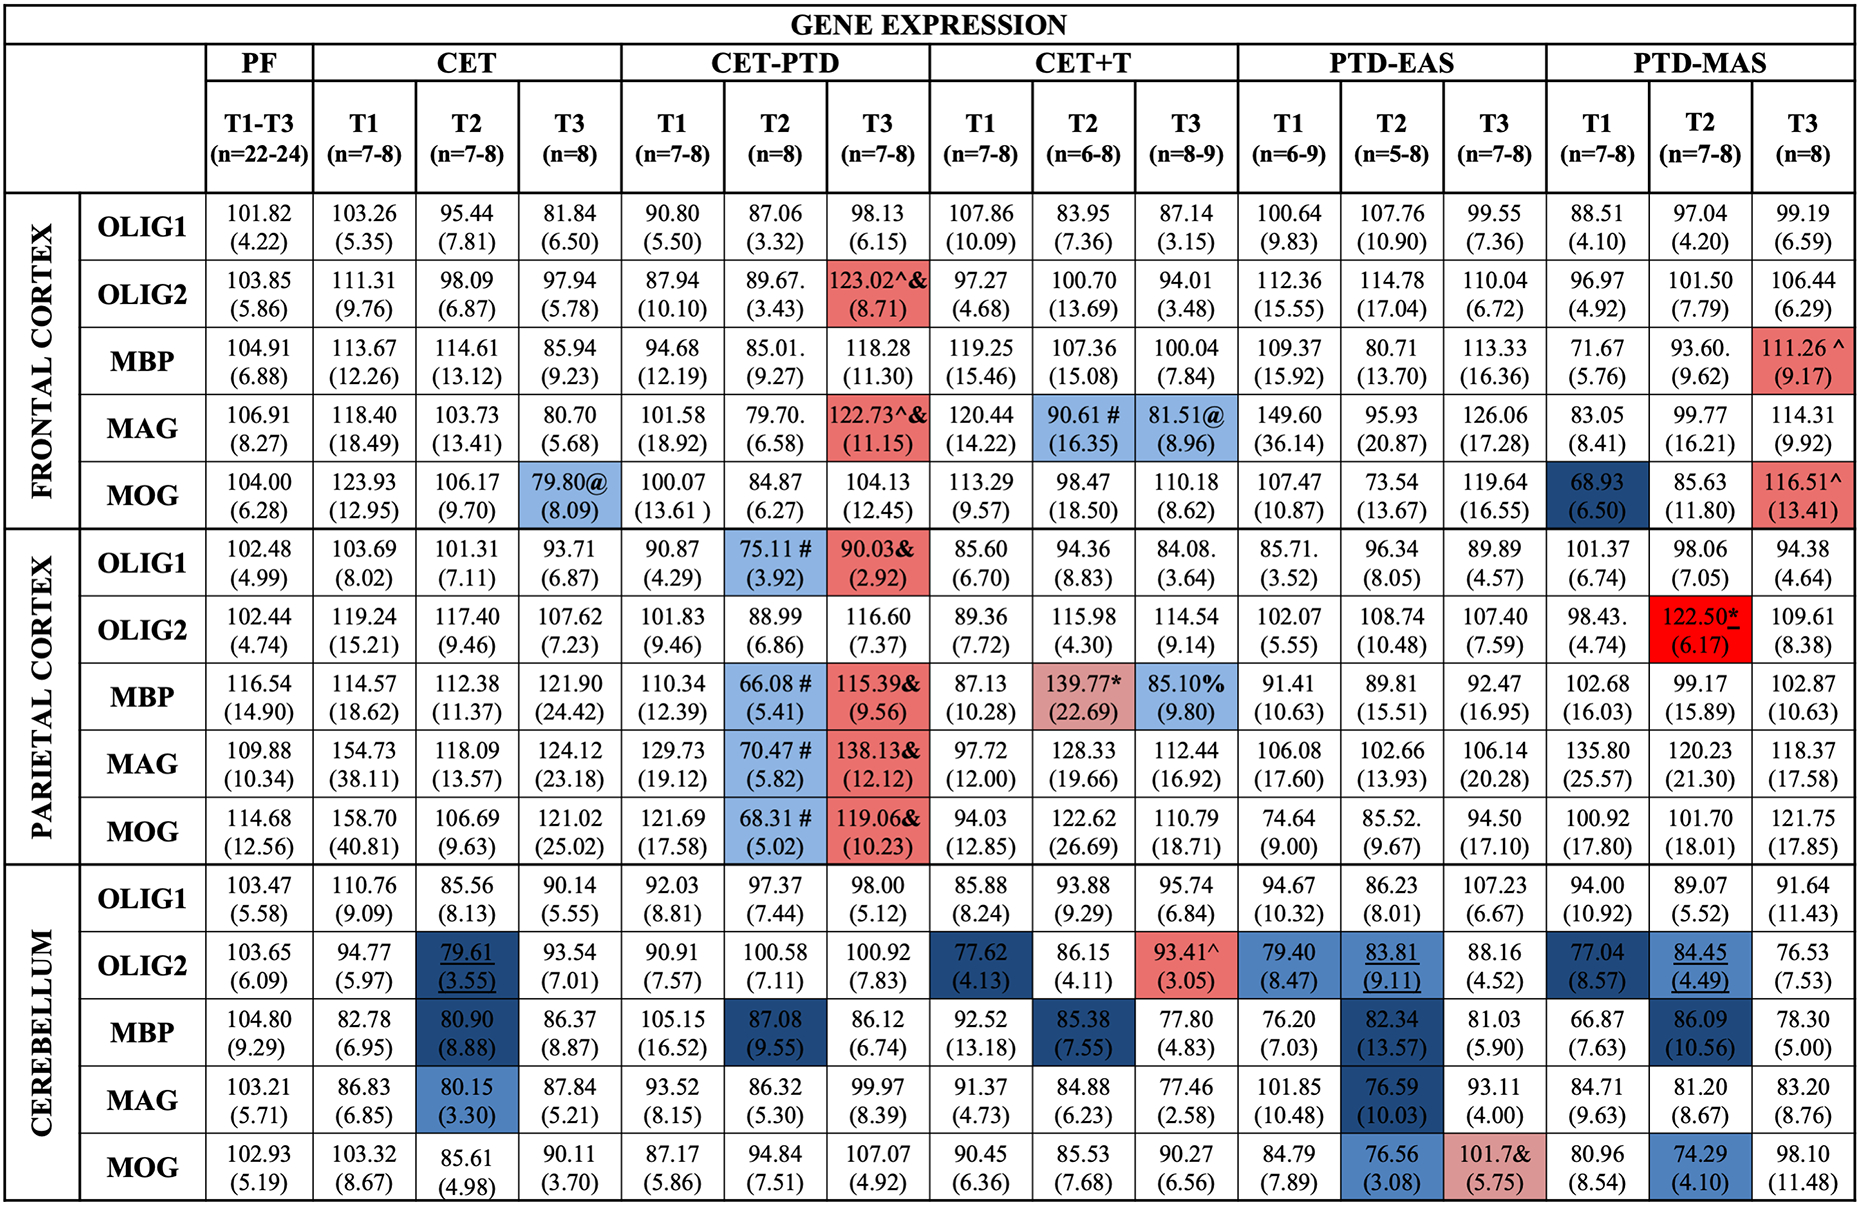
Heat map of gene expression for Experiment 2 in the frontal cortex, the parietal cortex, and the cerebellum. Heat map of gene expression of the myelin-related genes, Olig1, Olig2, MBP, MAG, and MOG, in the frontal cortex, the parietal cortex, and the cerebellum. Gene expression for the treatment effect is relative to the PF group (% of PF expression for T1, T2, and T3). A statistical difference was apparent in the PF group at T2; therefore, an ultimate PF control could not be used. For MBP, the expression levels in the cerebellum were compared to their respective time points. Gene expression for the recovery effect compared gene levels within an experimental condition across three time points, (T1=during treatment; T2=24-h post-treatment; T3=three weeks post-treatment). The standard error of the mean is represented in parentheses. Post hoc contrasts were used to compare the PF group to the experimental conditions and the different time points within each condition. Differences in gene expression are represented by color with the red schema representing an increase in expression relative to PF and the blue schema representing a decrease relative to PF. The darker shade of red or blue represents p<0.01, whereas the lighter shade represents a p-value between 0.02 and 0.01. * represents an increase from T2 relative to T1, ^ represents an increase at T3 relative to T1, & represents an increase at T3 relative to T2 when assessing the effect of recovery, # represents a decrease at T2 relative to T1, @ represents a decrease at T3 relative to T1, and % represents a decrease at T3 relative to T2 when assessing the effect of recovery (p<0.02).
To investigate change as a function of duration of abstinence/recovery, the gene expression levels were compared across time points within the treatment conditions. The analysis revealed no main time point effect in the gene expression of Olig2 (F(2,21)=2.67, p=0.09). However, the analysis displayed an upregulation of the Olig2 gene in the CET-PTD group during the protracted (T3) recovery period compared to the active treatment phase (T1; p=0.005) and the acute recovery phase (T2; p=0.007). There was also an upregulation of the MBP gene at T3 relative to T1 (p=0.004) in the PTD-MAS group.
MAG gene expression was significantly different across the three phases in the CET-PTD and the CET+T treatment conditions. There was an upregulation of the MAG gene in the CET-PTD group at the protracted (T3) recovery phase, relative to the T1 and T2 phases (p<0.009), and a downregulation of this transcript in the CET+T group 24-h post-treatment (T2, p=0.01), which remained suppressed at T3 (p=0.01). The analysis across time points revealed that, at T3, the MOG transcript was down-regulated in the CET group (p=0.007) and upregulated in the PTD-MAS group (p=0.008) compared with the first time point (T1).
In summary, the frontal cortex showed modest susceptibility to alterations in the expression of most myelin-related genes of interest. A treatment effect was observed only during the PTD-MAS treatment on MOG gene expression in the frontal cortex. Therefore, changes in the gene expression levels were observed as a function of the duration of abstinence. Prolonged abstinence caused downregulation of MOG after chronic EtOH exposure alone and upregulation of OLIG2 and MAG after CET combined with PTD treatment. However, when CET was combined with thiamine injections, the MAG levels were downregulated after acute and prolonged abstinence. In addition, the MBP and MOG levels were recovered three weeks after severe PTD treatment.
Parietal Cortex
Surprisingly, the parietal cortex had the greatest changes in white matter gene expression. Figure 3 shows the heat map for the expression of myelin genes in the parietal cortex. The ANOVA revealed a main treatment effect at T2 in the Olig2 gene expression (F(5,53)=2.46, p=0.045). However, there were no treatment effects for the other myelin-related genes (F(5,55)≤2.07, p≥0.07).
The analysis across the three phases within each treatment condition revealed a time point effect for the Olig1 (F(2,21)=5.86, p=0.01), MPB (F(2,21)=8.06, p=0.003), MAG (F(2,21)=7.47, p=0.004), and MOG (F(2,21)=6.19, p=0.008) genes in the CET-PTD group. The analysis displayed a significant suppression of these genes in the CET-PTD group during acute recovery relative to the levels observed during treatment (Olig1: p=0.007; MPB: p=0.004; MAG: p=0.005; MOG: p=0.005) followed by upregulation three weeks post-treatment (Olig1: p=0.01; MPB: p=0.002; MAG: p=0.002; MOG: p=0.007) in the parietal cortex of the CET-PTD group.
The ANOVA also revealed a main time point effect for Olig2 and MBP in the CET+T group (F(2,20)≥3.45, both p≤0.05). Upregulation was revealed in MBP gene expression at T2 relative to T1 (p=0.02), followed by a decrease at T3 (p=0.01).
In summary, the parietal cortex displayed a unique profile regarding myelin-related gene expression. Following severe thiamine deficiency, Olig2 gene expression was upregulated only 24-h after the end of the PTD-MAS treatment. When treated with CET combined with thiamine deficiency, Olig1, MBP, MAG, and MOG showed downregulation in the expression levels with an acute recovery time (24-h post-treatment); however, with extended recovery (three weeks), the expression levels recovered. When thiamine injections occurred with CET, the MBP gene showed an upregulation in expression with an acute recovery time, which returned to normal with an extended recovery period.
Cerebellum
Changes in myelin-related genes as a function of EtOH and thiamine deficiency in the cerebellum are presented in Figure 3. There was no main treatment effect (F(5,59)=0.98, p=0.44) or time point on the expression of the Olig1 gene (F(2,21)=3.01, p=0.07). However, the gene expression levels of Olig2 showed a main treatment effect at T1 (F(5,59)=2.68, p=0.03) and an effect trending toward significance at T2 (F(5,57)=2.32, p=0.055). A post hoc test revealed downregulation of the CET+T, PTD-EAS, and PTD-MAS groups during treatment (T1) compared to the levels observed in the PF groups (p≤0.015). The CET group displayed a suppression of Olig2 at T2 (p=0.01). However, the CET+T group revealed an upregulation in gene expression levels with three weeks of abstinence from EtOH compared to levels observed during treatment (p=0.006).
The analysis of the gene expression levels of MAG revealed a main treatment effect at T2 (F(5,57)=2.634, p=0.03) and an effect trending toward significance at T3 (F(5,57)=2.28, p=0.059). A post hoc examination at the time point 24-h post-treatment revealed significant downregulation of MAG in the CET (p=0.02), PTD-EAS (p=0.008) treatment conditions.
An ANOVA regarding the levels of MOG gene expression revealed a main treatment effect 24-h post-treatment (F(5,57)=3.31, p=0.01) with the downregulation of MOG gene levels in the PTD-EAS (p=0.01), and PTD-MAS (p=0.001) groups compared to the PF control groups. Further analysis examining the effects of recovery time revealed a significant time point effect (F(2,20)=3.72, p=0.04). The post hoc analyses disclosed a significant upregulation of gene expression levels in the PTD-EAS group after the three-week recovery period compared to the levels observed just after the treatment (p=0.015).
In summary, the cerebellum showed modest susceptibility to EtOH-induced alterations in myelin-related gene expression. When treated with CET alone, there was a pattern of downregulation evident 24-h after treatment for the Olig2, MAG, and MOG genes, which did recover. When treated with both CET and thiamine supplementation, the analysis revealed downregulation of Olig2 expression during treatment, which recovered following a three-week abstinence period. In contrast, the downregulation of MOG 24-h post-treatment did not recover within the three-week abstinence period. Thiamine deficiency alone caused significant myelin-related gene expression in the cerebellum. When treated with moderate thiamine deficiency (PTD-EAS), there was a decrease in the Olig2 expression levels during treatment. This downregulation extended up to 24-h after the treatment was finished. Further downregulation 24-h after treatment was also seen in the MAG and MOG expression levels. However, only the MOG levels recovered after the three-week recovery period. With severe thiamine deficiency (PTD-MAS), a downregulation of Olig2 was apparent following treatment, which persisted for 24-h after the treatment concluded. Downregulation after 24-h of recovery was also seen in the MAG and MOG expression levels, and MAG downregulation persisted after three weeks of recovery.
3.2.3. Brain Region Effects
A univariate ANOVA was used to examine gene expression levels in each studied brain region (the frontal cortex, the parietal cortex, and the cerebellum). ANOVA analysis regarding Olig1 showed no effect related to the brain region (F(3,564)=0.33, p=0.81). However, the main effects of the brain region were found for Olig2, MBP, MAG, and MOG gene expression (F(3.53)>3.22, p<0.05). A post hoc analysis revealed that Olig2, MBP, MAG, and MOG gene expression was lower in the cerebellum than in the frontal cortex (p≤0.014) or the parietal cortex (p≤0.014). Further analysis revealed higher levels of MAG gene expression in the parietal cortex than in the frontal cortex (p=0.014).
4. Discussion
Human imaging and gene expression data point toward brain white matter dysfunction as a key target of alcohol-related neurodegeneration (de la Monte and Kril, 2014; Mayfield et al., 2002; Pfefferbaum et al., 2006, 2007, 2014). However, abstinent alcohol-dependent individuals showed improvement in brain fiber tract integrity and myelin restoration (Alhassoon et al., 2012; Pfefferbaum et al., 2014). The current study implemented several animal models of alcohol-related brain damage to define the roles of EtOH toxicity and thiamine deficiency in myelin gene disruptions in the cortex and the cerebellum. Furthermore, looking at four time points enabled the development of a clearer picture of when myelin alteration occurs and when myelin recovery emerges. The central hypothesis was that chronic EtOH and thiamine deficiency alone would disrupt myelin-related gene expression, but the combination of these conditions would have the greatest disruption in myelin-related gene expression. It was also hypothesized that there would be a recovery of the gene expression following chronic EtOH, but no or delayed recovery would occur following thiamine deficiency.
Overall, our results support the hypothesis that chronic EtOH combined with thiamine deficiency leads to the greatest disruption in myelin-related gene expression. This was particularly true for the parietal cortex. In the CET-PTD condition, almost all myelin-related genes were downregulated following one month of CET and during the acute abstinence period following six months of CET. However, the myelin-related genes in the parietal cortex rebounded after the three-week protracted recovery period. The changes in myelin-related genes in the frontal cortex as a function of chronic EtOH and/or thiamine deficiency were modest. Although there was not a significant suppression of the myelin-related genes in the frontal cortex of the rats exposed to CET-PTD, both Olig2 and MAG displayed upregulation during the protracted recovery period. The cerebellum, in contrast, displayed significant reductions in myelin-related genes associated with thiamine deficiency during PTD treatment and acutely following treatment. There were also reductions in some myelin-related genes in the cerebellum in the acute abstinence phase following chronic EtOH, which did not persist into the protracted abstinence phase. Thus, our results revealed that both EtOH and thiamine deficiency change myelin-related gene expression in the cerebellum, but thiamine deficiency, especially when combined with EtOH, changes myelin-related gene expression in the cortex.
4.1. Chronic Ethanol Exposure Has No Persistent Effects on Cortical or Cerebellar Myelin-related Gene Expression
One month into chronic EtOH exposure, we observed a selective suppression of Olig1 and Olig2 in the parietal cortex. This suggests that chronic EtOH initially causes a suppression of oligodendrocyte progenitor cells in the parietal cortex but not in the frontal cortex. However, some compensatory mechanisms must be evoked after six months of chronic EtOH as there were no significant changes in the myelin-related genes in the parietal cortex. In the frontal cortex, there was a suppression of MOG, a marker of mature oligodendrocytes, only in a protracted abstinence state following over six months of chronic EtOH. In contrast, in the cerebellum, there was a suppression of myelin-related genes only during the acute abstinence phase.
This work contrasts with a report of the downregulation of several of myelin-related genes and proteins, such as MBP, MAG, and MOG, in the cortex of high-drinking C57BL/6 mice after five months of chronic EtOH exposure (10% v/v in drinking water; Alfonso-Loeches et al., 2012). However, in that study, the mice obtained BECs (125 mg/dL) that were over twice as high (60 mg/dL) as those obtained in the rats in the current study. The moderate BEC observed in the current study may contribute to the limited change in myelin gene expression within the frontal cortex. Reduction in the expression of the MAG and MBP genes in the frontal cortices of mice was also observed in an adolescent binge model of EtOH exposure (Wolstenholme et al., 2017). However, this down regulation of gene expression did not persist with extended abstinence from EtOH. Thus, BECs well above the binge range appear to be required to produce EtOH-induced changes in myelin-related genes in the frontal cortex. This is supported by a study examining microarrays of myelin-related genes in the frontal cortex in postmortem tissue of humans with alcohol use disorders, the majority of whom were heavy drinkers (over 200 g EtOH per day for most of their adult lives); the findings indicated a suppression in gene expression for both MAG and MBP but no change for MOG (Lewohl et al., 2000). However, the last drinking episode for this sample was unknown, so the recovery or rebound of the myelin-related genes is also unknown.
4.2. Synergism Between Chronic EtOH Exposure and Thiamine Deficiency Has A Greater Impact on Myelin-related Gene Expression in Cortical Areas and the Cerebellum
In KS, there is more severe white matter loss compared to cases of AUDs without a thiamine deficiency (Kril et al., 1997; Harper et al., 1998). Surprisingly, we found few changes in myelin-related genes during EtOH exposure or during acute abstinence in the frontal cortex. There was only an upregulation of Olig2 and MAG three weeks post-treatment in the frontal cortex. In contrast, in the parietal cortex, there was a reduction of some myelin-related genes acutely following thiamine deficiency (Experiment 1) and selectively during acute abstinence (Experiment 2) in rats that underwent the CET-PTD treatment. However, myelin-related gene expression in the parietal cortex was recovered three weeks post abstinence, suggesting that the combination of chronic EtOH and thiamine deficiency does not have long-lasting effects of on myelin gene expression in the cortex or the cerebellum.
However, in alcohol-preferring rats, a year of CET treatment (10% v/v) combined with 14 days of PTD treatment exacerbated deficits in white matter in the corpus collosum, thinning the myelin sheath, which indicated that thiamine deficiency combined with CET may cause more severe damage than either treatment separately and is persistent even two months post-treatment (He et al., 2007). Thus, a genetic predisposition with a very long chronic EtOH exposure period may lead to the persistence of white matter pathology following CET with and without thiamine deficiency. Human studies have also demonstrated that the combination of alcohol abuse and thiamine deficiency has the biggest effect on white matter atrophy, with severe cases causing cortical necrosis and the loss of neurons, specifically in superior frontal regions (de la Monte and Kril, 2014). The current study revealed that chronic EtOH exposure combined with moderate thiamine deficiency temporarily alters genes critical for myelination, which are likely key to the myelin pathology reported in humans with severe alcohol use disorders. Therefore, the recovery of the genes shown in the current study, as well as proteins (see Navarro and Mandyam, 2015), contribute to the remyelination process during abstinence from alcohol exposure (Mi et al., 2009; see review Miguel-Hidalgo, 2018).
4.3. Moderate and Severe PTD Treatment Led to a Similar Pattern in Genes Involved in the Myelination Process in the Cerebellum
Thiamine deficiency has been shown to reduce myelinated fiber density, as well as cause damage to myelin sheaths in both humans and animals (Koike et al., 2003; Polegato et al., 2019). In Experiment 2, the cerebellum was an area of increased susceptibility to both moderate (EAS) and severe (MAS) PTD treatment, as there was downregulation in the Olig2 genes just after treatment and persistent suppression of gene markers of mature oligodendrocytes 24-h post-treatment. The expression levels of MOG were upregulated and MAG remained suppressed after the three-week recovery period following PTD-EAS and PTD-MAS treatment, respectively. This suggests that thiamine deficiency may alter myelin in the cerebellum for a longer duration.
Previous studies using both in vitro and in vivo models have found the cerebellum to be an area of increased susceptibility to thiamine deficiency. Studies in rodents using the PTD model have shown that pathology changes in brain regions, such as the cerebellum, are dependent on treatment duration and recovery periods (see review Mulholland, 2006; Witt, 1985). Irle and Markowitsch (1983) showed that both PTD treatment and long-term EtOH exposure (30% EtOH; 20 months) cause damage to cerebellar Purkinje cells and shrinkage of the granular layers of the vermis. Previous imaging studies in humans also found cerebellar atrophy, including white matter, which was associated with deficits in motor control and memory (Zhao et al., 2020; Kril and Harper, 2012). Although the cerebellum proved to be an area of increased susceptibility to both EtOH toxicity and thiamine deficiency, our findings revealed that myelin-related gene expression in the cerebellum varied as a function of recovery time from both moderate and severe thiamine deficiency treatment. Thus, thiamine deficiency is a trigger for the demyelination process in the cerebellum, but variability across cases is likely due to the extent of the thiamine deficiency.
The clustered suppression of the Olig1 and Olig2 gene expression in the parietal cortex for all experimental conditions provided strong evidence that the reduction in myelin precursors during CET, PTD, and CET-PTD was real. Furthermore, as depicted in Figure 3, clustering was apparent in the frontal cortex in the CET-PTD group, which showed upregulation of Olig2 and MAG after three weeks of recovery; clustering was also seen in the PTD-MAS group, which showed upregulation of MBP and MOG after three weeks of recovery from thiamine deficiency. Figure 3 also shows a similar pattern of alterations in gene expression in the parietal cortex, including a downregulation of gene levels after 24-h of abstinence from alcohol and an upregulation after three weeks of abstinence for Olig1, MBP, MAG, and MOG. Regarding the cerebellar gene expression data, Figure 3 shows similar clustering patterns, particularly in the downregulation after the acute recovery period for Olig2, MBP, MAG, and MOG in the CET, PTD-EAS, and PTD-MAS experimental conditions. Thus, it is likely that the similar patterns observed in these regions between the different genes were real effects.
However, a key limitation posed by this study that sex differences were not assessed. Given that only male Sprague-Dawley rats were used in this study, the extent to which effects can be translated to females is unclear. Thus, further studies on this topic should include female subjects along with male subjects, allowing for further examination in the effects of chronic EtOH consumption and thiamine deficiency on the expression of myelin-related genes in several critical brain regions.
5. Conclusion
Overall, thiamine deficiency and the combination of chronic EtOH and thiamine deficiency produced significant alterations in myelin-related gene expression. As hypothesized, the combined treatment of CET-PTD showed the greatest alterations of myelin-related gene expression in cortical areas. In contrast, in the cerebellum, chronic EtOH and thiamine deficiency both suppressed several myelin-related genes. The coordinated changes in multiple myelin genes in the cortex and the cerebellum may provide a molecular basis for white matter loss in individuals with chronic alcohol use disorders, particularly those that have nutritional deficits. Specifically, the suppression of the expression of multiple myelin genes may indicate that oligodendrocytes are particularly susceptible to the neurotoxic effects of thiamine deficiency and/or chronic EtOH. A critical finding was that most myelin-related genes recover three weeks after the conclusion of the thiamine deficiency and/or long-term abstinence from chronic EtOH exposure. This indicates that the alcohol-related disruption of oligodendrocyte production is likely reversible, and the recovery of myelination is possible in alcohol use disorders.
However, several factors likely modulate the recovery of myelin-related gene expression in alcohol-related brain damage, such as the duration of chronic EtOH exposure, the intermittency of EtOH exposure, the age at which EtOH exposure was initiated, and the subject’s genetic profile (see Varlinskaya et al, 2020). Our data further indicate a key role of thiamine deficiency in the suppression of myelin-related genes in the cortical and cerebellar regions.
Acknowledgments
This research was funded by an NIAAA R01 grant to LMS (RO1AA021775) and the Developmental Alcohol Exposure Research Center at Binghamton University (P50AA017823). The authors have no other conflicts of interest.
Abbreviations
- AUD
Alcohol-Use disorder
- ANOVA
Analysis of variance
- BEC
Blood Ethanol Concentration
- CET
Chronic EtOH exposure
- CET+T
Chronic EtOH exposure with thiamine injections
- CET-PTD
Chronic EtOH exposure with pyrithiamine-induced thiamine deficiency
- CT
Computed Tomography
- EtOH
Ethanol
- KS
Korsakoff Syndrome
- MRI
Magnetic Resonance Imaging
- MRPL13
Mitochondrial Ribosomal Protein L13
- MBP
Myelin Basic Protein
- MAG
Myelin associated glycoprotein
- MOG
Myelin oligodendrocyte protein
- Olig1
Oligodendrocyte transcription factor 1
- Olig2
Oligodendrocyte transcription factor 2
- PF
Pair-Fed
- PTD
Pyrithiamine-induced thiamine deficiency
- PTD-EAS
Pyrithiamine-induced thiamine deficiency- early acute stage
- PTD-MAS
Pyrithiamine-induced thiamine deficiency- moderate acute stage
- RT-PCR
Reverse transcription polymerase chain reaction
- 18S rRNA
18s Ribosomal RNA subunit
6. References
- Adams RD (1976) Nutritional cerebellar degeneration, in Handbook of Clinical Neurology, Vol. 28 (Metabolic and Deficiency Diseases of the Nervous System, Part II) (Vinken PJ, Bruyn GW eds), pp. 271–283. North-Holland Publ. Co., Amsterdam. [Google Scholar]
- Alfonso-Loeches S, Pascual M, Gómez-Pinedo U, Pascual-Lucas M, Renau-Piqueras J, Guerri C (2012) Toll-like receptor 4 participates in the myelin disruptions associated with chronic alcohol abuse. Glia 60:948–964. [DOI] [PubMed] [Google Scholar]
- Alhassoon OM, Sorg SF, Taylor MJ, Stephan RA, Schweinsburg BC, Stricker NH, Gongvatana A, Grant I (2012) Callosal white matter microstructural recovery in abstinent alcoholics: a longitudinal diffusion tensor imaging study. Alcohol Clin Exp Res 36:1922–1931. [DOI] [PMC free article] [PubMed] [Google Scholar]
- Aloe L, Tirassa P (1992) The effect of long-term alcohol intake on brain NGF-target cells of aged rats. Alcohol 9:299–304. [DOI] [PubMed] [Google Scholar]
- Arts NJ, Walvoort SJ, Kessels RP (2017) Korsakoff’s syndrome: a critical review. Neuropsychiatr Dis Treat 13:2875–2890. [DOI] [PMC free article] [PubMed] [Google Scholar]
- Barateiro A, Fernandes A (2014) Temporal oligodendrocyte lineage progression: in vitro models of proliferation, differentiation and myelination. Biochim Biophys Acta 1843:1917–1929. [DOI] [PubMed] [Google Scholar]
- Bjelke B Seiger A (1989). Morphological distribution of MBP-like immunoreactivity in the brain during development. Int J Dev Neurosci 7:145–164. [DOI] [PubMed] [Google Scholar]
- Brenhouse HC, Andersen SL (2011) Developmental trajectories during adolescence in males and females: a cross-species understanding of underlying brain changes. Neurosci Biobehav Rev 35:1687–1703. [DOI] [PMC free article] [PubMed] [Google Scholar]
- Cadete-Leite A, Pereira PA, Madeira MD, Paula-Barbosa MM (2003) Nerve growth factor prevents cell death and induces hypertrophy of basal forebrain cholinergic neurons in rats withdrawn from prolonged ethanol intake. Neuroscience 119:1055–1069. [DOI] [PubMed] [Google Scholar]
- Cao J, Dwyer JB, Gautier NM, Leslie FM, Li MD (2013) Central myelin gene expression during postnatal development in rats exposed to nicotine gestationally. Neurosci Lett 553:115–120. [DOI] [PMC free article] [PubMed] [Google Scholar]
- Ciccia RM, Langlais PJ (2000) An examination of the synergistic interaction of ethanol and thiamine deficiency in the development of neurological signs and long-term cognitive and memory impairments. Alcohol Clin Exp Res 24:622–634. [PubMed] [Google Scholar]
- de la Monte SM (1988) Disproportionate atrophy of cerebral white matter in chronic alcoholics. Arch Neurol 45:990–992. [DOI] [PubMed] [Google Scholar]
- de la Monte SM, Kril JJ (2014) Human alcohol-related neuropathology. Acta Neuropathol 127:71–90. [DOI] [PMC free article] [PubMed] [Google Scholar]
- Doremus-Fitzwater TL, Gano A, Paniccia JE, Deak T (2015) Male adolescent rats display blunted cytokine responses in the CNS after acute ethanol or lipopolysaccharide exposure. Physiol Behav 148:131–144. [DOI] [PMC free article] [PubMed] [Google Scholar]
- Fernandez-Lizarbe S, Montesinos J, Guerri C (2013) Ethanol induces TLR4/TLR2 association, triggering an inflammatory response in microglial cells. J Neurochem 126:261–273. [DOI] [PubMed] [Google Scholar]
- Figlewicz DA, Quarles RH, Johnson D, Barbarash GR, Sternberger NH (1981) Biochemical demonstration of the myelin-associated glycoprotein in the peripheral nervous system. J Neurochem 37:749–758. [DOI] [PubMed] [Google Scholar]
- Fu H, Qi Y, Tan M, Cai J, Takebayashi H, Nakafuku M, Richardson W, Qiu M (2002) Dual origin of spinal oligodendrocyte progenitors and evidence for the cooperative role of Olig2 and Nkx2.2 in the control of oligodendrocyte differentiation. Development 129:681–693. [DOI] [PubMed] [Google Scholar]
- Geibprasert S, Gallucci M, Krings T (2010) Alcohol-induced changes in the brain as assessed by MRI and CT. Eur Radiol 20:1492–1501. [DOI] [PubMed] [Google Scholar]
- Hammoud N, Jimenez-Shahed J (2019) Chronic neurologic effects of alcohol. Clin Liver Dis 23:141–155. [DOI] [PubMed] [Google Scholar]
- Harper C (1998) The neuropathology of alcohol-specific brain damage, or does alcohol damage the brain? J Neuropathol Exp Neurol 57:101–110. [DOI] [PubMed] [Google Scholar]
- Harper C (2009) The neuropathology of alcohol-related brain damage. Alcohol 44:136–140. [DOI] [PubMed] [Google Scholar]
- Harper C, Kril J (1985) Brain atrophy in chronic alcoholic patients: a quantitative pathological study. J Neurol Neurosurg Psychiatry 48:211–217. [DOI] [PMC free article] [PubMed] [Google Scholar]
- Harper CG, Sheedy DL, Lara AI, Garrick TM, Hilton JM, Raisanen J (1998) Prevalence of Wernicke-Korsakoff syndrome in Australia: has thiamine fortification made a difference? Med J Aust 168:542–545. [DOI] [PMC free article] [PubMed] [Google Scholar]
- He X, Sullivan EV, Stankovic RK, Harper CG, Pfefferbaum A (2007) Interaction of thiamine deficiency and voluntary alcohol consumption disrupts rat corpus callosum ultrastructure. Neuropsychopharmacology 32:2207–2216. [DOI] [PubMed] [Google Scholar]
- Irle E, Markowitsch HJ (1983) Widespread neuroanatomical damage and learning deficits following chronic alcohol consumption or vitamin-B 1 (thiamine) deficiency in rats. Behav Brain Res 9:277–294. [DOI] [PubMed] [Google Scholar]
- Jacobus J, Squeglia LM, Bava S, Tapert SF (2013) White matter characterization of adolescent binge drinking with and without co-occurring marijuana use: a 3-year investigation. Psychiatry Res 214:374–381. [DOI] [PMC free article] [PubMed] [Google Scholar]
- Koike H, Iijima M, Sugiura M, Mori K, Hattori N, Ito H, Hirayama M, Sobue G (2003) Alcoholic neuropathy is clinicopathologically distinct from thiamine-deficiency neuropathy. Ann Neurol 54:19–29. [DOI] [PubMed] [Google Scholar]
- Kopelman MD, Thomson AD, Guerrini I, Marshall EJ (2009) The Korsakoff syndrome: clinical aspects, psychology and treatment. Alcohol and Alcoholism 44:148–154. [DOI] [PubMed] [Google Scholar]
- Kril JJ, Halliday GM, Svoboda MD, Cartwright H (1997) The cerebral cortex is damaged in chronic alcoholics. Neuroscience 79:983–998. [DOI] [PubMed] [Google Scholar]
- Kril JJ, Harper CG (2012) Neuroanatomy and neuropathology associated with Korsakoff’s syndrome. Neuropsychol Rev 22:72–80. [DOI] [PMC free article] [PubMed] [Google Scholar]
- Langlais PJ, Savage LM (1995) Thiamine deficiency in rats produces cognitive and memory deficits on spatial tasks that correlate with tissue loss in diencephalon, cortex and white matter. Behav Brain Res 68: 75–89. [DOI] [PubMed] [Google Scholar]
- Langlais PJ, Zhang SX (1997) Cortical and subcortical white matter damage without Wernicke’s encephalopathy after recovery from thiamine deficiency in the rat. Alcohol Clin Exp Res 21:434–443. [DOI] [PubMed] [Google Scholar]
- Lewohl JM, Wang L, Miles MF, Zhang L, Dodd PR, Harris RA (2000) Gene expression in human alcoholism: microarray analysis of frontal cortex. Alcohol Clin Exp Res 24:1873–1882. [PubMed] [Google Scholar]
- Lewohl JM, Wixey J, Harper CG, Dodd PR (2005) Expression of MBP, PLP, MAG, CNP, and GFAP in the Human Alcoholic Brain. Alcohol Clin Exp Res 29:1698–1705. [DOI] [PubMed] [Google Scholar]
- Luciana M (2013) Adolescent brain development in normality and psychopathology. Dev Psychopathol 25:1325–1345. [DOI] [PMC free article] [PubMed] [Google Scholar]
- Mann K, Agartz I, Harper C, Shoaf S, Rawlings RR, Momenan R, Hommer DW, Pfefferbaum A, Sullivan EV, Anton RF, Drobes DJ, George MS, Bares R, Machulla HJ, Mundle G, Reimold M, Heinz A (2001) Neuroimaging in alcoholism: ethanol and brain damage. Alcohol Clin Exp Res 25:104S–109S. [DOI] [PubMed] [Google Scholar]
- Marie Y, Sanson M, Mokhtari K, Leuraud P, Kujas M, Delattre JY, Poirier J, Zalc B, Hoang-Xuan K (2001) OLIG2 as a specific marker of oligodendroglial tumour cells. Lancet 358:298–300. [DOI] [PubMed] [Google Scholar]
- Matthieu JM, Brady RO, Quarles RH (1974) Developmental change in a myelin-associated glycoprotein: a comparative study in rodents. Dev Biol 37:146–152. [DOI] [PubMed] [Google Scholar]
- Mayfield RD, Lewohl JM, Dodd PR, Herlihy A, Liu J, Harris RA (2002) Patterns of gene expression are altered in the frontal and motor cortices of human alcoholics. J Neurochem 81:802–813. [DOI] [PubMed] [Google Scholar]
- Mi S, Miller RH, Tang W, Lee X, Hu B, Wu W, Zhang Y, Shields CB, Miklasz S, Shea D, Mason J, Franklin RJ, Ji B, Shao Z, Chédotal A, Bernard F, Roulois A, Xu J, Jung V, Pepinsky B (2009) Promotion of central nervous system remyelination by induced differentiation of oligodendrocyte precursor cells. Ann Neurol 65:304–315. [DOI] [PubMed] [Google Scholar]
- Miguel-Hidalgo JJ (2018) Molecular neuropathology of astrocytes and oligodendrocytes in alcohol use disorders. Front Mol Neurosci 11:78–86. [DOI] [PMC free article] [PubMed] [Google Scholar]
- Miguel-Hidalgo JJ, Hall KO, Bonner H, Roller AM, Syed M, Park CJ, Ball JP, Rothenberg ME, Stockmeier CA, Romero DG (2017) MicroRNA-21: expression in oligodendrocytes and correlation with low myelin mRNAs in depression and alcoholism. Prog Neuropsychopharmacol Biol Psychiatry 79:503–514. [DOI] [PMC free article] [PubMed] [Google Scholar]
- Mulholland PJ (2006) Susceptibility of the cerebellum to thiamine deficiency. Cerebellum 5:55–63. [DOI] [PubMed] [Google Scholar]
- National Research Council (2011) Guide for the Care and Use of Laboratory Animals. 8th ed. The National Academies Press, Washington, DC. [Google Scholar]
- Navarro AI, Mandyam CD (2015) Protracted abstinence from chronic ethanol exposure alters the structure of neurons and expression of oligodendrocytes and myelin in the medial prefrontal cortex. Neuroscience 293:35–44. [DOI] [PMC free article] [PubMed] [Google Scholar]
- Obernier JA, White AM, Swartzwelder HS, Crews FT (2002) Cognitive deficits and CNS damage after a 4-day binge ethanol exposure in rats. Pharmacol Biochem Behav 72:521–532. [DOI] [PubMed] [Google Scholar]
- Pfefferbaum A, Adalsteinsson E, Sullivan EV (2006) Supratentorial profile of white matter microstructural integrity in recovering alcoholic men and women. Biol Psychiatry 59:364–372. [DOI] [PubMed] [Google Scholar]
- Pfefferbaum A, Rosenbloom MJ, Adalsteinsson E, Sullivan EV (2007) Diffusion tensor imaging with quantitative fibre tracking in HIV infection and alcoholism comorbidity: synergistic white matter damage. Brain 130:48–64. [DOI] [PubMed] [Google Scholar]
- Pfefferbaum A, Rosenbloom MJ, Chu W, Sassoon SA, Rohlfing T, Pohl KM, Zahr NM, Sullivan EV (2014) White matter microstructural recovery with abstinence and decline with relapse in alcohol dependence interacts with normal ageing: a controlled longitudinal DTI study. Lancet Psychiatry 1:202–212. [DOI] [PMC free article] [PubMed] [Google Scholar]
- Pfefferbaum A, Sullivan EV, Mathalon DH, Shear PK, Rosenbloom MJ, Lim KO (1995) Longitudinal changes in magnetic resonance imaging brain volumes in abstinent and relapsed alcoholics. Alcohol Clin Exp Res 19:1177–1191. [DOI] [PubMed] [Google Scholar]
- Phillips SC, Harper CG, Kril JJ (1990) The contribution of Wernicke’s encephalopathy to alcohol-related cerebellar damage. Drug Alcohol Rev 9:53–60. [DOI] [PubMed] [Google Scholar]
- Pires RG, Pereira SR, Oliveira-Silva IF, Franco GC, Ribeiro AM (2005) Cholinergic parameters and the retrieval of learned and re-learned spatial information: a study using a model of Wernicke-Korsakoff Syndrome. Behav Brain Res 162:11–21. [DOI] [PubMed] [Google Scholar]
- Pitel AL, Chételat G, Le Berre AP, Desgranges B, Eustache F, Beaunieux H (2012) Macrostructural abnormalities in Korsakoff syndrome compared with uncomplicated alcoholism. Neurology 78:1330–1333. [DOI] [PubMed] [Google Scholar]
- Polegato BF, Pereira AG, Azevedo PS, Costa NA, Zornoff LAM, Paiva SAR, Minicucci MF (2019) Role of thiamin in health and disease. Nutr Clin Pract 34:558–564. [DOI] [PubMed] [Google Scholar]
- Reilly MT, Noronha A, Warren K (2014) Perspectives on the neuroscience of alcohol from the National Institute on Alcohol Abuse and Alcoholism. Handb Clin Neurol 125:15–29. [DOI] [PubMed] [Google Scholar]
- Ritz L, Coulbault L, Lannuzel C, Boudehent C, Segobin S, Eustache F, Vabret F, Pitel AL, Beaunieux H (2016) Clinical and Biological Risk Factors for Neuropsychological Impairment in Alcohol Use Disorder. PLoS One 11:e0159616. [DOI] [PMC free article] [PubMed] [Google Scholar]
- Segobin S, Laniepce A, Ritz L, Lannuzel C, Boudehent C, Cabe N, Urso L, Vabret F, Eustache F, Beaunieux H, Pitel AL (2019). Dissociating thalamic alterations in alcohol use disorder defines specificity of Korsakoff’s syndrome. Brain, 142:1458–1470. [DOI] [PubMed] [Google Scholar]
- Sullivan EV, Pfefferbaum A (2009) Neuroimaging of the Wernicke–Korsakoff syndrome. Alcohol and Alcoholism 44:155–165. [DOI] [PMC free article] [PubMed] [Google Scholar]
- Toledo Nunes P, Vedder LC, Deak T, Savage LM (2019) A pivotal role for thiamine deficiency in the expression of neuroinflammation markers in models of alcohol-related brain damage. Alcohol Clin Exp Res 43:425–438. [DOI] [PMC free article] [PubMed] [Google Scholar]
- Trapp BD, Nishiyama A, Cheng D, Macklin W (1997) Differentiation and death of premyelinating oligodendrocytes in developing rodent brain. J Cell Biol 137:459–468. [DOI] [PMC free article] [PubMed] [Google Scholar]
- Varlinskaya EI, Hosová D, Towner T, Werner DF, Spear LP (2020) Effects of chronic intermittent ethanol exposure during early and late adolescence on anxiety-like behaviors and behavioral flexibility in adulthood. Behav Brain Res 378:112292. [DOI] [PMC free article] [PubMed] [Google Scholar]
- Vedder LC, Hall JM, Jabrouin KR, Savage LM (2015) Interactions between chronic ethanol consumption and thiamine deficiency on neural plasticity, spatial memory, and cognitive flexibility. Alcohol Clin Exp Res 39:2143–2153. [DOI] [PMC free article] [PubMed] [Google Scholar]
- Wolstenholme JT, Mahmood T, Harris GM, Abbas S, Miles MF (2017) Intermittent ethanol during adolescence leads to lasting behavioral changes in adulthood and alters gene expression and histone methylation in the PFC. Front Mol Neurosci 10:307. [DOI] [PMC free article] [PubMed] [Google Scholar]
- Witt ED (1985) Neuroanatomical consequences of thiamine deficiency: a comparative analysis. Alcohol Alcohol 20:201–221. [PubMed] [Google Scholar]
- Yang Y, Cheng Z, Tang H, Jiao H, Sun X, Cui Q, Luo F, Pan H, Ma C, Li B. (2017). Neonatal Maternal Separation Impairs Prefrontal Cortical Myelination and Cognitive Functions in Rats Through Activation of Wnt Signaling. Cereb Cortex 27:2871–2884. [DOI] [PubMed] [Google Scholar]
- Zhao Q, Pfefferbaum A, Podhajsky S, Pohl KM, Sullivan EV (2020) Accelerated aging and motor control deficits are related to regional deformation of central cerebellar white matter in alcohol use disorder. Addict Biol 25:e12746. [DOI] [PMC free article] [PubMed] [Google Scholar]