Abstract
Germinal centers (GCs), structures normally associated with B cell immunoglobulin (Ig) hypermutation and development of high-affinity antibodies upon infection or immunization, are present in gut-associated lymphoid organs of humans and mice under steady state. Gut-associated (ga)GCs can support antibody responses to enteric infections and immunization1. However, whether B cell selection and antibody affinity maturation can take place in face of the chronic and diverse antigenic stimulation characteristic of steady-state gaGCs is less clear2–8. Combining multicolor “Brainbow” fate-mapping and single-cell Ig sequencing, we find that 5–10% of gaGCs from specific pathogen-free (SPF) mice contained highly-dominant “winner” clones at steady state, despite rapid turnover of GC B cells. Monoclonal antibodies (mAbs) derived from these clones showed increased binding to commensal bacteria compared to their unmutated ancestors, consistent with antigen-driven selection and affinity maturation. Frequency of highly-selected gaGCs was markedly higher in germ-free (GF) than in SPF mice, and winner B cells in GF gaGCs were enriched in public IgH clonotypes found across multiple individuals, indicating strong B cell receptor (BCR)-driven selection in the absence of microbiota. Vertical colonization of GF mice with a defined microbial consortium (Oligo-MM12) did not eliminate GF-associated clonotypes, yet induced a concomitant commensal-specific, affinity-matured B cell response. Thus, positive selection can take place in steady-state gaGCs, at a rate that is tunable over a wide range by the presence and composition of the microbiota.
Our intestines are constantly exposed to large amounts of antigen derived from diet and commensal microbes. Interaction of these antigens with the immune system takes place primarily in gut-associated secondary lymphoid structures, including gut-draining mesenteric lymph nodes (mLN) and Peyer’s patches (PPs), where gaGCs provide a site for hypermutation of Ig genes even under steady state5,9. BCR-driven selection and affinity maturation occur efficiently in gaGCs upon oral immunization6,10. However, given previous reports that steady-state gaGCs can form in a BCR-independent fashion2,6, show little evidence of BCR-driven selection at the sequence level3, and are associated with the selection of polyreactive Igs4, it has been postulated that gaGCs may act predominantly as diversifiers of the Ig repertoire, rather than fostering affinity maturation towards commensal microbes (reviewed in5,8). We thus sought to determine the extent to which GC selection and antibody affinity maturation occur in the midst of chronic antigenic stimulation and to define the impact of the microbiota on these processes.
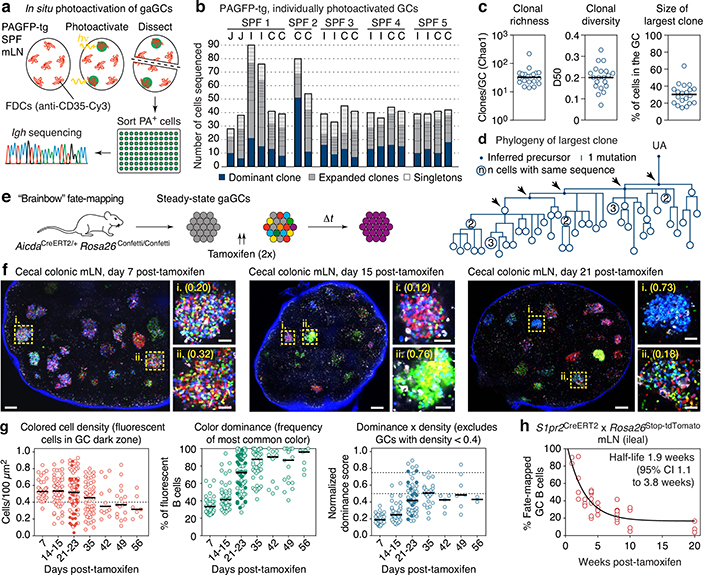
To estimate the rate of B cell selection in steady-state gaGCs, we first used in situ photoactivation11,12 (Fig. 1a and Extended Data Fig. 1a) to sequence B cells from 20 individual gaGCs from various mLNs of 5 photoactivatable (PA)-GFP-transgenic mice housed under SPF conditions. Clonal diversity in SPF gaGCs spanned a wide range, with a median of 33 clones per GC (using the Chao1 estimator), D50 (fraction of clones accounting for 50% of sequenced cells) of 0.20, and 30% of B cells belonging to the largest clone (Fig. 1b–c). One of 20 GCs sequenced contained a highly dominant clone that accounted for 64% of cells in that GC (Fig. 1b–c). Analysis of somatic mutations within this clone (Fig. 1d) showed the nested expansion of nodes with increasing numbers of mutations (indicated by arrows) typical of sequential positive selection.
Fig. 1 |. Kinetics of clonal selection in steady-state gaGCs.
(a) Experimental setup. (b) Clonal composition of individual GCs from five mice (SPF1–5) obtained as in (a). J, jejunal; I, ileal; C, cecal-colonic mLN. (c) Quantification of data in (a-b). Each symbol represents one GC. Median indicated. (d) Igh sequence relationship among B cells from the largest B cell clone in the sample. Arrows indicate putative positive selection events. UA, unmutated ancestor. (e) Experimental setup. (f) Multiphoton images of mLN of SPF mice at different times after tamoxifen treatment. Blue is collagen (2nd harmonics), white is autofluorescence, other colors are from the Confetti allele. Scalebars, 200 μm (overviews), 50 μm (close-ups). (g) Quantification of images as in (f). Each symbol is one GC. Only GCs with density > 0.4 fluorescent cells/100 μm2 are included in NDS calculation. Filled symbols indicate data from two mice in which tamoxifen was administered intraperitoneally. Median indicated. Data are from 3–5 mice per timepoint at days 14–35 and 1–2 mice for day 7 and later timepoints. (h) SPF S1pr2CreERT2 x Rosa26Stop-tdTomato mice were given 2 doses of tamoxifen, 2 days apart, to label GC B cells. Graph shows proportion of tdTomato+ mLN GC B cells assayed by flow cytometry at the timepoint indicated, counting from the first dose of tamoxifen. Each symbol represents one mouse. Half-life was quantified using a one-phase exponential decay function (black line). Gating strategies detailed in Extended Data Fig. 1a–c.
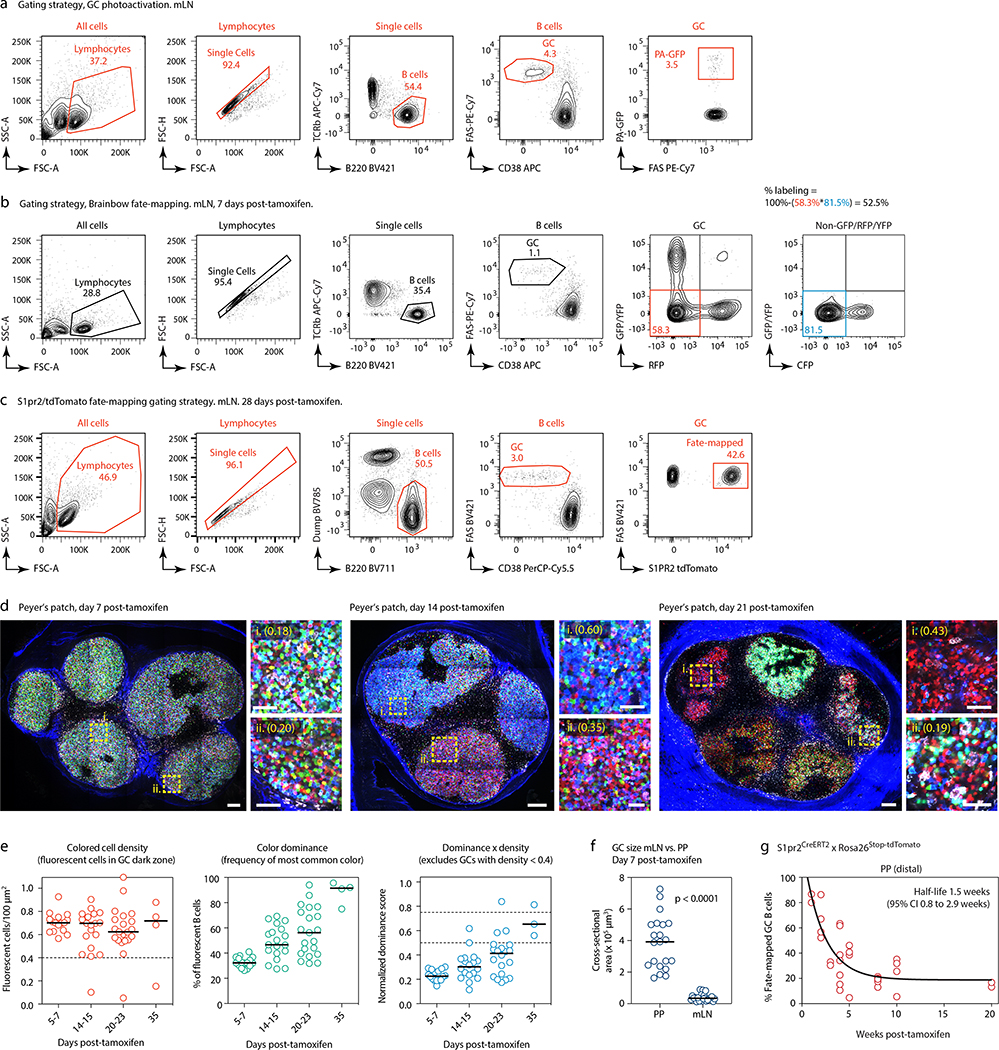
This was confirmed in a much larger number of GCs using Brainbow13 multicolor fate-mapping11 (see supplementary text). We fate-mapped steady-state gaGC B cells in AicdaCreERT2/+.Rosa26Confetti/Confetti (AID-Confetti)_mice held under SPF conditions by administering 2 doses of tamoxifen, 2 days apart (Fig. 1e). This labeled ~ 50% of B cells in both mLNs and PPs, as estimated by the density of colored cells in the GC and by flow cytometry experiments (Fig. 1f, g and Extended Data Fig. 1b). This fraction decreased progressively after labeling, likely as a result of GC B cells being replaced by incoming unlabeled clones as the response evolved (Fig. 1f, g). Because density estimations using Brainbow are sensitive to dropout of low-fluorescence GCs, we measured GC turnover by flow cytometry using the S1pr2CreERT2 BAC-transgene14 crossed to the Rosa26Stop-tdTomato reporter. Pulse-labeling using this model allowed us to place the half-life of gaGC B cells at ~2 weeks under SPF conditions (Fig. 1h and Extended Data Fig. 1c).
Despite this rapid turnover, the normalized dominance score (NDS, an estimate of the frequency of B cells in a GC that carry the dominant color11,15, see supplementary text) in gaGCs increased progressively through day 23 post-tamoxifen, when 11% of GCs (6/57) scored 0.75 or higher (Fig. 1f, g). The strongest clonal expansions that occur in mLN GCs are therefore large and rapid enough to generate dominant lineages, despite replacement of labeled clones with incoming unlabeled B cells. In PP GCs, clonal selection progressed at a slower rate (Extended Data Fig. 1d, e), as expected from their much larger size and similar rate of turnover (Extended Data Fig. 1f, g). However, GCs with NDS > 0.5 could occasionally be detected as early as day 14 post-tamoxifen, peaking at day 23 post-tamoxifen, when 19% of PPs (3/21) had reached NDS > 50% (Extended Data Fig. 1e). We conclude that clonal selection is detectable in gaGCs, despite chronic exposure to a high burden and diversity of foreign antigens and the rapid turnover of B cell clones.
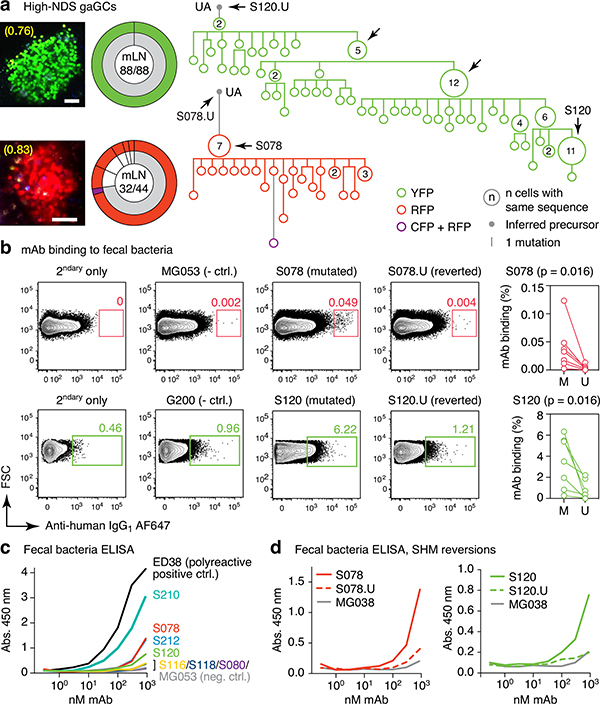
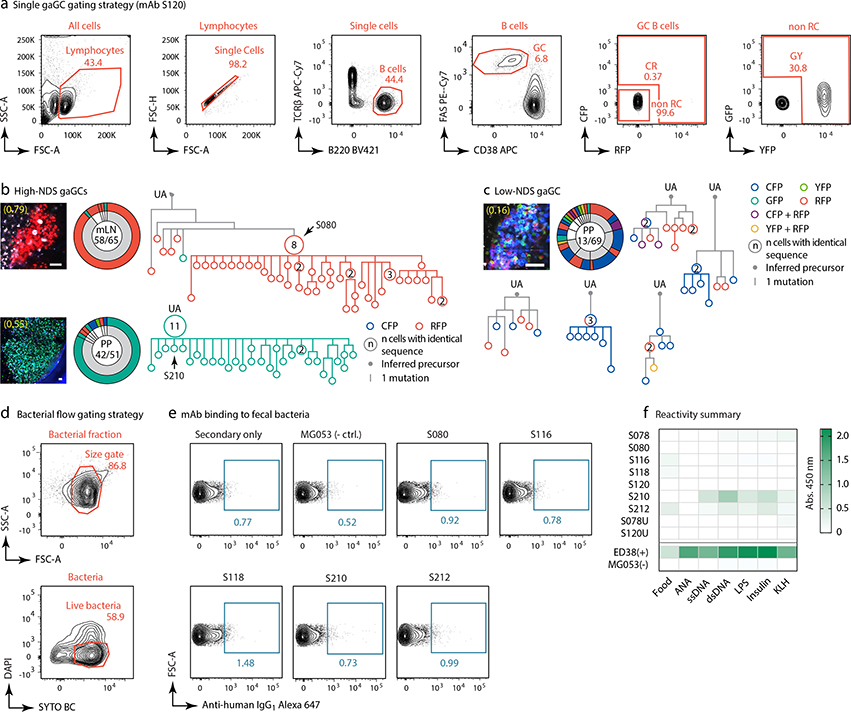
To understand the relationship between clonal selection and affinity maturation in gaGCs, used vibratome slicing of agarose-embedded AID-Confetti LNs11 (Extended Data Fig. 2a) to isolate GCs containing “winner” clones, where antigen-driven selection is most likely to have occured11. Igh sequencing of B cells sorted from such GCs showed evidence of “clonal bursts,” jackpot-type positive selection events in which multiple B cells descending from a single somatic hypermutation (SHM) variant account for a large fraction of cells in a GC11 (Fig. 2a, Extended Data Fig. 2a–c). Because clonal bursts are regularly associated with acquisition of affinity-enhancing mutations11, we produced recombinant monoclonal antibodies (mAbs)16 using burst-point sequences to probe for binding to commensal bacteria (Table S1). Despite the variation inherent to bacterial flow cytometry, 2 of 7 antibodies produced from burst-associated Ig sequences reproducibly bound fecal bacteria (Fig. 2b and Extended Data Fig. 2d, e). Binding followed different patterns: whereas mAb S078 bound strongly to a small population of bacteria, mAb S120 bound with moderate intensity to a much larger cohort (Fig. 2b). These two antibodies, as well as two other clones (S210 and S212) reacted with bacteria-rich centrifugation fractions, as assayed by ELISA (Fig. 2c). Only S210 and S212 showed a mild degree of polyreactivity using standard measures4,17 (Extended Data Fig. 2f). Reversion of somatic mutations in S078 and S120 resulted in decreased binding to bacteria by both flow cytometry and ELISA (Fig. 2b and d). Thus, commensal binding with the characteristic features of affinity maturation is detectable in steady-state gaGCs when analysis is focused on strongly selected GC winner clones.
Fig. 2 |. Selection of commensal-binding clones in steady-state gaGCs.
(a) Igh sequence relationship among B cells from high-NDS GCs sorted as in Extended Data Fig. 2a. Images and pie charts show clone/color distribution for each GC. Numbers within images are NDS; numbers in pies are (cells in major clone/total cells sequenced). Phylogenies for major clones (grey in the pie charts) are shown. Arrows indicate “clonal burst” points; names are indicated whenever a recombinant mAb was generated from a sequence (see Table S1). UA, unmutated ancestor. Scalebars, 50 μm. Additional trees provided in Extended Data Fig. 2b–c. (b) Binding of mAbs to SPF fecal bacteria. Gated on SYTO BC+, DAPI– live bacteria, as in Extended Data Fig. 2d. Clone MG053 and G200 (see below) are non-bacteria-reactive negative controls. Graph summarizes 7 independent experiments (M, mutated; U, unmutated). Background (% positive in 2ndary only) is subtracted from all datapoints. P-values are for two-tailed Wilcoxon paired samples test. (c) mAb binding to fecal bacteria by ELISA. mAb dilution is indicated on the X-axis. Lines are mean of three assays. (d) As in (c) but showing mAbs S078 and S120 as well as their unmutated ancestors.
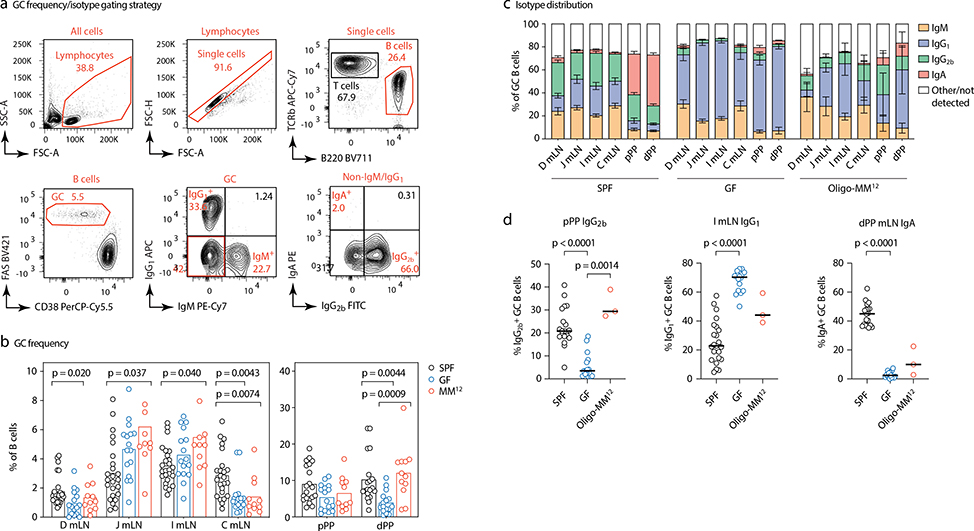
To investigate the influence of commensal diversity on gaGC selection dynamics, we rederived AID-Confetti mice into GF conditions, in which GCs still form18, as well as into stable vertical colonization with a consortium of 12 bacterial strains representing major phyla present in the mouse gut19 (Oligo-MM12; Extended Data Fig. 3). When compared to SPF mice, GF mice had higher frequencies of GC B cells in jejunal and ileal mLN20 and lower frequencies in duodenal and cecal-colonic mLN and PPs (Extended Data Fig. 4a–b). GF GCs were strongly skewed away from IgG2b and IgA towards IgG1 (Extended Data Fig. 4c). Colonization with Oligo-MM12 microbiota partly restored the phenotype of SPF mice, increasing GC B cell frequency in distal PP and IgG2b in proximal PP (Extended Data Fig. 4d).
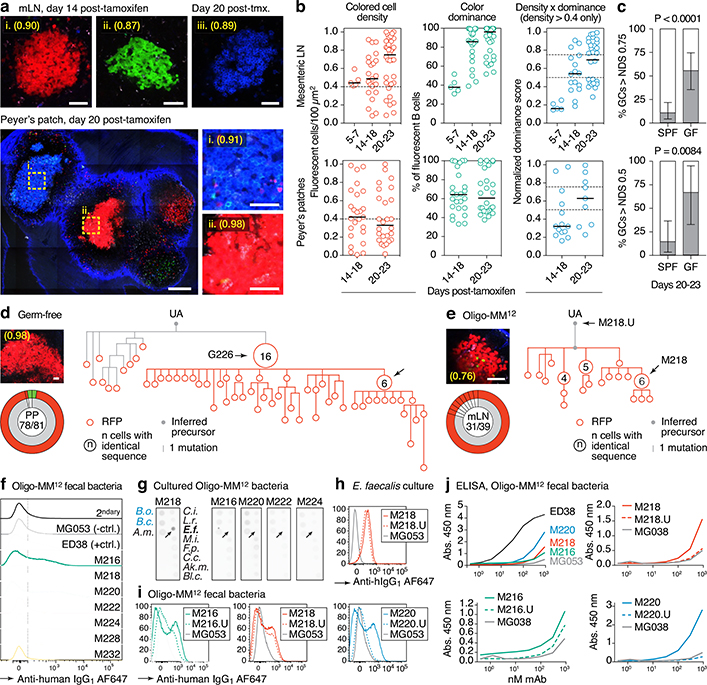
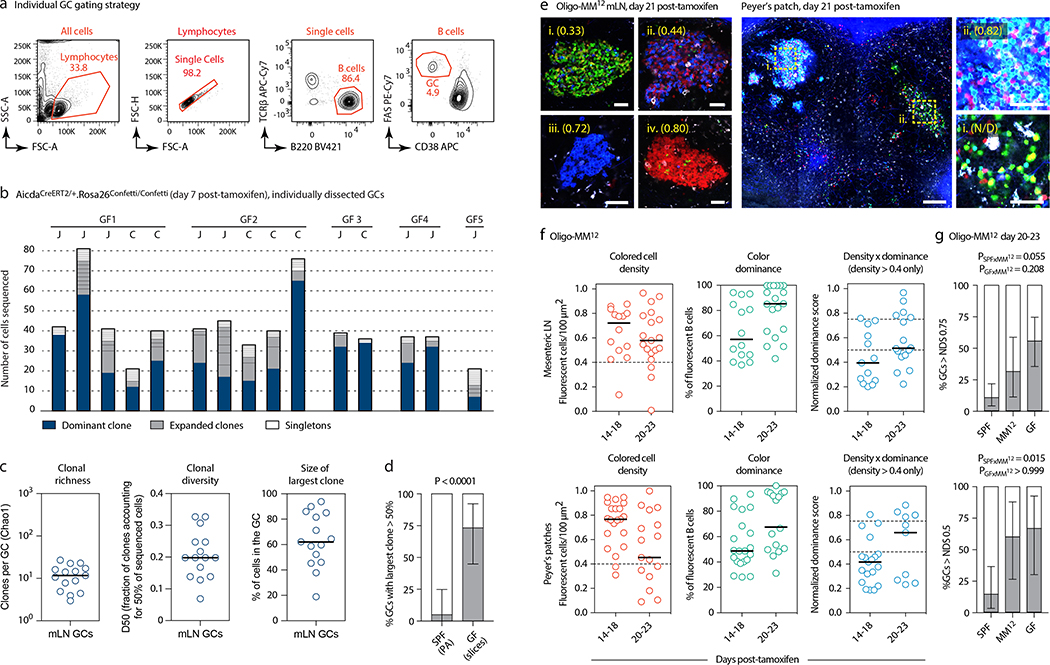
Multicolor fate-mapping showed that strongly-selected GCs accumulated at a markedly faster rate in GF mice than under SPF conditions (Fig. 3a–c). By day 23 post-tamoxifen, roughly 56% of mLN GCs had reached an NDS of 0.75 or higher, compared to ~11% in SPF mice (Fig. 3c). This was confirmed at the Igh sequence level: 11 of 14 mLN GCs picked at random from vibratome slices had dominant clones that accounted for >50% of all B cells in the GC, compared to 1 of 20 GCs in SPF conditions (Extended Data Fig. 5a–d and Fig. 1a–c). Faster selection of Brainbow colors was also observed in GF PP, where 6 of 9 GCs exceeded an NDS of 0.5 by day 20–23 post-tamoxifen, compared to 3 of 21 under SPF conditions (Fig. 3a–c). GC selection in Oligo-MM12-colonized mice fell between SPF and GF rates (Extended Data Fig. 5e–g). Therefore, selection in gaGCs is not dependent on a fully diverse microbiota, and in fact becomes accelerated in the absence of commensal bacteria.
Fig. 3 |. Accelerated selection in gaGCs of GF and Oligo-MM12-colonized mice.
(a) Multiphoton images of GF mLN and PP at different times after tamoxifen. Blue is collagen (2nd harmonics), white is autofluorescence, other colors are from the Confetti allele. Scalebars, 200 μm (PP overview), 50 μm (close-ups). (b) Quantification of images as in (a) for mLN (top) and PP (bottom). Each symbol represents one GC. Median indicated. Only GCs with density > 0.4 fluorescent cells/100 μm2 are included in NDS calculation. (c) Proportion of GCs with NDS > 0.75 in mLN (top) and > 0.5 in PP (bottom) under SPF and GF conditions at 20–23 days post-tamoxifen. For SPF and GF mLN gaGCs, n = 57 and 27 respectively. For PP gaGCs, n=21 and 9, respectively. SPF data are from Fig. 1g and Extended Data Fig. 1e. n= P-value is for two-tailed Fisher’s exact test. Error bars represent the exact binomial 95% confidence interval. Data for (b,c) are from 3–5 mice per timepoint, except D5–7 that is from 1 mouse. (d, e) Igh sequence relationship among B cells from GF (d) and Oligo-MM12 (e) GCs with high NDS. Details as in Fig. 2a. Additional trees provided in Extended Data Fig. 6a, b. Scalebars, 50 μm (f) Flow cytometry of Oligo-MM12 mAbs binding to fecal bacteria from Oligo-MM12-colonized mice. ED38, polyreactive positive control mAb; MG053, negative control mAb. Dotted line placed at 102 for reference. (g) Dot blot showing binding of Oligo-MM12 mAbs to a subset of cultured Oligo-MM12 strains (black font, see Table S4). Bacteroides ovatus (B.o.) and Bacteroides caccae (B.c.) are negative controls (blue font). Arrows indicate Enterococcus faecalis, bound only by M218. (h, i) Binding of mAb M218 to cultured E. faecalis (h) and of 3 Oligo-MM12 mAbs to fecal bacteria from Oligo-MM12-colonized mice (i) by flow cytometry. Gated on SYTO BC+, DAPI– live bacteria as in Extended Data Fig. 2d. (j) mAb binding to fecal bacteria by ELISA. Lines are mean of two assays.
Clonal phylogenies of single-colored GCs from GF and Oligo-MM12-colonized mice revealed strong clonal bursting, as evidenced by presence of large expansions of B cells with identical VH sequences and multiple inferred descendants (arrows in Fig. 3d, e and Extended Data Fig. 6a, b). We produced mAbs from 16 Ig sequences strongly selected under each condition (including those indicated by named arrows in Fig. 3d, e and Extended Data Fig. 6a, b; Table S1). Of 7 mAbs cloned from Oligo-MM12, three (M216, M218, and M220) bound fecal bacteria from Oligo-MM12-colonized mice (Fig. 3f, i, j), and mAb M218 bound to cultured Enterococcus faecalis by both flow cytometry and dot blot (Fig. 3g, h). Reversion of somatic mutations resulted in larger decreases in binding for M216 and M220 and a more modest decrease for M218, evidenced both by flow cytometry and ELISA (Fig. 3h–j). Thus, as with SPF microbiota, vertical colonization with Oligo-MM12 triggers efficient affinity maturation towards commensals in steady-state gaGCs.
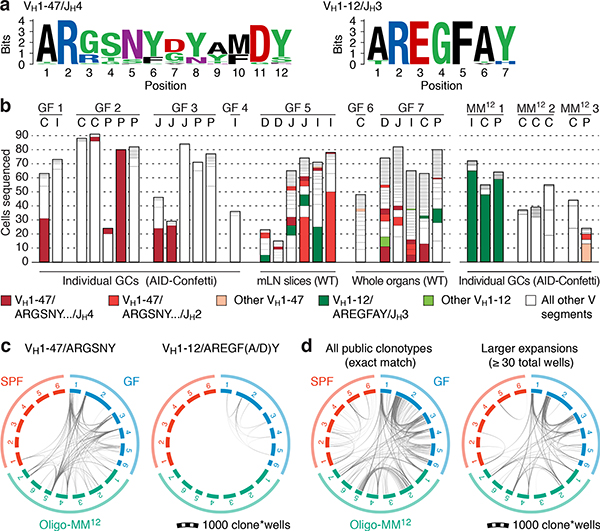
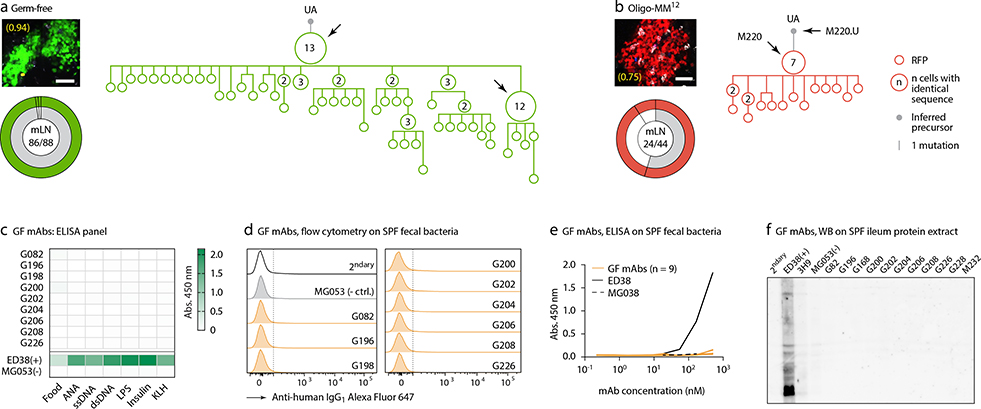
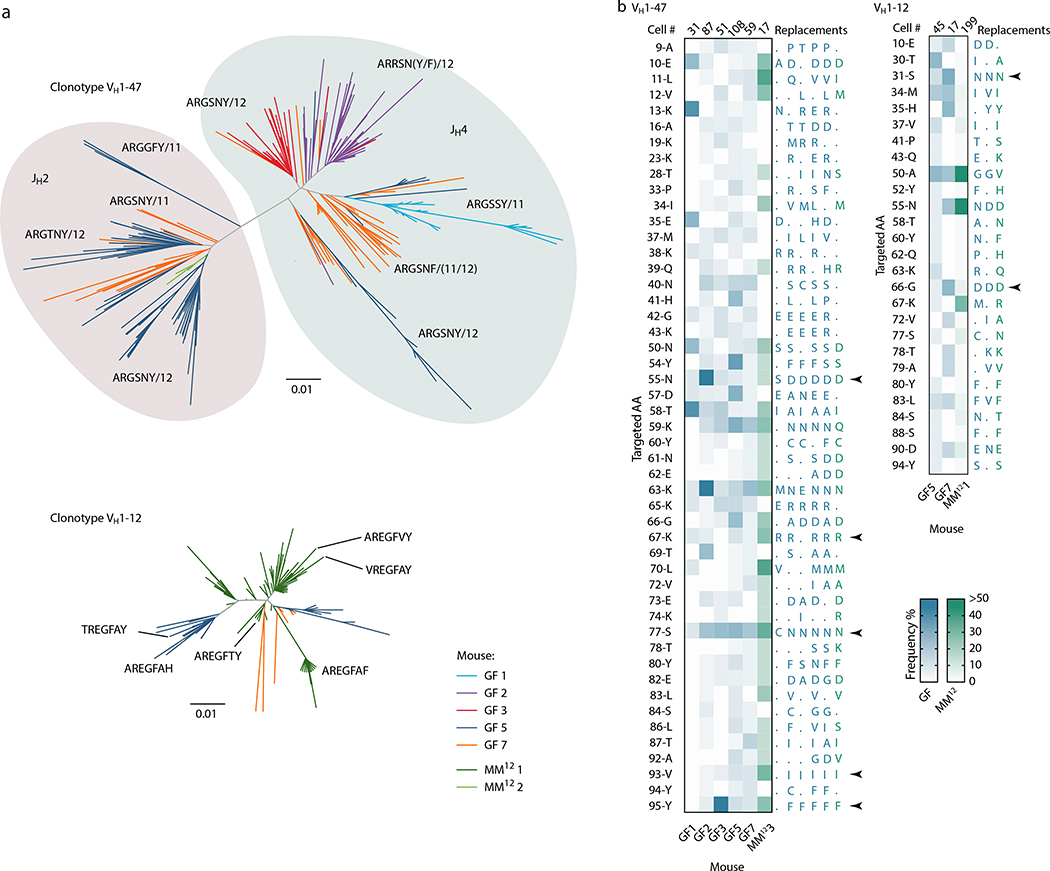
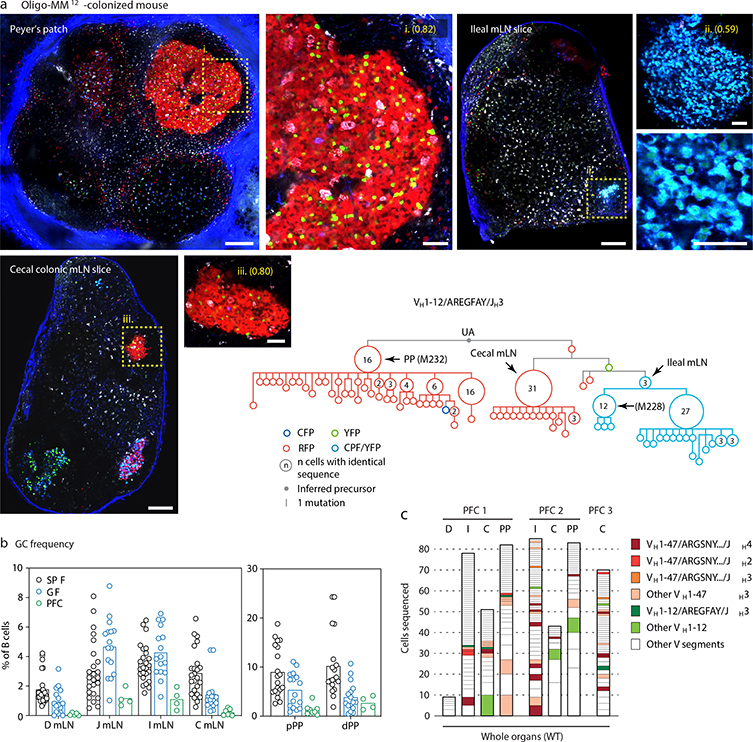
We subjected the 9 mAbs obtained from GF winner clones to an array of assays covering major potential sources of antigen, including food, autoantigens (anti-nuclear antibody and intestinal tissue antigens), fecal bacteria, and a standard polyreactivity panel. None of the GF mAbs reacted above background levels in any of these assays (Extended Data Fig. 6c–f). To determine whether GF GCs were indeed populated in a BCR-dependent manner or simply stochastically due to lack of antigenic stimulation, we searched for commonalities in the Igh sequences of winner clones, along with additional sequences obtained from single GC B cells from mLN vibratome slices and whole mLN and PP of wild-type GF mice. This revealed substantial overlap of clonotype “themes” across individuals, which we regarded as unlikely to be random given the small pool of GCs sampled. Two themes were particularly prevalent (Fig. 4a, b). One used the relatively rare VH1–47 segment, coupled to JH4 or JH2 via an 11–12 aa CDRH3 beginning with the consensus sequence ARGSNY (Fig. 4a). No commonalities in light chain usage were detected at this sampling depth. Allowing one aa substitution in the ARGSNY motif, this theme was present in 5 of 7 GF mice, accounting for 16.6% of all cells sequenced (Fig. 4b and Extended Data Fig. 7a). Clones with these characteristics represented only 0.00006% of all reads (or 1 in ~17,000) in a previously published database of naïve B cell Igh sequences from C57BL6 mice containing > 30 million reads representing 2.5 million unique rearrangements from five mice21 (p < 2.2 × 10⁻¹⁶ compared to GF gaGCs). A second public clonotype was encoded by the rare VH1–12 segment, with the stricter 7 aa consensus CDRH3 AREGFAY followed by JH3 (Fig. 4a). Again, no light chain usage patterns were identified. Allowing one aa substitution in CDRH3, this clonotype was present in 2 of 7 GF mice, representing ~3% of all cells sequenced. This clonotype was also heavily dominant in all 3 single-colored GCs sorted from different organs of one of three Oligo-MM12-colonized mice, accounting for 171 of 191 cells sequenced from this animal (Fig. 4b, Extended Data Fig. 8a). Despite its short length, the VH1–12/AREGFAY/JH3 combination was seen only 7 times (in 1 of 5 mice) in the > 30 million-read naïve B cell database21, and only 2 more times in one other mouse if a single aa substitution in the AREGFAY motif was allowed (p < 2.2 × 10⁻¹⁶ compared to GF gaGCs). Both clonotypes accumulated somatic mutations that converged across mice and between SPF and MM12 conditions (Extended Data Fig. 7b). In agreement with their failure to bind food protein extracts (VH1–47 and VH1–12 clonotypes are represented by mAbs G082/G226 and M228/M232, respectively, described in Fig. 3d–j and Extended Data Fig. 6), both clonotypes were also detected in mice fed a custom-made protein-free chow formulated from purified ingredients (Extended Data Fig. 8b–c; Table S2).
Fig. 4 |. Prominent public clonotypes in gaGCs of GF and Oligo-MM12-colonized mice.
(a) CDRH3 aa sequence logos for B cells bearing public VH1–47/JH4 or JH2 rearrangements of 11 or 12 aa length (left) or VH1–12/JH3, 7 aa length (right), sequenced from GF gaGCs. (b) frequency across mice/samples of B cells fitting public clonotype criteria or carrying other VH1–47 or VH1–12 rearrangements. Each bar represents one sample. Data are for 7 GF mice (GF1–7) and 3 Oligo-MM12-colonized mice (MM121–3). D, duodenal; I, ileal; C, cecal colonic mLN; P, Peyer’s patch. (c) Circos plots showing distribution of VH1–47 and VH1–12 public clonotypes in a second cohort of sex and age-matched SPF, GF, and Oligo-MM12-colonized mice. Each segment represents pooled mLN and PP GC B cells from one mouse, with clones ordered clockwise from largest to smallest. Only clones containing identical CDRH3s are linked (see Online Methods for full description). Gated as in Extended Data Fig. 9b; all samples were sequenced in a single experiment. (d) Circos plot as in (c) showing all public IgH clonotypes shared across mice housed under the indicated conditions. Lines connect clonotypes with the same VH/CDRH3/JH aa sequence. Left, all clones; right, only clones spanning ≥ 30 total wells. In (c, d), only clones found in at least 2 wells from the same mouse were linked.
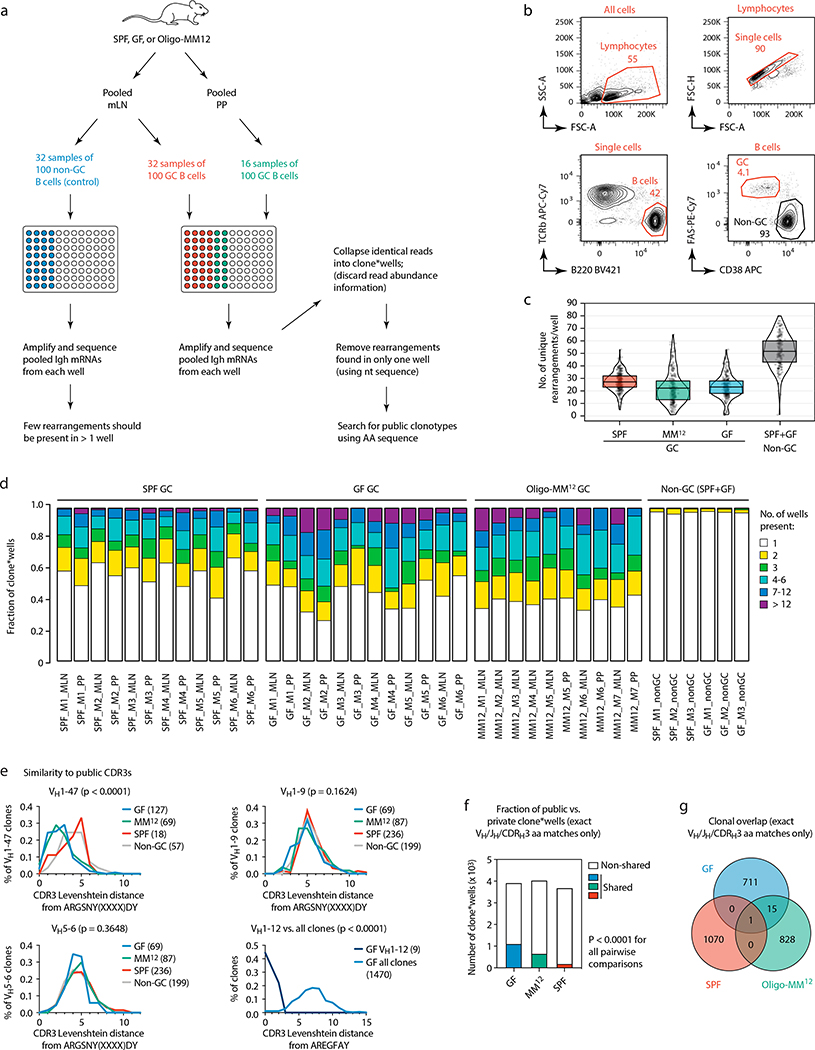
To assess whether reliance on public clonotypes is more broadly characteristic of GF gaGCs when sampled unbiasedly, we developed a multiwell incidence-based approach to measure clonal overlaps between mice with high confidence. In total, we sequenced ~80 thousand cells from mLN and PP gaGCs of 6 GF, 6 SPF, and 7 Oligo-MM12-colonized mice (Extended Data Fig. 9a–d). Confirming our initial findings, the VH1–47/ARGSNY theme (regardless of JH usage) was present in 6 of 6 GF and 5 of 7 Oligo-MM12-colonized mice, corresponding to 4.4% (173 of 3,929) and 2.4% (98 of 4,043) of clone*wells (a number obtained by multiplying each clone by the number of wells it was found in, see Extended Data Fig. 9a–c) in each condition, respectively (Fig. 4c). One such clone was also detected in a single SPF mouse (5 of 3629 clone*wells; Fig. 4c) and 3 others (one using the JH1 segment) were observed in our photoactivation data (see Fig. 1 and Supplementary Spreadsheet 1), indicating that full bacterial colonization is not sufficient to completely exclude such clonotypes from gaGCs. Clonotype VH1–12/AREGFAY was present, again at a lower frequency, in 5 of 6 GF mice (44 of 3,929 clone*wells; Fig. 4c). Analysis of Levenshtein distances showed that, in GF and Oligo-MM12-colonized but not SPF mice, CDRH3s of VH1–47 and VH1–12 clones were closer in sequence to the ARGSNY and AREGFAY motifs, respectively, than CDRH3s of clones using other V-segments (Extended Data Fig. 9e). Of note, both VH1–47/ARGSNY/JH4 and VH1–12/AREGFAY/JH3 rearrangements were found recurrently in PP of GF mice in independent work22 published while this study was under review, further underscoring the public nature of these two clonotypes. Finally, public clonotypes in general (defined as any recurrent VH/JH combination with exactly matching CDRH3 aa sequence) were markedly more frequent across GF and Oligo-MM12 gaGCs than across SPF mice (Fig. 4d, Extended Data Fig. 9f). While almost all GF-associated clonotypes were either eliminated or reduced to below detection levels by SPF colonization, the Oligo-MM12 gaGC repertoire overlapped more substantially with that of GF mice, indicating that Oligo-MM12 colonization is insufficient to completely replace the GF response (Fig. 4d, Extended Data Fig. 9g). Thus, rather than being stochastically populated, gaGCs display stringent selection driven by BCR specificity under conditions of low antigenic diversity, resulting in rapid focusing of GCs on dominant lineages and pronounced reliance on clonotypes found repeatedly across different mice.
We show that gut-associated GCs undergo clonal selection and affinity maturation in the absence of infection or immunization, and that the rate of GC selection varies markedly depending on the presence and complexity of the gut microbiota. Under microbial-replete conditions, selection of highly dominant clones is relatively rare and is associated with improved affinity for commensal-derived antigens. At the other extreme, gaGC selection accelerates precipitously in the absence of microbes, leading to strong convergent selection of IgH clonotypes across mice. Thus, clonal selection in steady-state gaGCs is a tunable process (see supplementary text for further discussion). The ability to generate specific, affinity matured responses to commensals would allow targeted control of individual bacterial species and may thus play a role in maintaining the composition of the gut microbiota.
Methods
Mice and treatments
Mice were housed at 72°F, 30–70% humidity in a 12 h light-dark cycle with ad libitum access to food and water. Male and female mice aged 8–12 weeks at the start of the experiment were used. PAGFP-tg mice were generated in our laboratory12. Rosa26Confetti (B6.129P2-Gt(ROSA)26Sortm1(CAG-Brainbow2.1)Cle/J) and Rosa26Stop-tdTomato (B6.Cg-Gt(ROSA)26Sortm14(CAG-tdTomato)Hze/J)23 were obtained from Jackson Laboratories. Rosa26Confetti were backcrossed to C57BL/6 for several generations in our laboratory and restricted to the Ighb/b haplotype. AicdaCreERT2 (Aicdatm1.1(cre/ERT2)Crey) mice24 were a kind gift from Claude-Agnès Reynaud and Jean-Claude Weill (Institut Necker). S1pr2CreERT2 (Tg(S1pr2-cre/ERT2)#Kuro) BAC-transgenic mice14 were a kind gift from T. Okada (RIKEN Yokohama) and T. Kurosaki (U. Osaka). Mice were bred and maintained either in specific pathogen-free (SPF) facilities or in GF isolators at the Rockefeller University animal facility. The Oligo-MM12 consortium was a kind gift from K. McCoy (U. Calgary). We colonized GF AID-confetti breeders with a single gavage of Oligo-MM12 and monitored colonization (including presence of the entire consortium in successive generations) by specific amplification of individual bacterial members by qPCR, see below. Mice were bred and maintained in isolators. Vertically-colonized AID-confetti Oligo-MM12 mice were used for all experiments. To deplete protein antigen from the diet, we used a custom solid diet containing free amino acids (Modified TestDiet 9GCV w/5% Cellulose, composition details in Table S1). Diets were irradiated at > 45 kGy to ensure sterility for GF conditions and were provided to mice from 1 week of age until the time of analysis.
Recombination of floxed alleles in both AID-Confetti and S1PR2-tomato mice was induced by two gavages of 10 mg of tamoxifen (Sigma, Cat# T5648) dissolved in corn oil at 50 mg/ml, 2 days apart. To ensure selection was not a function of route of administration of either tamoxifen or corn oil, two AID-Confetti mice were also injected intra-peritoneally once with 10 mg tamoxifen for analysis at the SPF 21–23 day timepoint. In GF AID-confetti animals, tamoxifen was prepared and administered under sterile conditions to mice housed in individually ventilated isocages (TecniPlast).
Sample sizes were not calculated a priori. Given the nature of the comparisons (mice born under different microbial colonization status), mice were not randomized into each experimental group and investigators were not blinded to group allocation.
All animal procedures were approved by the Institutional Animal Care and Use Committee of the Rockefeller University.
Oligo-MM12 quantitative PCR
Colonization of mice by the Oligo-MM12 consortium was confirmed and monitored over generations using quantitative PCR with primer pairs specific to each species as previously validated (individual strain primer sequences available in Supplementary Table S5, adapted from19, universal bacterial qPCR primers as follows: UNIF340-ACTCCTACGGGAGGCAGCAGT and UNIR44R-ATTACCGCGGCTGCTGGC). DNA was extracted from fecal samples using the ZR Fecal DNA kit (Zymo Research) according to manufacturer’s instructions. Quantitative PCR was performed with the Power SYBR Green Master Mix (Applied Biosystems). The average Ct-value of two technical replicates was used to quantify the relative abundance of each species’ 16S rRNA using the ΔΔCt method with the universal 16S rRNA primers serving as the control between samples. Relative abundance was corrected according to the genome copy number of 16S rRNA for each species.
Multiphoton imaging and photoactivation
mLNs and PPs were harvested and imaged as described previously11. Briefly, adipose tissue and excess epithelium were removed under a dissecting microscope, and mLNs and PPs were mounted in phosphate-buffered saline between two coverslips held together with vacuum grease, as described25. Mounted mLNs and PPs were imaged on an Olympus FV1000 upright microscope with a 25X 1.05NA Plan water-immersion objective and a Mai-Tai DeepSee Ti-Sapphire laser (Spectraphysics). Confetti alleles were imaged at λ = 930 nm excitation. Fluorescence emission was collected in three channels, using a pair of CFP (480/40 nm) and YFP (525/50 nm) filters, separated by a 505 nm dichroic mirror to detect CFP, GFP and YFP and a dedicated RFP filter (605/70 nm). In situ photoactivation was performed as described12,26. PAGFP-transgenic mice were injected intravenously with 5 μg of a non-blocking antibody to CD35 (clone 8C12, produced in house) conjugated to Cy3 to label follicular dendritic cell networks. Clusters of CD35+ cells were identified by imaging at λ = 950 nm, where photoactivation does not take place, and 3D regions of interest were photoactivated by higher-power scanning at λ = 830 nm. Lymph node fragments were then processed for flow cytometry as described below.
Image analysis
Color dominance in AID-Confetti GCs was determined in 3D datasets reconstructed using ImageJ software and the Bio-formats plugin. Cells of each color or color combination were counted manually in 2 or more 2D slices, at least 20 μm apart using the Cell Counter plugin. For PP overviews, colors were counted in the same way, but from a single imaging plane. The normalized dominance score (NDS) was calculated as previously11. In brief, we first estimated the fraction of recombined cells in each GC by calculating the density of fluorescent cells per area unit (100 μm2) in anatomically defined DZ areas in which cell distribution was homogeneous, then multiplied the density by the fraction of colored cells accounted for by the dominant color in the GC. Fully recombined GCs have a cell density very close to 1 11, making an NDS of 1 a good approximation of 100% GC occupancy by the dominant color. GC size in mLN and PP was calculated as the cross-sectional area of the largest available Z-section. All image analysis was carried out in ImageJ.
Lymphocyte flow cytometry and sorting
To evaluate GC dynamics and isotype distribution across space and time, individual mLNs were isolated draining the duodenum, jejunum, ileum or cecum/colon as described previously 20. Pairs of PPs were isolated from the most proximal part of the duodenum or the most distal part of the ileum. Cells were isolated by maceration with disposable micropestles (Axygen) in 100 μl of PBS supplemented with 0.5% BSA and 1mM EDTA (PBE), and single cell suspensions obtained by two passes through a 70 μm mesh. Cells were stained with antibodies against B220, TCR α/β (or a “dump” mixture containing antibodies against CD4, CD3, CD8 and NK1.1), CD38, Fas, IgM, IgG1, IgG2b and IgA supplemented with Fc block (see Table S3) for 30 minutes on ice. Samples were run on a FACS LSRII or FACS Symphony (BD).
To sort B cells from single mLN GCs, we first determined the localization of single-colored GCs as detailed in Multiphoton Imaging, above. As previously described11, we embedded selected mLNs in 4% low-melt NuSieve GTG agarose in PBS heated to boiling then cooled to 37 oC prior to embedding. We then cut LN into 300 μm slices using a Leica VT1000A vibratome. Slices were then further dissected under a Leica M165FC fluorescence stereomicroscope using a double-edged razor blade to isolate single GCs from slices in which multiple GCs were present. Slice fragments were placed in microcentrifuge tubes containing 100 μl of PBE, macerated using disposable micropestles and dissociated into single-cell suspensions by gentle vortexing. 100 μl of 2X antibody stain (antibodies against CD38, FAS, B220, TCRαβ supplemented with Fc block, see Table S3) was added to the cell suspension, which was incubated on ice for 30 min. Single cells were sorted as described below using FACS Aria II or III cell sorters. Cells positive for any fluorescent Confetti color detected as described11 were index-sorted into 96-well plates containing 5 μl TCL Buffer (Qiagen) supplemented with 1% β-mercaptoethanol11,27. Precise assignment of colors from index-sorted cells was done post-acquisition using Diva software, v. 8.0.2, using all four channels.
For the isolation of single follicles from non-fluorescent GF mice, mice were injected with anti-CD35 (8C12) Alexa Fluor 594, individually dissected, imaged, and sliced as described above. 250 μm slices were examined under a stereomicroscope and manually microdissected into slice fragments comprising roughly one follicle as per follicular dendritic cell staining. Two slice fragments were prepared per mLN, isolated from slices at least 1,000 μm (four 250 μm slices) apart in the intact node. Slice fragments were prepared for single cell sorting as above. For the isolation of single GCs from fluorescent GF mice, we combined Confetti fate-mapping with anti-CD35 follicle staining. GF AID-Confetti mice were treated with tamoxifen as described and, 24 hours before imaging, were injected with 5 μg anti-CD35-Cy3. mLNs were sliced and imaged, and fluorescent clusters were manually excised avoiding any other follicles (marked with anti-CD35). In this case, both fluorescent and non-fluorescent GC B cells were single-sorted for sequencing.
For single-cell sequencing from whole mLNs and PPs, organs from non-fluorescent GF mice were isolated and processed into single-cell suspensions by maceration with disposable micropestles. After straining through a 70 μm mesh, cells were stained and sorted as above. For incidence-based sequencing experiments, mLN or PP samples were stained as above and sorted at 100 cells per well into 16–32 individual wells in a 96 well plate containing 10 μl TCL Buffer (Qiagen) supplemented with 1% β-mercaptoethanol. Analysis of flow cytometry experiments data was performed on FlowJo software, v. 10.5.3 (Tree Star Inc.).
Immunoglobulin sequencing
RNA from single cells or 100-cell pools was reverse-transcribed using oligo-dT as in11,16. PCR primers were used as described previously11,28 with the addition of IgA-specific amplification primers Cα outer (ATCAGGCAGCCGATTATCAC) and Cα inner (GAGCTCGTGGGAGTGTCAGTG)16. Pooled PCR products were then purified using SPRI beads (0.7x volume ratio), gel purified and sequenced with a 500-cycle Reagent Nano kit v2 for single cell libraries and with a 600-cycle Reagent kit v3 for 100-cell pool libraries on the Illumina Miseq platform.
Sequence analysis
For single-cell Igh analyses, raw paired-end sequences were merged at the overlapping regions using PANDAseq (v2.11) for full amplicon reconstruction29, then processed with the FASTX toolkit. Only sequences with high counts for each single cell/well were analyzed. For V-(D)-J gene rearrangement annotation, Ig sequences obtained were submitted to both HighV-QUEST (v1.6.9)30 and Vbase231 databases, choosing the assignment yielding the lowest number of somatic mutations in case of discrepancy. Sequences with common VH/JH genes and same CDRH3 length were grouped into clonal lineages when CDRH3 nucleotide identity was ≥ 75%. Igk sequences were determined using the same method, as needed for mAb cloning purposes. Clonal lineage trees were plotted using GCtree32, with the unmutated V gene sequence of the V(D)J rearrangement used as an outgroup. Logo plots for public clonotypes were created by first using the T-Coffee algorithm33 to align all CDRH3 sequences bearing VH1–47 and JH2 or JH4 connected by a 11 or 12 aa-long CDRH3 or VH1–12 and JH3 connected by a 7 aa-long CDRH3. The results of this alignment and subsequently processed using the WebLogo3 web server34. Public clones were searched in the Greiff et al.21 database using R. Matching required exact VH, JH, and CDRH3 length matches and up to 1 amino acid mismatch in the “ARGSNY” or “AREGFAY” motifs. Dendrograms were generated using ClustalX (v. 2.1) and FigTree (v. 1.4.4) and branches were colored in Adobe Illustrator according to the sequence annotations.
For incidence-based sequencing, raw paired-end sequences were merged as above and submitted to HighV-QUEST (v. 1.6.9) for annotation30. The output database was then processed in the R environment to remove non-functional and out-of-frame sequences. Any sequences with < 6 reads were discarded. Expanded clonal populations were defined using Change-O35. Briefly, sequences within the same mouse that shared VH and JH genes and with a maximum CDRH3 hamming distance of 4 nucleotides were grouped into a single clone*well of size equivalent to the number of wells this sequence was found in and retaining the full list of CDRH3 sequences in the cluster (generating a CDR3list for that clone*well). To remove the possibility of errors due to sequence misassignment and inter-well contamination, sequences found in a single well within their mouse of origin were eliminated. CDRH3s were translated to amino acid sequences and non-CDRH3 sequences were discarded prior to assignment of public clones. Our definition of a public clone required that clones have the same VH and JH segments, and an exact match between any of the CDRH3s in the clone*wells’ CDR3lists. Public clonotypes VH1–47/ARGSNY and VH1–12/AREGFAY were identified in this database using the same criteria as above but without restriction of JH segment usage. Circular ideogram plots were created using Circos (v. 0.69–9), with each individual mouse represented by a single ideogram bar36. The full analysis pipeline is available at https://github.com/victoraLab/MIBS. Levenshtein distances were calculated in R using the stringdist package. Wells assigned to the same clone within the same mouse were counted only once to avoid overrepresentation due to clonal expansion. All sequences with ≥ 15 reads were used in this analysis, regardless of the number of wells in which a clone was present. For the VH1–47/ARGSNY clonotype, distances were calculated starting from the string “ARGSNYXXXXDY’ and plotted as the resulting difference −4 to correct for the 4 “X” characters.
Monoclonal antibody production
Heavy and light chain sequences obtained from the same expanded nodes in GC B cell SHM phylogenies, as well as their deduced unmutated ancestors, were produced and assembled into custom mammalian expression vectors (modified from16) encoding the human IgG1 and IgK constant regions by Twist Biosciences. Plasmids were transfected into Freestyle 293-F suspension cells (obtained from Life Technologies and tested for mycoplasma contamination in our laboratory), and mAbs were purified using protein-G affinity chromatography, as described11,37. Integrity of all mAbs was assayed/quantified by SDS-PAGE and bio-layer interferometry on an Octet Red96 instrument using protein G-coated sensors (FortéBio).
Monoclonal antibody binding assays
Bacterial flow cytometry was carried out using protocols adapted from38 and4. Freshly collected feces from SPF or Oligo-MM12 mice from our own facility were macerated with micropestles in 100 μl of ice-cold PBS per 10 mg of feces and vortexed for 5 minutes. Large debris were removed by spinning at 400 xg for 5 minutes at 4°C. Supernatant containing bacteria was removed and pelleted by centrifugation at 8000 xg before staining with SYTO BC bacterial DNA stain (Thermo Fisher, 1:5000). For staining of cultured bacteria, overnight cultures were pelleted at 8000 xg and resuspended in SYTO BC at approximately 109 CFU/ml (a density similar to that of fecal bacteria). Stained bacteria were incubated with monoclonal antibodies at 10 μg/ml for feces or 1 μg/ml for cultures in PBS supplemented with 0.25% BSA for 1 hour on ice before washing and incubating with Alexa Fluor 647-conjugated goat anti-human IgG1 secondary antibody (Thermo Fisher, Cat#A-21445, 1:2000) with 5% v/v normal goat serum in PBS 0.25% BSA for 30 minutes. Bacteria were washed in PBS 0.25% BSA for 15 minutes and 0.25 μg/ml DAPI was added immediately prior to sample acquisition. Samples were run on a FACS Symphony (BD) with forward scatter and side scatter set to logarithmic mode. Within each experiment, the same number of events was acquired for all samples. Binding was evaluated in SYTO BC+ DAPI– live bacteria. Data was analyzed using FlowJo software v. 8.7 or 10.5.3 (Tree Star Inc.).
Fecal bacterial ELISAs were performed with bacteria isolated from freshly collected feces from either Oligo-MM12 or SPF mice. To regulate the bacterial diversity sampled in SPF mice, feces from multiple cages of C57BL/6 mice were pooled and prepared as a single sample. Feces were macerated with disposable micropestles and centrifuged as described for bacterial flow cytometry. Bacteria were fixed in 0.5% paraformaldehyde for 20 minutes with continual rotation to avoid clumping then washed three times in PBS. Poly-L-lysine coated high-binding ELISA plates were incubated overnight with bacterial preparations at concentrations of OD600 of 0.2 for Oligo-MM12 or OD600 of 0.35 for SPF. Plates were blocked with PBS 1% BSA for 2 hours, washed with PBS 0.05% Tween and incubated for 1 hour with serial dilutions of monoclonal antibodies starting at a concentration of 900 nM. Plates were washed and incubated with an HRP-conjugated goat anti-human IgG (Fcɣ-specific) secondary antibody (Jackson Immuno Research, 109–035-098) at 1 μg/ml for 1 hour. Assays were developed using chromogenic substrate (Sigma) according to the manufacturer’s instructions. Absorbance was read at 450 nm using an AccuScan plate reader (Fisher Scientific).
Polyreactivity ELISAs were carried out as previously described39, with the following modifications. Briefly, high-binding ELISA plates (Costar) were coated with ssDNA, dsDNA, LPS and KLH at 10 μg/ml and insulin at 5 μg/ml in PBS overnight at 4 °C. Plates were washed with PBS 0.05% Tween (PBST) and incubated in PBST for 1 hour at room temperature. Plates were incubated with serial dilutions of monoclonal antibodies in PBST for 2 hours at room temperature starting at a concentration of 10 μg/ml. Plates were incubated with HRP-conjugated secondary antibodies, developed and absorbances read as described above. Self-reactivity was tested using the QUANTA Lite ANA ELISA kit (Inova Diagnostics) following the manufacturer’s instructions.
For testing reactivity to food proteins, crude protein extracts were prepared by grinding 10 g of germ-free autoclaved chow to a powder in a pestle and mortar and shaking at 120 rpm overnight in 40 ml PBS at 37 oC. Extracts were clarified by spinning at 4,000 xg for 10 minutes and then 21,130 xg for 1 h at 4 oC before filtering through a 0.22 μm filter. Final protein concentration was determined by BCA assay (Pierce). ELISA plates were coated overnight with 100 μg/ml of food extract, blocked with PBS 2% BSA and incubated with serial dilutions of mAb in PBS 2% BSA starting at 10 μg/ml for 2 hours. Assays were incubated with HRP-conjugated secondary antibodies, developed and absorbances read as described above.
For bacterial lysate dot blots, overnight cultures of bacteria were centrifuged at 8000 xg for 8 minutes to pellet bacteria and washed once with BHI media, then resuspended at a 10X concentration in BHI. These concentrates were normalized to an OD600 of 4.0, then mixed 1:1 with Laemmli sample buffer and boiled for 10 minutes to lyse cells. 2 μl of prepared bacterial lysates were spotted on nitrocellulose and dried at room temperature overnight. Blots were blocked in PBST (1X PBS and 0.1% Tween) with 1% BSA for 2 hours, washed briefly with PBST, then stained with 4 μg/ml primary antibody (monoclonal human IgG1s) in PBST with 1% BSA for 2 hours. Blots were washed for 5 minutes in PBST three times, stained with 1:1000 peroxidase-conjugated goat anti-human IgG (Jackson ImmunoResearch 109–035-098) in PBST with 1% BSA for one hour, then washed for 5 minutes in PBST three times. Blots were dabbed dry and then incubated for 5 minutes with the Clarity ECL substrate (Bio-Rad) and chemiluminescence images were acquired with an ImageQuant LAS4000 (GE) using the same exposure time for all blots.
Self-Reactivity was assessed in western blots probing whole tissue lysates. The small intestine was dissected from wild-type SPF mice and a 1 cm segment of the distal ileum was removed, cut open longitudinally, and washed thoroughly with PBS to remove lumenal content. The tissue was snap-frozen and then beadbeat directly in Laemmli buffer to pulverize the tissue, lyse the cells, and reduce/denature proteins in one step. Samples were boiled for 10 minutes and then centrifuged at 16,000 g for 5 minutes. Supernatants were run on 4–20% Tris-Glycine gels with SDS, and transferred onto PVDF membranes. Blots were blocked and stained using the procedure described above for dot blots.
Bacterial culture
A list of bacterial strains is provided in Table S4. Bacteria were grown in an anaerobic atmosphere of 10% carbon dioxide, 5% hydrogen, and 85% nitrogen. Members of the Oligo-MM12 consortium were cultured in BHI (Becton Dickinson) supplemented with 5 μg/ml hemin (Sigma), 5 μg/ml vitamin K1 (Sigma), 250 mg/L cysteine, 250 mg/L sodium sulfide, and 4 g/L porcine mucin type 3 (Sigma) (only for Akkermansia muciniphila YL44), with the exception of Lactobacillus reuteri I49, which was grown in MRS (Becton Dickinson).
Statistical analysis
Unless otherwise noted, statistical calculations were performed using the tests described in the figure legends in GraphPad Prism v. 8.3.0. The Chao1 formula40 was used to estimate total clonal richness in photoactivated GCs, calculated using the EstimateS package41. Proportions of clones bearing public clonotype motifs in our sample vs. the Greiff et al.21 database were compared using Fisher’s exact test calculated in the R environment. For the ARGSNYXXXXDY CDRH3, Levenshtein distances were compared between conditions; for the AREFGAY CDRH3, distances were compared between VH1–12 and all clones using the Mann-Whitney test. Exact binomial confidence intervals were calculated using the JavaStat online tool at https://statpages.info/confint.html.
Extended Data
Extended Data Figure 1. Clonal replacement in steady-state gaGCs.
(a) Gating strategy for PA-GFP mice used in Fig. 1a–d. (b) Gating strategy and efficiency of labeling in GCs of AID-Confetti mice 7 days post administration of tamoxifen as in Fig. 1e. Labeling efficiency is calculated as 100% minus the product of unlabeled cells in the GFP/YFP, RFP, and CFP channels. (c) Gating strategy for S1pr2CreERT2/tdTomato fate-mapping experiments shown in (g) and Fig. 1h. All flow plots are representative of multiple experiments. (d) Multiphoton images of PP of SPF mice at different times after tamoxifen treatment, details as in Fig. 1f. (e) Quantification of multiple images as in (d), details as in Fig. 1g. Data are from 3–5 mice per timepoint at D14–35 and 1–2 mice for D7 and later timepoints. (f) GC size in PPs vs. mLNs, calculated from samples obtained 7 days after tamoxifen treatment as in (d) and Fig. 1f. Size is plotted as the cross-sectional area of the largest available Z-section. Each symbol represents one GC. Lines are median, P-values are for two-tailed Mann-Whitney U test. Data are pooled from multiple mLNs and PPs of 2 mice from 2 independent experiments. (g) Turnover of B cell clones in PP GCs from S1pr2CreERT2 x Rosa26Stop-tdTomato mice, details as in Fig. 1h.
Extended Data Figure 2. Binding characteristics of ‘winner’ gaGC clones from SPF mice.
(a) Gating strategy for AID-Confetti single GCs shown in (b,c), Figs. 2a and 3d–e, and Extended Data Fig. 6a–b and 8a. (b,c) Additional Igh sequence relationships among B cells from high-NDS GCs (b) and one low-NDS GC (c). Details as in Fig. 2a. Scalebars, 50 μm. In (c), each tree is a separate clone (defined as a unique V(D)J rearrangement). Only clones with > 5 cells are shown (grey slices). (d) Gating strategy for bacterial flow cytometry, performed in (e), Figs. 2b and 3f, h–i, and Extended Data Fig. 6d. (e) Binding of recombinant mAbs to fecal bacteria isolated from SPF mice by flow cytometry. Plots gated as in (d). All plots are representative of data repeated in at least two separate experiments. (f) Reactivity summary of SPF mAbs assayed by ELISA against food protein extracts, autoantigens (anti-nuclear antibody, ANA), and a 5-antigen polyreactivity panel. Shown are background-subtracted OD 450nm values. Data representative of assays repeated in at least 3 separate experiments.
Extended Data Figure 3. Stable vertical transmission of the Oligo-MM12 consortium.
(a) Total and (b,c) strain-specific 16S DNA quantitative PCR and of fecal samples of mice stably colonized with the Oligo-MM12 consortium. In (a) ΔCT was calculated in respect to a reference SPF sample, marked by the black filled symbol, to which all other values were compared. In (c), Ct-values were used to quantify the relative abundance of each species (see Methods). LOD, limit of detection. P, parental strain (colonized by gavage). F1, first generation after P. Note that Bifidobacterium animalis (YL2) is usually undetectable in feces, as previously described19.
Extended Data Figure 4. Frequency and isotype distribution of gaGCs in GF and Oligo-MM12-colonized mice.
(a) Gating strategy for GC frequency and isotype distribution shown in b-d. (b) Frequency of cells with GC phenotype (CD38–FAShi) among total B220+ B cells in the indicated organs of mice raised under the indicated conditions. Each symbol represents one mouse. SPF, n = 25; GF, n = 16; Oligo-MM12, n=11. (c) Frequency GC B cells positive for the indicated surface BCR isotype in different organs of mice raised under the indicated conditions. Data are from at least 3 mice per group, as in (d). Data are presented as mean +/− SEM. (d) Statistical analysis of selected isotypes and anatomical locations, using data from (c). Each symbol represents one mouse. Lines indicate median; P-values are for two-tailed Kruskall-Wallis test done on each trio, with Dunn’s multiple comparisons post-test. All P-values below 0.05 are reported.
Extended Data Figure 5. Clonal selection in GF and Oligo-MM12-colonized mice.
(a) Gating strategy for GF AID-Confetti single GCs used in (b-d). (b-d) Sequencing of Igh genes of B cells obtained from individual mLN GCs. GC B cells were single-sorted from fragments of vibratome slices containing a single GC. To avoid biased selection of GCs based on NDS or loss of GCs with low colored cell density, mLN were harvested at 5–7 days post-tamoxifen, prior to extensive selection or clonal turnover, and both fluorescent and non-fluorescent cells were included in the sample. This unbiased selection ensures that data are comparable to those obtained using in situ photoactivation (Fig. 1a–d), which we could not perform because the photoactivatable GFP-transgenic strain is not available under GF status. (b) Clonal composition of individual GCs from five mice (GF1–5). J, jejunal; C, cecal-colonic mLN. (c) Quantification of data in (b). Each symbol represents one GC. (d) Proportion of GCs in which the largest clone accounts for > 50% of all B cells in mLN of SPF (data from Fig. 1b) and GF mice (b). P-value is for two-tailed Fisher’s exact test. Center bars represent the proportion in the sample, error bars are the exact binomial 95% confidence interval. (e) Multiphoton images of Oligo-MM12 mLN and PP at different times after tamoxifen. Blue is collagen (2nd harmonics), white is autofluorescence, other colors are from the Confetti allele. Scalebars, 200 μm (overviews), 50 μm (close-ups). N/D, NDS not determined due to low colored cell density. (f) Quantification of images as in (e) for mLN (top) and PP (bottom). Each symbol represents one GC. Median indicated. Only GCs with density > 0.4 fluorescent cells/100 μm2 are included in NDS calculation. (g) Proportion of GCs with NDS > 0.75 in mLNs (top) and > 0.5 in PPs (bottom) under SPF, GF, and Oligo-MM12 conditions at 20–23 days post-tamoxifen, SPF and GF data as in Fig. 3c. For SPF, Oligo-MM12 and GF mLN gaGCs, n = 57, 16, and 27, respectively. For PP gaGCs n=21, 10, and 9, respectively. P-value is for two-tailed Fisher’s exact test. Error bars represent the exact binomial 95% confidence interval. All data are from 3–5 mice per timepoint.
Extended Data Figure 6. Characteristics of ‘winner’ gaGC clones from GF and Oligo-MM12-colonized mice.
(a,b). Additional Igh sequence relationships among B cells from high-NDS GCs from GF (a) and Oligo-MM12-colonized (b) mice. Details as in Fig. 2a. Scalebars, 50 μm. (c) Reactivity summary of GF mAbs assayed by ELISA against food protein extracts, autoantigens (anti-nuclear antibody, ANA), and a 5-antigen polyreactivity panel. Shown are background subtracted OD 450nm values. (d) Flow cytometry of GF mAbs binding to fecal bacteria from SPF mice. Details as in Fig. 2b. (e) ELISA for GF mAbs binding to SPF fecal bacterial fractions. MG053 was assayed at 3 dilutions only. mAbs were assayed at the dilution indicated in the X-axis. Lines are mean of two assays. (f) Western blot (WB) for GF mAbs binding to a protein extract from mouse ileum tissue, run on a single-well 4–15% gel and blotted using a multi-well mask. mAb 3H9 is a DNA-specific negative control. Data in (c-f) are representative of two or more independent experiments.
Extended Data Figure 7. Mutational patterns in GF/Oligo-MM12 public clonotypes.
(a) Dendrograms showing the sequence relationships between VH1–47 and VH1–12 clones in different mice. All clones with up to 2 aa differences from the public clonotype CDRH3 motifs are included. (b) Heatmaps depict the frequency of aa replacements along the VH1–47 and VHH1–12 families in GF (blue) and Oligo-MM12 (green) mice, using the same data as plotted in Fig. 4b. Only mice with > 2 cells within the specified clone were included in the analysis. Number of cells analyzed per mouse is indicated at the top of each column. Only aa mutated in at least 3 (VH1–47) or 2 (VH1–12) mice are listed on the left, using IMGT numbering; to the right, the most frequent aa replacement in each mouse is given. Arrows indicate recurrent aa mutations found in 5/6 mice (VH1–47) or 3/3 mice (VH1–12).
Extended Data Figure 8. Stereotypical GF IgH clonotypes are present in Oligo-MM12 and GF/dietary protein-free conditions.
(a) Massive expansion of a public VH1–12 clonotype across different secondary lymphoid organs of mouse MM12 1 (from Fig. 4b), at 21 days post-tamoxifen. Multiphoton images show all three GCs sequenced from this mouse (yellow dotted boxes), magnified in the side panels. Scalebars, 200 μm (overviews) and 50 μm (close-ups). mLN close-ups are from different image acquisitions of the same GC. A clonal tree of all cells in this clone is shown in the bottom-right. Arrowheads indicate clonal bursts and the organ of origin of cells with that particular sequence. (b) Frequency of cells with GC phenotype (CD38dimFAShi) among total B220+ B cells in the indicated organs of mice raised on protein-free chow (PFC). Data for SPF and GF mice are reproduced from Extended Data Fig. 4b. Each symbol represents one mouse. PFC n = 8 mice. (c) Clonal distribution of GC B cells sequenced from the indicated tissues of three separate mice (PFC1–3), with public clonotypes color-coded. See also Fig. 4b. D, duodenal mLN; I, ileal mLN; C, cecal colonic mLN; PP, Peyer’s patch.
Extended Data Figure 9. Multiwell incidence-based Igh sequencing reveals clonal overlap among individual mice and between microbial colonization conditions.
(a) Schematic overview of the incidence-based Igh sequencing method used for (c-g) and Fig. 4c, d. To identify expanded public clonotypes among gaGC samples from multiple mice with high confidence, we developed an incidence-based sequencing strategy based on repeated sampling of the same GC B cell population. We sorted multiple samples of 100 GC B cells (usually 32 for mLN and 16 for PP) from 6 GF, 6 SPF, and 7 Oligo-MM12-colonized mice, and sequenced all BCRs in each sample, for a total of ~80 thousand input B cells, plus 32 wells each of non-GC B cells from the mLN of 3 GF and 3 SPF mice as controls. To avoid counting as “public” sequences that were spuriously present in different mice due to barcode misassignment or DNA contamination, we only included in our analysis clones that were represented by > 5 reads in any single well and found in at least 2 wells from the same sample. Key bioinformatics steps are described in the figure; see the Methods section for a full description of the bioinformatic pipeline. (b) Gating strategy used for data in (c-g) and Fig. 4c–d, described in (a). (c) Number of distinct clones per well, after collapsing sequences with matching VH, JH, and CDRH3 nt sequence. Each symbol represents one well. Boxes represent median and interquartile range. As expected, non-GC B cell samples had many more total clones per well than GC B cells. (d) Proportion of expanded clones (present in > 1 well per sample) in GC and non-GC samples from mLN and PP of mice held under the specified conditions. (e) Histograms of Levenshtein distance between the indicated consensus CDRH3 and the CDRH3 of all clones in the indicated category. For ARGSNYXXXXDY, distances are plotted for clones carrying the “correct” VH1–47 gene or two “control” VH regions with similar usage frequency in our sample. P-values, Kruskall-Wallis test comparing all three conditions. Due to the very low number of total VH1–12 clones outside the GF condition, distances to the AREGFAY CDRH3 are compared between VH1–12 clones and all clones. P-value, two-tailed Mann-Whitney test. (f) Fraction of clone*wells containing public clonotypes in each condition, pooled from all mice. P-values are for Fisher’s Exact test. (g) Venn diagram showing number of clones per condition (pooled from all mice) and overlap between conditions. The clone in the center of the graph (SPF/Oligo-MM12/GF overlap) corresponds to the VH1–47 public clonotype. In (f, g) data as in Fig. 4d.
Supplementary Material
Acknowledgements
We thank all Victora and Mucida Lab members past and present for assistance in experiments, fruitful discussions and critical reading of the manuscript. In particular we thank; A. Rogoz and G. Fayzikhodjaeva for the maintenance of gnotobiotic mice; S. Gonzalez for maintenance of SPF mice; and K. Gordon and K. Chhosphel for FACS sorting; the Rockefeller University Genomics Center for RNA sequencing; Rockefeller University employees for continuous assistance. We thank A. Vale (UFRJ, Brazil) for help with public clonotype analysis, K. McCoy (U. Calgary, Canada), S.Y. Wong and K. Cadwell (NYU) for providing the Oligo-MM12 strains, J. Faith (Mount Sinai School of Medicine, USA) for other bacterial strains, and J Däbritz and E. Wirthgen (U. Rostock, Germany) for their contribution in the training and supervision of C. W. This work was supported by NIH/NIAID grants R01AI119006 and R01AI139117 (G.D.V.), and NIH/NIAID/NIDDK grants R01DK093674, R01DK113375 and R21AI144827 (D.M.) with additional support from NIH grant DP1AI144248 (Pioneer award), to G.D.V. and NIH grant R01DK116646 (Transformative award), to D.M. C.R.N. is a Human Frontier of Science Program postdoctoral fellow. G.P.D. is a Robert Black Fellow of the Damon Runyon Cancer Research Foundation. A.S. is a Boehringer-Ingelheim Fonds PhD fellow. G.D.V. and D. M. are Burroughs-Wellcome Investigators in the Pathogenesis of Infectious Disease. G.D.V. is a Searle Scholar, a Pew-Stewart Scholar, and a MacArthur Fellow.
Footnotes
Competing interests
The authors declare no competing financial interests.
Data and Code Availability Statement
Incidence-based sequencing raw and processed data is available thought the BioProject ID PRJNA647715; the analysis pipeline is available at https://github.com/victoraLab/MIBS.
References
- 1.Bergqvist P et al. Re-utilization of germinal centers in multiple Peyer’s patches results in highly synchronized, oligoclonal, and affinity-matured gut IgA responses. Mucosal immunology 6, 122–135, doi: 10.1038/mi.2012.56 (2013). [DOI] [PubMed] [Google Scholar]
- 2.Casola S et al. B cell receptor signal strength determines B cell fate. Nat Immunol 5, 317–327, doi: 10.1038/ni1036 (2004). [DOI] [PubMed] [Google Scholar]
- 3.Yeap LS et al. Sequence-Intrinsic Mechanisms that Target AID Mutational Outcomes on Antibody Genes. Cell 163, 1124–1137, doi: 10.1016/j.cell.2015.10.042 (2015). [DOI] [PMC free article] [PubMed] [Google Scholar]
- 4.Bunker JJ et al. Natural polyreactive IgA antibodies coat the intestinal microbiota. Science 358, doi: 10.1126/science.aan6619 (2017). [DOI] [PMC free article] [PubMed] [Google Scholar]
- 5.Reboldi A & Cyster JG Peyer’s patches: organizing B-cell responses at the intestinal frontier. Immunol Rev 271, 230–245, doi: 10.1111/imr.12400 (2016). [DOI] [PMC free article] [PubMed] [Google Scholar]
- 6.Bemark M et al. Somatic hypermutation in the absence of DNA-dependent protein kinase catalytic subunit (DNA-PK(cs)) or recombination-activating gene (RAG)1 activity. J Exp Med 192, 1509–1514, doi: 10.1084/jem.192.10.1509 (2000). [DOI] [PMC free article] [PubMed] [Google Scholar]
- 7.Biram A et al. B Cell Diversification Is Uncoupled from SAP-Mediated Selection Forces in Chronic Germinal Centers within Peyer’s Patches. Cell Rep 30, 1910–1922 e1915, doi: 10.1016/j.celrep.2020.01.032 (2020). [DOI] [PMC free article] [PubMed] [Google Scholar]
- 8.Bunker JJ & Bendelac A IgA Responses to Microbiota. Immunity 49, 211–224, doi: 10.1016/j.immuni.2018.08.011 (2018). [DOI] [PMC free article] [PubMed] [Google Scholar]
- 9.Casola S & Rajewsky K B cell recruitment and selection in mouse GALT germinal centers. Curr Top Microbiol Immunol 308, 155–171 (2006). [DOI] [PubMed] [Google Scholar]
- 10.Biram A et al. BCR affinity differentially regulates colonization of the subepithelial dome and infiltration into germinal centers within Peyer’s patches. Nat Immunol 20, 482–492, doi: 10.1038/s41590-019-0325-1 (2019). [DOI] [PubMed] [Google Scholar]
- 11.Tas JM et al. Visualizing antibody affinity maturation in germinal centers. Science 351, 1048–1054, doi: 10.1126/science.aad3439 (2016). [DOI] [PMC free article] [PubMed] [Google Scholar]
- 12.Victora GD et al. Germinal Center Dynamics Revealed by Multiphoton Microscopy with a Photoactivatable Fluorescent Reporter. Cell 143, 592–605, doi: 10.1016/j.cell.2010.10.032 (2010). [DOI] [PMC free article] [PubMed] [Google Scholar]
- 13.Livet J et al. Transgenic strategies for combinatorial expression of fluorescent proteins in the nervous system. Nature 450, 56–62, doi: 10.1038/nature06293 (2007). [DOI] [PubMed] [Google Scholar]
- 14.Shinnakasu R et al. Regulated selection of germinal-center cells into the memory B cell compartment. Nature immunology, doi: 10.1038/ni.3460 (2016). [DOI] [PubMed] [Google Scholar]
- 15.Meyer-Hermann M, Binder SC, Mesin L & Victora GD Computer Simulation of Multi-Color Brainbow Staining and Clonal Evolution of B Cells in Germinal Centers. Front Immunol 9, 2020, doi: 10.3389/fimmu.2018.02020 (2018). [DOI] [PMC free article] [PubMed] [Google Scholar]
- 16.Tiller T, Busse CE & Wardemann H Cloning and expression of murine Ig genes from single B cells. J Immunol Methods 350, 183–193, doi: 10.1016/j.jim.2009.08.009 (2009). [DOI] [PubMed] [Google Scholar]
- 17.Meffre E et al. Surrogate light chain expressing human peripheral B cells produce self-reactive antibodies. J Exp Med 199, 145–150, doi: 10.1084/jem.20031550 (2004). [DOI] [PMC free article] [PubMed] [Google Scholar]
- 18.Pollard M in Germinal Centers in Immune Responses (ed N. Odartchenko H. Cottier, R. Schindler, C.C. Congdon ) 343–348 (Springer, 1967). [Google Scholar]
- 19.Brugiroux S et al. Genome-guided design of a defined mouse microbiota that confers colonization resistance against Salmonella enterica serovar Typhimurium. Nat Microbiol 2, 16215, doi: 10.1038/nmicrobiol.2016.215 (2016). [DOI] [PubMed] [Google Scholar]
- 20.Esterhazy D et al. Compartmentalized gut lymph node drainage dictates adaptive immune responses. Nature 569, 126–130, doi: 10.1038/s41586-019-1125-3 (2019). [DOI] [PMC free article] [PubMed] [Google Scholar]
- 21.Greiff V et al. Systems Analysis Reveals High Genetic and Antigen-Driven Predetermination of Antibody Repertoires throughout B Cell Development. Cell Rep 19, 1467–1478, doi: 10.1016/j.celrep.2017.04.054 (2017). [DOI] [PubMed] [Google Scholar]
- 22.Chen H et al. BCR selection and affinity maturation in Peyer’s patch germinal centres. Nature, doi: 10.1038/s41586-020-2262-4 (2020). [DOI] [PMC free article] [PubMed] [Google Scholar]
Methods References
- 23.Madisen L et al. A robust and high-throughput Cre reporting and characterization system for the whole mouse brain. Nature neuroscience 13, 133–140, doi: 10.1038/nn.2467 (2010). [DOI] [PMC free article] [PubMed] [Google Scholar]
- 24.Dogan I et al. Multiple layers of B cell memory with different effector functions. Nat Immunol 10, 1292–1299, doi: 10.1038/ni.1814 (2009). [DOI] [PubMed] [Google Scholar]
- 25.Liu K et al. In vivo analysis of dendritic cell development and homeostasis. Science 324, 392–397, doi: 10.1126/science.1170540 (2009). [DOI] [PMC free article] [PubMed] [Google Scholar]
- 26.Shulman Z et al. T follicular helper cell dynamics in germinal centers. Science 341, 673–677, doi: 10.1126/science.1241680 (2013). [DOI] [PMC free article] [PubMed] [Google Scholar]
- 27.Trombetta JJ et al. Preparation of Single-Cell RNA-Seq Libraries for Next Generation Sequencing. Curr Protoc Mol Biol 107, 4 22 21–24 22 17, doi: 10.1002/0471142727.mb0422s107 (2014). [DOI] [PMC free article] [PubMed] [Google Scholar]
- 28.Mesin L et al. Restricted Clonality and Limited Germinal Center Reentry Characterize Memory B Cell Reactivation by Boosting. Cell 180, 92–106 e111, doi: 10.1016/j.cell.2019.11.032 (2020). [DOI] [PMC free article] [PubMed] [Google Scholar]
- 29.Lefranc MP et al. IMGT, the international ImMunoGeneTics information system. Nucleic acids research 37, D1006–1012, doi: 10.1093/nar/gkn838 (2009). [DOI] [PMC free article] [PubMed] [Google Scholar]
- 30.Masella AP, Bartram AK, Truszkowski JM, Brown DG & Neufeld JD PANDAseq: paired-end assembler for illumina sequences. BMC Bioinformatics 13, 31, doi: 10.1186/1471-2105-13-31 (2012). [DOI] [PMC free article] [PubMed] [Google Scholar]
- 31.Retter I, Althaus HH, Munch R & Muller W VBASE2, an integrative V gene database. Nucleic acids research 33, D671–674, doi: 10.1093/nar/gki088 (2005). [DOI] [PMC free article] [PubMed] [Google Scholar]
- 32.DeWitt WS 3rd, Mesin L, Victora GD, Minin VN & Matsen F. A. t. Using Genotype Abundance to Improve Phylogenetic Inference. Mol Biol Evol 35, 1253–1265, doi: 10.1093/molbev/msy020 (2018). [DOI] [PMC free article] [PubMed] [Google Scholar]
- 33.Notredame C, Higgins DG & Heringa J T-Coffee: A novel method for fast and accurate multiple sequence alignment. J Mol Biol 302, 205–217, doi: 10.1006/jmbi.2000.4042 (2000). [DOI] [PubMed] [Google Scholar]
- 34.Crooks GE, Hon G, Chandonia JM & Brenner SE WebLogo: a sequence logo generator. Genome Res 14, 1188–1190, doi: 10.1101/gr.849004 (2004). [DOI] [PMC free article] [PubMed] [Google Scholar]
- 35.Gupta NT et al. Change-O: a toolkit for analyzing large-scale B cell immunoglobulin repertoire sequencing data. Bioinformatics 31, 3356–3358, doi: 10.1093/bioinformatics/btv359 (2015). [DOI] [PMC free article] [PubMed] [Google Scholar]
- 36.Krzywinski M et al. Circos: an information aesthetic for comparative genomics. Genome Res 19, 1639–1645, doi: 10.1101/gr.092759.109 (2009). [DOI] [PMC free article] [PubMed] [Google Scholar]
- 37.Pasqual G, Angelini A & Victora GD Triggering positive selection of germinal center B cells by antigen targeting to DEC-205. Methods in molecular biology 1291, 125–134, doi: 10.1007/978-1-4939-2498-1_10 (2015). [DOI] [PubMed] [Google Scholar]
- 38.Palm NW et al. Immunoglobulin A coating identifies colitogenic bacteria in inflammatory bowel disease. Cell 158, 1000–1010, doi: 10.1016/j.cell.2014.08.006 (2014). [DOI] [PMC free article] [PubMed] [Google Scholar]
- 39.Mouquet H et al. Polyreactivity increases the apparent affinity of anti-HIV antibodies by heteroligation. Nature 467, 591–595, doi: 10.1038/nature09385 (2010). [DOI] [PMC free article] [PubMed] [Google Scholar]
- 40.Chao A Nonparametric-Estimation of the Number of Classes in a Population. Scand J Stat 11, 265–270 (1984). [Google Scholar]
- 41.Colwell RK EstimateS: Statistical estimation of species richness and shared species from samples. Version 9. User’s Guide and application published at: http://purl.oclc.org/estimates. (2013). [Google Scholar]
Associated Data
This section collects any data citations, data availability statements, or supplementary materials included in this article.


