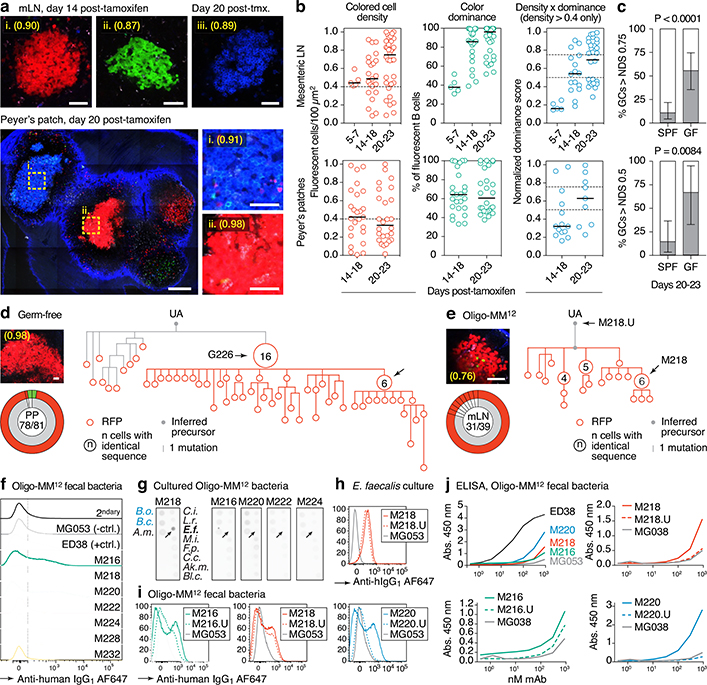
Fig. 3 |. Accelerated selection in gaGCs of GF and Oligo-MM12-colonized mice.
(a) Multiphoton images of GF mLN and PP at different times after tamoxifen. Blue is collagen (2nd harmonics), white is autofluorescence, other colors are from the Confetti allele. Scalebars, 200 μm (PP overview), 50 μm (close-ups). (b) Quantification of images as in (a) for mLN (top) and PP (bottom). Each symbol represents one GC. Median indicated. Only GCs with density > 0.4 fluorescent cells/100 μm2 are included in NDS calculation. (c) Proportion of GCs with NDS > 0.75 in mLN (top) and > 0.5 in PP (bottom) under SPF and GF conditions at 20–23 days post-tamoxifen. For SPF and GF mLN gaGCs, n = 57 and 27 respectively. For PP gaGCs, n=21 and 9, respectively. SPF data are from Fig. 1g and Extended Data Fig. 1e. n= P-value is for two-tailed Fisher’s exact test. Error bars represent the exact binomial 95% confidence interval. Data for (b,c) are from 3–5 mice per timepoint, except D5–7 that is from 1 mouse. (d, e) Igh sequence relationship among B cells from GF (d) and Oligo-MM12 (e) GCs with high NDS. Details as in Fig. 2a. Additional trees provided in Extended Data Fig. 6a, b. Scalebars, 50 μm (f) Flow cytometry of Oligo-MM12 mAbs binding to fecal bacteria from Oligo-MM12-colonized mice. ED38, polyreactive positive control mAb; MG053, negative control mAb. Dotted line placed at 102 for reference. (g) Dot blot showing binding of Oligo-MM12 mAbs to a subset of cultured Oligo-MM12 strains (black font, see Table S4). Bacteroides ovatus (B.o.) and Bacteroides caccae (B.c.) are negative controls (blue font). Arrows indicate Enterococcus faecalis, bound only by M218. (h, i) Binding of mAb M218 to cultured E. faecalis (h) and of 3 Oligo-MM12 mAbs to fecal bacteria from Oligo-MM12-colonized mice (i) by flow cytometry. Gated on SYTO BC+, DAPI– live bacteria as in Extended Data Fig. 2d. (j) mAb binding to fecal bacteria by ELISA. Lines are mean of two assays.

