

ABSTRACT
Background
Low vitamin D status, assessed using serum 25-hydroxyvitamin D [25(OH)D] concentration, has been associated with depression, but research among minority populations, such as Puerto Ricans is limited. We examined the association between serum 25(OH)D and self-reported depressive symptomatology across 3 waves of follow-up in a cohort of Puerto Rican adults residing in Massachusetts.
Objectives
We evaluated the cross-sectional and longitudinal associations between serum 25(OH)D and self-reported depressive symptoms in the Boston Puerto Rican Health Study (BPRHS) cohort.
Methods
Participants of the BPRHS were evaluated for depressive symptoms using the Center for Epidemiologic Studies Depression Scale (CES-D). Serum 25(OH)D was measured at baseline (n = 1434), year 2 (n = 1218), and year 5 (n = 914). We categorized serum 25(OH)D concentration as sufficient (≥20 ng/mL), insufficient (12 to <20 ng/mL), and deficient (<12 ng/mL). Multivariable linear regression was used for cross-sectional analyses at baseline, and repeated measures mixed effects modeling was used over 3 waves of follow-up for longitudinal analyses. We conducted sensitivity analyses in vitamin D supplement nonusers and participants with complete data on baseline serum 25(OH)D and CES-D at all 3 visits.
Results
Serum 25(OH)D concentration was not associated with CES-D score in cross-sectional analysis [β = −0.85; 95% CI: −2.80, 1.10 for deficient compared with sufficient 25(OH)D; P-trend = 0.59] or in longitudinal analyses over 5 y [β = −0.41; 95% CI: −1.95, 1.13 for deficient compared with sufficient 25(OH)D; P-trend = 0.93]. Results were similar in sensitivity analyses restricted to vitamin D supplement nonusers (n = 1371) and in analyses conducted in participants with complete measures of baseline serum 25(OH)D and CES-D score at all 3 visits (n = 887) [β = −0.12; 95% CI: −1.98, 1.74 for deficient compared with sufficient 25(OH)D; P-trend = 0.93].
Conclusions
We did not observe a significant association between serum 25(OH)D and depressive symptomatology in the BPRHS cohort.
Keywords: Puerto Rican adults, serum 25(OH)D, depressive symptomatology, CES-D, nutrition, minority
See corresponding commentary on page 3047.
Introduction
Hypovitaminosis D is a global public health concern, with some reports suggesting that almost half of the adult world population could have suboptimal vitamin D status (1, 2). According to the US NHANES, >40% of the US population has insufficient 25(OH)D concentrations [defined as 25(OH)D <20 ng/mL], and this prevalence is even higher among minority groups such as Hispanics, compared with non-Hispanic whites; almost 70% of the Hispanic population has been shown to suffer from low vitamin D (3).
Vitamin D is a fat-soluble secosteroid, essential for DNA damage repair (4–6), and is well known for its antioxidant and anti-inflammatory characteristics (7–10). It is thought to play a protective role against osteoporosis, cardiovascular diseases and hypertension (11–13), diabetes (14, 15), multiple sclerosis, autoimmune diseases (15–17), cancer, and death (18–21). Vitamin D receptors are found in neurons and glial cells in the prefrontal cortex, hippocampus, and other brain regions known to be responsible for influencing mood, emotional well-being, cognitive health, and neurological function (22, 23). Vitamin D is processed and synthesized by skin upon exposure to ultraviolet radiation from sunlight. When obtained from either sunlight exposure or diet, it first undergoes hydroxylation into 25-hydroxyvitamin D [25(OH)D; calcidiol] in the liver, and then, in the kidneys, generates the active form 1,25-dihydroxyvitamin D [1,25(OH)2D; calcitriol] (14, 15). 1,25(OH)2D then binds to vitamin D receptors, activating those receptors to induce or inhibit gene expression (24–26). An imbalance in this process due to low 1,25(OH)2D concentration and underactive vitamin D receptors can impair the function of neurotransmitters such as dopamine, noradrenaline, adrenaline, serotonin, which play an essential role in the pathophysiology of depression and other neurological disorders (23, 27–29). Systemic inflammation is also thought to contribute to depression. Vitamin D is known for its anti-inflammatory properties, and chronic low 25(OH)D concentrations could contribute to development of inflammatory diseases such as depression (10, 14, 30, 31).
The literature on association between vitamin D and depression has yielded mixed results, with some studies supporting an inverse association (32–43) and others reporting no association or inconclusive findings (44–51). The majority of studies addressing this association have been cross-sectional (32, 33, 37–41), and more prospective studies are needed to assess the association between 25(OH)D and depression. A cross-sectional study evaluating the association between serum 25(OH)D and depressive symptomatology [using the Center for Epidemiologic Studies Depression Scale (CES-D)] in Japanese adults reported no association (OR: 0.59; 95% CI: 0.30, 1.15) between serum 25(OH)D and depressive symptomatology (51). Similarly, a cross-sectional study in older Chinese adults reported an inverse association between plasma 25(OH)D and depression in a crude model, with no association after controlling for confounders, including geographical location (48). A study examining cross-sectional as well as longitudinal associations in older Australian men reported that serum 25(OH)D concentration <20 ng/mL was associated with 65% greater odds of current depression (OR:1.65; 95% CI: 1.13, 2.42) but not of past (OR: 1.15; 95% CI: 0.83, 1.58) or incident depression (45). Likewise, a study suggested that higher serum 25(OH)D concentration was associated with lower depression only cross-sectionally and not prospectively (46). However, findings from the fifth Korea NHANES 2010, suggested 28% lower odds of depressive symptoms in those with sufficient serum 25(OH)D (≥20 ng/mL) compared with those insufficient (<20 ng/mL) (P = 0.032) (40). A prospective study conducted in a well-functioning elderly population reported that lower serum 25(OH)D was significantly associated with greater increase in depression scores (P = 0.003 and P < 0.001 at 2- and 4-y follow-ups, respectively) and with risk of incident depression (HR: 1.65; 95% CI: 1.23, 2.22) (36).
Puerto Ricans living in the United States represent the second largest subgroup of the US Hispanic population, and have been reported to have a substantially higher prevalence of depression, as well as other chronic medical illnesses, compared with non-Hispanic white and other Hispanic populations (3, 52–54). Hispanics also suffer from greater vitamin D deficiency due to higher skin pigmentation, poor diet, obesity, and higher prevalence of renal insufficiency, compared with non-Hispanic whites (2, 3, 55). A study evaluating the vitamin D status of >4000 adults living in Puerto Rico reported that almost 70% of the study population had suboptimal serum 25(OH)D concentration (26), defined as <30 ng/mL. The cut-point for suboptimal 25(OH)D concentration used by the above study [25(OH)D <30 ng/mL] is different from that recommended by the Institute of Medicine for insufficiency used in our study (<20 ng/mL).
We are not aware of any studies focused on the association between vitamin D and depression in Puerto Ricans living in the US mainland. Most of the epidemiological research examining the chronic diseases and their risk factors has focused on Mexican Americans. It has been suggested that prevalence and risks of health outcomes vary significantly by Hispanic ethnic subgroup (52). Identifying modifiable risk factors for depression such as vitamin D deficiency could be an important step toward prevention, as well as future treatments for this high-risk population of Puerto Ricans living in the United States. We thus examined cross-sectional and longitudinal associations between serum 25(OH)D concentration and self-reported depressive symptomatology in the Boston Puerto Rican Health Study (BPRHS), a cohort of Puerto Rican adults residing in the state of Massachusetts, adjusting for a number of covariates in our analyses.
Methods
Study design, participants, and data collection
The design and data collection methods for the BPRHS have been described previously (52). Briefly, the BPRHS is a longitudinal cohort of Boston-area self-identified Puerto Rican adults, aged 45–75 y at baseline (n = 1500; 2004–2007), with 2- and 5-y follow-up assessments. All study participants provided written informed consent, in their preferred language (English or Spanish). At baseline, 2-y, and 5-y study visits, information on participant demographics, health conditions, and dietary habits and patterns was collected in participants’ homes by a trained bilingual interviewer, in either English or Spanish. A certified phlebotomist drew blood samples, and interviewers conducted anthropometric and blood pressure measurements at baseline and 2-y and 5-y follow-ups. The study was approved by the Institutional Review Boards at Tufts University and the University of Massachusetts Lowell, and has clinicaltrials.gov registration (NCT01231958).
Vitamin D [serum 25(OH)D] measures
Serum concentration of 25(OH)D (in nanograms per milliliter) was assessed in fasting blood samples at baseline. Fasting blood samples were processed and transported on ice, within 3 h, to the Nutrition Evaluation Laboratory, Jean Mayer USDA Human Nutrition Research Center on Aging at Tufts University. 25(OH)D was measured with an I-125 RIA kit (DiaSorin Inc.) as per manufacturer's specifications (68100E). The RIA has been shown to have similar sensitivity and specificity to LC/MS-MS (56) and was chosen due to its availability when this measurement was performed. The intra- and interassay CVs for these measurements were 10.8% and 9.4%, respectively.
We used serum 25(OH)D cut-off points suggested by the Food and Nutrition Board (FNB) at the National Academies of Science, Engineering and Medicine, classifying concentration 20 ng/mL (≥50 nmol/L) as sufficient, <12 ng/mL (<30 nmol/L) as deficient, and 12 to <20 ng/mL (30 to <50 nmol/L) as insufficient. (57, 58). We also conducted sensitivity analysis using serum 25(OH)D concentration as a linear predictor.
Outcome: self-reported depressive symptoms
Self-reported depressive symptoms were measured with the CES-D scale. The CES-D includes 20 questions regarding appetite, loneliness, feeling of sadness, hopelessness, helplessness, worthlessness, fears, sleep quality, and crying spells, and measured the self-reported depressive symptoms experienced in the week prior to the interview. Responses were measured with a 4-point Likert scale, from 0 = rarely/never, 1 = some or few times, 2 = occasionally or moderate amount, to 3 = most of the time or all the time. The final calculated CES-D score was the sum of scores on each of these 20 questions, ranging from 0 to 60, with high scores representing more depressive symptoms (59).
This instrument to measure the self-reported depressive symptomatology has been shown to be reliable for use in the Puerto Rican adult population (60, 61) and to correlate with the Diagnostic and Statistical Manual of Mental Disorders (4th ed; DSM-IV) categories of depression in Hispanics (62). The Cronbach α for the CES-D scale component in the BPRHS was reported to be 0.90 in previous studies (61). The CES-D score was used as a continuous outcome variable at 3 time points: baseline, year 2, and year 5. A CES-D score ≥16 is generally indicative of depressive symptomatology (59). Of our participants, 60%, 53%, and 47% had CES-D score above this cut-off at baseline, year 2, and year 5, respectively, suggesting a substantial burden of depression in this population. Because of the high burden of depression in our cohort, we treated CES-D as a continuous outcome, rather than dichotomizing.
Assessment of covariates
Information on several covariates, including age, sex, BMI, physical activity, season of blood collection, education, smoking status, alcohol use, vitamin D supplement intake, chronic medical conditions, vitamin B-6 [plasma pyridoxal-5′-phosphate (PLP) concentration], fruit servings/d and vegetable servings/d, vitamin B-12, folate, adherence to Mediterranean diet (MeD), marital status, food security status, and functional status activities of daily living (ADL) was collected at baseline and year-2 and year-5 follow-up visits. We categorized sex as: 1) male, 2) female taking estrogen and/or premenopausal, or 3) female not taking any estrogen and postmenopausal. BMI (kg/m2) was calculated based on body weight and height, measured by trained field workers during the interview. Physical activity was assessed using a self-reported modified Paffenbarger questionnaire of the Harvard Alumni Activity Survey (63, 64), that has been validated for use among the elderly Puerto Rican population (65). The physical activity score was measured as a weighted score of daily activities per 24 h, including hours spent per day sleeping and lying down or performing sedentary, light, moderate, or vigorous activities. Season of blood collection was categorized as summer, fall, winter, or spring, based on month of blood collection. Education was categorized as below ninth grade, ninth to 12th grade/General Educational Diploma, or at least some college education or higher. Smoking status was evaluated as never smoker, past but not current, or current smoker, and alcohol use frequency was assessed as no intake within past year, moderate (≤1 drink/d for women, or ≤2 for men), or heavy (>1 drink/d for women and >2 for men). Vitamin D supplement intake was evaluated as a dichotomous variable. A chronic medical condition score was computed using the mean imputation technique, and included diabetes, hypertension, arthritis, heart attack, heart disease (other than heart attack), stroke, respiratory disease, liver or gallbladder disease, kidney disease, Parkinson disease, any cancer except skin, tuberculosis, hepatitis (type A, B, or C), and AIDS/HIV positive.
Vitamin B-6 was measured as PLP concentration in nanomoles per liter, using tyrosine decarboxylase with a radio enzymatic assay kit as described by Shin-Buehring et al. (66). The intra- and interassay CVs for these measurements were 5% and 6–8%, respectively. Generally accepted cut-offs for the vitamin B-6 deficiency, insufficiency, and sufficiency were used, and are defined as plasma PLP concentration <20 nmol/L, ≥20 to <30 nmol/L, and ≥30 nmol/L. respectively (67). Plasma vitamin B-12 and folate concentrations in picomoles per liter and nanograms per milliliter, respectively, were measured by radioassay using a kit from Bio-Rad. Data on dietary intake were collected with a semiquantitative FFQ validated for use in the BPRHS population (68). Information on intake of fruits and vegetables was collected through the FFQ. The MeD adherence score was computed based on FFQ responses; it measures adherence to 9 different dietary components: grains, vegetables, fruits, legumes/pulses/nuts, fish, monounsaturated to saturated fat intake ratio especially olive oil, meat/poultry, dairy products, and alcohol (69). MeD was derived as per Trichopoulou et al.’s description (69). We used dichotomized variables for marital status (married/living with spouse or partner in the household compared with unmarried/not living with partner/widowed/divorced), food security status (food secure compared with food insecure/food insecure with hunger) and functional status ADL (no impairment compared with moderate or considerable impairment).
Statistical analysis
Of 1500 BPRHS study participants at baseline, we excluded 1 outlier with an extreme serum 25(OH)D concentration of 160 ng/mL. We excluded from cross-sectional analyses participants with missing data on CES-D or serum 25(OH)D, leaving n = 1434, 1218, and 914 participants at baseline, year 2, and year 5, respectively, with complete data on CES-D and serum 25(OH)D (Figure 1). Descriptive statistics by serum 25(OH)D category (deficient, insufficient, sufficient) were assessed at baseline, using t test or ANOVA for continuous variables, and χ2 test for categorical variables.
FIGURE 1.
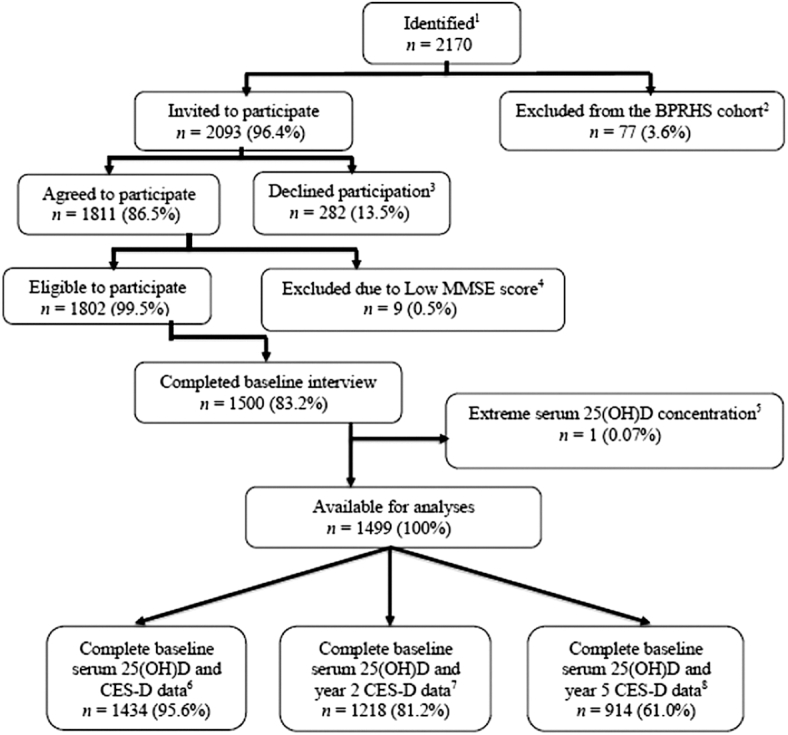
Flow diagram of participants included in the analysis. 1Identified as Puerto Rican; 2excluded due to serious illness/being homeless or if the participant moved away from study area; 3declined participation due to being busy, lack of interest, or refused to have blood drawn; 4excluded due to low Mini Mental State Examination Score (MMSE <10); 5excluded due to extreme serum 25(OH)D concentration of 160 ng/mL; 6participants with complete baseline serum 25(OH)D and CES-D data; 7participants with complete baseline serum 25(OH)D and year-2 CES-D data; 8participants with complete baseline serum 25(OH)D and year-5 CES-D data. BPRHS, Boston Puerto Rican Health Study; CES-D, Center for Epidemiologic Studies Depression Scale; 25(OH)D, 25-hydroxyvitamin D.
Cross-sectional analyses
Multivariable linear regression was used to assess cross-sectional associations between 25(OH)D category and CES-D score at baseline. We adjusted for relevant covariates, in a series of nested models: a univariate model, without adjusting for any other covariate (model 1); subsequently adjusting for age (years), sex/estrogenic status, BMI, education, and season of blood collection (model 2); then additionally adjusting for smoking status, alcohol use, physical activity score, and chronic medical conditions score (model 3); and in a final model further adjusting for natural log-transformed plasma PLP concentration (vitamin B-6), and number of fruit servings/d and vegetable servings/d (model 4). Choice of covariates was based on their potential to be a confounder for the association between serum 25(OH)D and depression, taking into consideration, for consistency, how often they had been considered as covariates in prior studies. Thus, variables like age, sex/estrogenic status, BMI, education, and season of blood collection, which are typically adjusted for in all studies of 25(OH)D and depression, were included in model 2, with additional factors that are not universally adjusted in prior literature but that we deemed important, entering into models 3 and 4.
Longitudinal analyses
Linear mixed-effects models were fitted across the 3 waves of the study, to examine the longitudinal association between baseline serum 25(OH)D and CES-D score. Similar to the cross-sectional analysis, model 1 was a univariate model. The models used baseline serum 25(OH)D as an exposure, further adjusting for age, sex, BMI, education, and season of blood collection in model 2; additionally adjusting for smoking, alcohol use, physical activity score, and chronic medical conditions score in model 3; and also for log-transformed plasma PLP, and number of fruit servings and vegetable servings/d in model 4.
To assess model fit, we used Akaike information criterion (AIC), Bayesian information criterion (BIC), and log-likelihood ratio statistics. We chose our final model as that which provided lower AIC and BIC, and higher log-likelihood values, which suggest better model fit. We used the autoregressive covariance structure for fitting the random intercept-random slope repeated measures mixed-effect model. The autoregressive covariance structure has homogeneous variances and assumes the highest correlation between the 2 outcome measurements that are closest to each other in time and gets weaker with measures that are further apart. The lme package in ‘R Foundation’ was used to perform linear mixed-effect modeling.
To examine whether CES-D trajectory over time varied by baseline serum 25(OH)D concentration, we tested for interaction with baseline 25(OH)D by including a time × serum 25(OH)D multiplicative term in our fully adjusted linear mixed model. We also conducted several sensitivity analyses, including modeling serum 25(OH)D as a linear, instead of a categorical predictor, restricting analysis to participants not taking vitamin D supplements, as well as restricting to participants with complete serum 25(OH)D and CES-D data at all 3 time points. We examined whether participants with complete data on serum 25(OH)D and CES-D at all 3 time points differed from those who did not have complete data. We conducted additional sensitivity analyses adjusted for MeD, plasma vitamin B-12 (picomoles per liter) and plasma folate (nanograms per milliliter) concentrations, marital status, food security status, and ADL variables. All analyses were conducted using ‘R Foundation’ statistical software, version 3.5.3.
Results
At baseline, the mean ± SD age of participants was 57.0 ± 7.6 y, and 70% of the study population was female. Almost 57% of the cohort was obese and 30% was overweight. The values of range and mean ± SD for serum 25(OH)D and depressive symptomatology were as follows: 4–48 ng/mL and 17.4 ± 6.8 ng/mL for baseline serum 25(OH)D; 0–60 and 20.3 ± 13.2 for baseline CES-D; 0–54 and 18.1 ± 12.4 for year-2 CES-D; and 0–52 and 16.2 ± 11.2 for CES-D at year-5 follow-up visit. We reported the baseline range and mean for all the other continuous covariates in our analysis: BMI (17.0–63.8; 31.8), physical activity score (24.3–62.6; 31.6), baseline chronic medical condition score (0–10.2; 2.8), vitamin B-6 (PLP) concentration (5.5–737; 56.3 nmol/L), plasma concentration of vitamin B-12 and folate (57.6–1895.2 and 401.2 pmol/L; and 2.6–87.6 and 18.9 ng/mL, respectively). At baseline, 39% of the cohort reported diabetes, 68% hypertension, 51% arthritis, 13% heart disease, 4% stroke, 38% respiratory diseases, 16% gallbladder diseases, 12% kidney diseases, 6% cancer except skin, 9% hepatitis, and 8% reported to have had heart attack in the past. Food insecurity was reported by 27% of the cohort, and 29% reported being married/living with partner in the household.
Participants with sufficient serum 25(OH)D were older, had lower BMI and higher plasma PLP (vitamin B-6), vitamin B-12, and folate concentrations, and higher fruits servings/d intake than those with deficient 25(OH)D (Table 1). They were also less likely to be heavy alcohol users, more likely to be never smokers, and more likely to have had blood drawn during the summer, compared with participants deficient in 25(OH)D. Physical activity score, chronic medical condition score, number of vegetable servings/d, and proportions according to sex, education, marital status, food security status, and functional ADL categories did not differ significantly across serum 25(OH)D categories. In cross-sectional analyses at baseline, after adjusting for covariates, serum 25(OH)D was not associated with CES-D score (β = −0.85; 95% CI: −2.80, 1.10 for deficient compared with sufficient; P-trend = 0.59) (Table 2, model 4). Similarly, in the fully adjusted longitudinal model, baseline serum 25(OH)D was not significantly associated with depressive symptoms over 5 y (β = −0.41; 95% CI: −1.95, 1.13 for deficient, compared with sufficient; P-trend = 0.93) (Table 3, model 4). After adjusting for age, sex, BMI, education, and season of blood collection, there was a significant association between insufficient but not deficient serum 25(OH)D and higher CES-D score (β = 1.43; 95% CI: 0.21, 2.65) (Table 3, model 2). This association was attenuated after controlling for smoking status in the model (β = 1.18; 95% CI: −0.03, 2.38). Sensitivity analyses among nonusers of vitamin D supplements (Supplemental Table 1, model 4) as well as among participants with complete data on serum 25(OH)D and CES-D at all 3 time points (Table 4, model 4) yielded similar results (β = −0.34; 95% CI: −1.94, 1.27 for deficient compared with sufficient; P-trend = 0.95; and β = −0.12; 95% CI: −1.98, 1.74 for deficient compared with sufficient, P-trend = 0.93, respectively). Results of longitudinal analysis, using serum 25(OH)D as a linear predictor (Supplemental Table 2, model 4), were consistent with findings in the baseline analyses (β = 0.004; 95% CI: −0.08, 0.09; P = 0.91). We did not observe a significant interaction with time: baseline serum 25(OH)D did not modify the CES-D trajectory over 5 y (P-interaction = 0.43).
TABLE 1.
Baseline characteristics of the 1434 participants by serum 25(OH)D status1
| Deficient (<12 ng/mL) n = 293 | Insufficient (12 to <20 ng/mL) n = 641 | Sufficient (≥20 ng/mL) n = 500 | P value2 | |
|---|---|---|---|---|
| Serum 25(OH)D, ng/mL | 9.0 ± 1.8 | 15.5 ± 2.3 | 24.9 ± 4.7 | |
| CES-D score | 20.0 ± 13.6 | 21.0 ± 13.3 | 19.8 ± 13.0 | 0.3 |
| Age, y | 55.8 ± 7.3 | 57.2 ± 7.6 | 57.4 ± 7.6 | <0.01** |
| BMI, kg/m2 | 32.7 ± 7.4 | 32.0 ± 6.7 | 31.2 ± 5.9 | <0.01** |
| Physical activity score3 | 31.2 ± 4.4 | 31.5 ± 5.0 | 31.8 ± 4.7 | 0.3 |
| Chronic medical condition score4 | 2.7 ± 1.6 | 2.8 ± 1.7 | 2.7 ± 1.6 | 0.7 |
| Plasma vitamin B-6, nmol/L | 41.4 ± 31.0 (43.0)5 | 52.1 ± 44.4 (30.9)5 | 70.4 ± 79.6 (21.8)5 | <0.001*** |
| Fruits daily serving, g/d6 | 1.6 ± 1.4 | 1.8 ± 1.7 | 1.7 ± 1.5 | 0.05 |
| 285 ± 313 | 331 ± 366 | 299 ± 316 | ||
| Vegetables daily serving, g/d6 | 2.2 ± 1.4 | 2.2 ± 1.4 | 2.2 ± 1.5 | 0.9 |
| 249 ± 147 | 253 ± 154 | 232 ± 134 | ||
| Plasma vitamin B-12, pmol/L | 364 ± 217 | 384 ± 186 | 445 ± 223 | <0.001*** |
| Plasma folate, ng/mL | 16.2 ± 6.7 | 18.9 ± 8.4 | 20.5 ± 9.2 | <0.001*** |
| Mediterranean diet score7 | 4.9 ± 1.4 | 4.9 ± 1.5 | 4.9 ± 1.5 | 1.0 |
| Sex | 0.35 | |||
| Male | 90 (31.0) | 195 (30.0) | 138 (28.0) | |
| Female taking estrogen and/or premenopausal | 47 (16.0) | 83 (13.0) | 62 (12.0) | |
| Female not taking estrogen and/or postmenopausal | 156 (53.0) | 363 (57.0) | 300 (60.0) | |
| Education | 0.1 | |||
| No schooling or below ninth grade | 124 (42.0) | 320 (50.0) | 223 (45.0) | |
| Ninth grade to 12th grade/GED | 116 (40.0) | 235 (37.0) | 196 (39.0) | |
| At least some college education | 53 (18.0) | 85 (13.0) | 80 (16.0) | |
| Smoking status | 0.04* | |||
| Never | 117 (40.0) | 281(44.0) | 245 (49.0) | |
| Past smoker not current | 87 (30.0) | 197(31.0) | 150 (30.0) | |
| Current smoker | 88 (30.0) | 162 (25.0) | 105 (21.0) | |
| Alcohol use | 0.02* | |||
| None within past year | 154 (53.0) | 368 (58.0) | 266 (53.0) | |
| Moderate8 | 100 (35.0) | 220 (35.0) | 198 (40.0) | |
| Heavy9 | 36 (12.0) | 46 (7.0) | 33 (7.0) | |
| Season of blood collection | <0.001*** | |||
| Summer | 49 (17.0) | 222 (35.0) | 208 (42.0) | |
| Fall | 66 (22.0) | 164 (25.0) | 151 (30.0) | |
| Winter | 78 (27.0) | 114 (18.0) | 70 (14.0) | |
| Spring | 100 (34.0) | 141 (22.0) | 71 (14.0) | |
| Marital status | 0.8 | |||
| Married/partner in the household | 90 (30.8) | 182 (28.5) | 147 (29.5) | |
| Unmarried/divorced/widowed | 202 (69.2) | 457 (71.5) | 352 (70.5) | |
| Food security status | 1.0 | |||
| Food secure | 208 (73.0) | 453 (73.1) | 363 (73.6) | |
| Food insecure/food insecure with hunger | 77 (27.0) | 167 (26.9) | 130 (26.4) | |
| ADL | 0.9 | |||
| No impairment | 88 (30.0) | 192 (30.0) | 143 (28.7) | |
| Moderate to considerable impairment10 | 205 (70.0) | 448 (70.0) | 356 (71.3) |
Values are mean (±SD) for continuous variables and frequency (%) for categorical variables. ADL, activities of daily living; CES-D, Center for Epidemiologic Studies Depression Scale; GED, General Education Diploma; 25(OH)D, 25-hydroxyvitamin D.
Values represent ANOVA P value for continuous and χ2P value for categorical variables. *P < 0.05; **P < 0.01; ***P< 0.001.
Weighted score of daily activities per 24 h, including hours spent per day sleeping and lying down, or performing sedentary, light, moderate, or vigorous activities.
Computed using the mean imputation technique, includes medical conditions such as diabetes, hypertension, arthritis, heart attack, heart disease (other than heart attack), stroke, respiratory disease, liver or gallbladder disease, kidney disease, Parkinson disease, any cancer except skin, tuberculosis, hepatitis (type A, B, or C), and AIDS/HIV positive.
Percentage of participants with plasma pyridoxal-5′-phosphate concentration <30 nmol/L.
Grams per day for fruits and vegetables were computed from the FFQ and can differ from servings based on differing weights within the groups.
Measures adherence to 9 different dietary components: grains, vegetables, fruits, legumes/pulses/nuts, fish, monounsaturated to saturated fat intake ratio especially olive oil, meat/poultry, dairy products, and alcohol; score ranges from 0–9.
(≤1 drink/d for women, or ≤2 for men).
(>1 drink/d for women and >2 for men).
Moderate/considerable impairment is considered as difficulty performing 1–5 ADL of 12 activities due to a health condition or disability, whereas considerable impairment is defined as difficulty performing ≥6 ADL of 12.
TABLE 2.
Cross-sectional association between serum 25(OH)D category and depressive symptoms (CES-D scores) (n = 1434) in the Boston Puerto Rican Health Study at baseline1
| Sufficient (ref) (≥20 ng/mL) | Insufficient (12 to <20 ng/mL) | Deficient (<12 ng/mL) | P-trend | |
|---|---|---|---|---|
| Model 12 | Ref | 1.15 (−0.40, 2.70) | 0.25 (−1.66, 2.17) | 0.56 |
| Model 23 | Ref | 1.14 (−0.39, 2.67) | 0.35 (−1.58, 2.29) | 0.49 |
| Model 34 | Ref | 0.76 (−0.72, 2.25) | −0.44 (−2.35, 1.46) | 0.90 |
| Model 45 | Ref | 0.50 (−1.00, 2.00) | −0.85 (−2.80, 1.10) | 0.59 |
Values are β (95% CI). CES-D, Center for Epidemiologic Studies Depression Scale; 25(OH)D, 25-hydroxyvitamin D.
Univariate model (n = 1434).
Model adjusted for age, sex, BMI, education, season of blood collection (n = 1420).
Model 2 additionally adjusted for smoking status, alcohol use, physical activity score, and chronic medical conditions score [conditions include diabetes, hypertension, arthritis, heart attack, heart disease (other than heart attack), stroke, respiratory disease, liver or gallbladder disease, kidney disease, Parkinson disease, cancer except skin, tuberculosis, hepatitis (type A, B, or C), and AIDS/HIV positive] (n = 1398).
Model 3 additionally adjusted for log-transformed plasma pyridoxal-5′-phosphate concentration + fruit servings/d + vegetable servings/d) (n = 1394).
TABLE 3.
Longitudinal association of baseline serum 25(OH)D category and 5-y change in depression (CES-D scores) in the Boston Puerto Rican Health Study1
| Sufficient (ref) (≥20 ng/mL) | Insufficient (12 to <20 ng/mL) | Deficient (<12 ng/mL) | P-trend | |
|---|---|---|---|---|
| Model 12 | Ref | 1.48 (0.23, 2.73) | 0.76 (−0.77, 2.30) | 0.16 |
| Model 23 | Ref | 1.43 (0.21, 2.65) | 0.67 (−0.87, 2.21) | 0.19 |
| Model 34 | Ref | 1.02 (−0.16, 2.21) | −0.16 (−1.67, 1.35) | 0.79 |
| Model 45 | Ref | 0.82 (−0.37, 2.02) | −0.41 (−1.95, 1.13) | 0.93 |
Values are β (95% CI). CES-D, Center for Epidemiologic Studies Depression Scale; 25(OH)D, 25-hydroxyvitamin D.
Univariate model (adjusted for visit).
Model adjusted for age, sex, BMI, education, season of blood collection, visit.
Model 2 additionally adjusted for smoking status, alcohol use, physical activity score, and chronic medical conditions score [diabetes, hypertension, arthritis, heart attack, heart disease (other than heart attack), stroke, respiratory disease, liver or gallbladder disease, kidney disease, Parkinson disease, cancer except skin, tuberculosis, hepatitis (type A, B, or C), and AIDS/HIV positive].
Model 3 additionally adjusted for log-transformed plasma pyridoxal-5′-phosphate concentration + fruit servings/d + vegetable servings/d.
TABLE 4.
Longitudinal sensitivity analyses restricted to n = 887 participants with complete data on baseline serum 25(OH)D and depressive symptoms (CES-D score) at all 3 time points1
| Normal (ref) (≥20 ng/mL) | Insufficient (12 to <20 ng/mL) | Deficient (<12 ng/mL) | P-trend | |
|---|---|---|---|---|
| Model 12 | Ref | 1.54 (0.04, 3.06) | 0.83 (−0.99, 2.65) | 0.26 |
| Model 23 | Ref | 1.33 (−0.14, 2.80) | 0.86 (−0.97, 2.70) | 0.25 |
| Model 34 | Ref | 0.93 (−0.51, 2.38) | 0.08 (1.75, 1.91) | 0.76 |
| Model 45 | Ref | 0.79 (−0.66, 2.25) | −0.12 (−1.98, 1.74) | 0.93 |
Values are β (95% CI). CES-D, Center for Epidemiologic Studies Depression Scale; 25(OH)D, 25-hydroxyvitamin D.
Univariate model (adjusted for visit).
Model adjusted for age, sex, BMI, education, season of blood collection, visit.
Model 2 additionally adjusted for smoking status, alcohol use, physical activity score, and chronic medical conditions score [diabetes, hypertension, arthritis, heart attack, heart disease (other than heart attack), stroke, respiratory disease, liver or gallbladder disease, kidney disease, Parkinson disease, cancer except skin, tuberculosis, hepatitis (type A, B, or C), and AIDS/HIV positive].
Model 3 additionally adjusted for log-transformed plasma pyridoxal-5′-phosphate concentration + fruit servings/d + vegetable servings/d.
Participants with complete data on serum 25(OH)D and CES-D at all time points had lower mean serum 25(OH)D concentration (ANOVA P = 0.02), higher BMI (ANOVA P < 0.001), higher percentage male, lower percentage postmenopausal/non-estrogen–using women (χ2P = 0.06), more non-alcohol-users, and fewer heavy drinkers (χ2P = 0.009) compared with those who had ≥1 missing measure of serum 25(OH)D or CES-D over the course of 3 follow-up waves (Supplemental Table 3). Other characteristics, including age, CES-D score, physical activity score, chronic medical condition score, plasma PLP concentration, educational level, and smoking status did not differ significantly between participants with complete 25(OH)D and CES-D measures at all 3 time points, and those with ≥1 missing measure (Supplemental Table 3). Adjusting for MeD score instead of fruit and vegetable intake in our fully adjusted longitudinal model did not alter results substantially [β = −0.37; 95% CI: −1.91, 1.16 for deficient compared with sufficient serum 25(OH)D]. Additionally, adjusting for vitamin B-12, folate, marital status, food security status, or ADL in the same model, yielded results similar to our main analyses [β = −0.43; 95% CI: −1.95, 1.10 for deficient compared with sufficient serum 25(OH)D].
Discussion
We did not observe a significant association between serum 25(OH)D and self-reported depression over 5 y of follow-up in this cohort of Boston-area Puerto Rican adults. Vitamin D has been hypothesized to benefit the neurological system via anti-inflammatory, antioxidant properties and its role in calcium homeostasis, neurogenesis, immunomodulation, and clearance of β-amyloid (14, 31, 70–72). Several studies have suggested that lower serum 25(OH)D can be associated with higher risk of depression (32, 33, 37–39, 41, 73). A systematic review and meta-analysis focusing on the association between serum 25(OH)D and depression noted a significantly increased HR (HR = 2.21; 95% CI: 1.40, 3.49) for lowest compared with highest vitamin D categories (74). A study by Williams et al. (36), mentioned previously, also reported no association between serum 25(OH)D and depression at baseline, but observed increased depression over time and significant association with 25(OH)D at 2-y and 4-y follow-ups, suggesting a long-term effect of vitamin D. Studies focusing on the association between dietary intake of vitamin D as well as vitamin D supplement use and depression have yielded mixed results (75–78).
Studies evaluating the association between serum 25(OH)D and depression include age, BMI, physical activity, education, alcohol, and smoking in analyses, because they are commonly considered confounders (46, 47, 79). Factors such as higher BMI and lower physical activity (80–82), smoking (83, 84), and excessive alcohol use (85, 86) are associated with higher depressive symptomatology as well as lower serum 25(OH)D in the literature. Consistently, we observed that serum 25(OH)D deficiency was associated with higher BMI, current smoking status, and heavy alcohol use. Lower physical activity score, and current but not past smoking status was associated with higher CES-D score in the BPRHS. In addition to these commonly considered confounders, we included several other covariates in our models. Instead of adjusting for a dichotomous sex variable (female compared with male), we additionally accounted for the estrogenic status of women. It is well documented that women are at higher risk of depression compared with males (87), but that this risk is associated with fluctuations in estrogen concentration (88, 89). We adjusted for season of blood collection due to its well-documented association with vitamin D status (90) and depression, especially seasonal affective disorder (91, 92). Serum 25(OH)D concentration is usually higher during the summer season and drops during the winter. Seasonal affective depressive disorders are more prevalent during the winter season, when sunlight or exposure to sunlight is limited. We adjusted for chronic medical condition score as a measure of individuals’ overall health and well-being in our main models. Suffering from ≥1 chronic diseases can increase the risk of developing depression, and depression itself can contribute to poor physical health (93). As expected, we observed a significant association between higher chronic medical condition score and depression in this cohort. Multiple micronutrients are essential for maintaining optimal brain health (94). Suboptimal intakes of B vitamins, particularly vitamin B-6 (95, 96), folate, and vitamin B-12 (97), are well documented for their adverse neurological effects, including on depression. Additionally, vitamin B-6 inadequacy (PLP <30 nmol/L) was previously associated longitudinally with greater depressive symptomatology in this cohort. Thus, we adjusted for plasma vitamin B-6 (PLP) in all models, while adjusting for plasma vitamin B-12 and folate in additional sensitivity analysis. Participants in the sufficient vitamin D category were also more likely to have sufficient vitamin B-6 concentration, compared with those deficient or insufficient. We also included fruit and vegetable intake as a variable in our models, due to the potential association of overall dietary quality with vitamin D status as well as depression (98).
We evaluated several other covariates, such as adherence to MeD (99), as a measure of dietary quality or a healthy diet, and marital status, food security status (100), and ADL, as measures of functional impairment and frailty (101), due to their potential association with depression reported in the literature.
Differing study designs and study populations, as well as differences in how depression is assessed, could have contributed to inconsistent findings in studies of the association between 25(OH)D and depression. Not all studies use the same cutoffs for evaluating vitamin D status. Some studies have used serum 25(OH)D <20 ng/mL for vitamin D inadequacy, whereas others have used <30 ng/mL or <40 ng/mL. Some studies have categorized serum 25(OH)D in quartiles or as a linear predictor (14, 15, 36, 46, 102), which can contribute to variability in reported findings. We used <20 ng/mL for insufficiency and <12 ng/mL for deficiency, as suggested by the FNB at the Institute of Medicine of the National Academies (57, 58) as well as current literature supportive of this categorization (103–105). We also conducted analysis using serum 25(OH)D as a linear predictor, the results of which were consistent with our categorical analyses.
Examining the association between vitamin D status and depression in this cohort is challenging because Puerto Rican adults living in the US mainland have unique social, cultural, and dietary structures that can influence their physical, mental, and emotional health outcomes. Complex mechanisms involving different risk factors specific to this population could exist. Although we tried to incorporate several demographic, social, and dietary covariates in our analyses, residual confounding is possible, and could contribute to the observed lack of association. This population has a substantially higher prevalence of chronic conditions, poverty, and lower educational status than the general population (52), which could have impacted our results. As with any epidemiolocal study, we cannot fully rule out the possibility of selection bias. It is possible that individuals with pre-existing depression might have chosen not to enroll in the study or might be more likely to be lost to follow-up after enrollment, compared with nondepressed individuals. If differential selection or loss is simultaneously related to 25(OH)D, selection bias could occur. However, the mean CES-D score in participants who had complete data at all time points did not differ significantly (P = 0.2), from those who had incomplete data (Supplemental Table 3), suggesting that depressive symptomatology did not contribute substantially to missing data or loss to follow-up in this cohort.
With 3 measures from >900 participants, 2 measures from >1200, and baseline from >1400 participants, the study was well powered to detect an association between serum 25(OH)D and depressive symptoms. Despite the lack of association observed in this study, our analyses highlighted several other important relations. The empirical literature suggests several risk factors for depression, which include but are not limited to, being female, lower education, poverty, poor nutrition, lack of physical activity, having other chronic diseases and impairments, smoking, and excessive alcohol use. Consistent with the literature, our findings support several of these associations.
This study has several strengths, including longitudinal design, repeated measures of CES-D at 3 time points, adjustment for key covariates, and accurate assessment of serum 25(OH)D, allowing us to examine associations over the course of 5 y of follow-up. Serum 25(OH)D is a well-accepted and widely used biomarker for vitamin D status. The CES-D scale has been reported as a reliable measure of self-reported depression among the Puerto Rican adult population (60, 61), and it correlates well with the DSM-IV categories of depression in Hispanics (62), providing a reliable measure of depression assessment in this study population.
Our study also has several limitations. Although we adjusted for covariates in our models, there is still a possibility of residual confounding, due to factors other than the covariates we included. Lastly, this study was conducted specifically in the adult Puerto Rican population residing in the United States. Although pathophysiology between vitamin D and depression would be expected to exist across populations, the pathways relating these measures might differ across populations; therefore, our findings might not be fully generalizable to other populations.
In summary, our study results do not support the association between vitamin D status and self-reported depressive symptomatology in Boston-area Puerto Rican adults over the course of 5 y. Although we did not observe a significant association between serum 25(OH)D and depressive symptoms in this cohort, this finding does not alter the public health and clinical recommendation regarding the importance of maintaining sufficient vitamin D status for general health. Further studies are needed on the role for vitamin D in depression in diverse populations.
Supplementary Material
Acknowledgments
We thank Esther Jennings for assistance with this manuscript.
The authors’ contributions were as follows—NS and NP: designed the research and had primary responsibility for the final content; NS: performed the statistical data analyses; JS-L: provided assistance with use of R-statistical software and statistical modeling; KLT: was principal investigator of the study and oversaw all data collection and documentation; and all authors: contributed to editing of the manuscript and reviewed and approved the final manuscript.
Notes
This work was funded by NIH P50 HL105185, P01 AG023394, and R01 AG055948.
Authors disclosures: The authors report no conflicts of interest.
Supplemental Tables 1–3 are available from the “Supplementary data” link in the online posting of the article and from the same link in the online table of contents at https://academic.oup.com/jn/.
Abbreviations used: ADL, activities of daily living; AIC, Akaike information criterion; BIC, Bayesian information criterion; BPRHS, Boston Puerto Rican Health Study; CES-D, Center for Epidemiologic Studies Depression Scale; DSM-IV, Diagnostic and Statistical Manual of Mental Disorders (4th ed); FNB, Food and Nutrition Board; MeD, Mediterranean diet; MMSE, Mini Mental State Examination; PLP, pyridoxal-5′-phosphate; 1,25(OH)2D, 1,25-dihydroxyvitamin D; 25(OH)D, 25-hydroxyvitamin D.
Contributor Information
Neha Sahasrabudhe, Department of Public Health, Zuckerberg College of Health Sciences, University of Massachusetts Lowell, Lowell, MA, USA.
Jong Soo Lee, Department of Mathematical Sciences, University of Massachusetts Lowell, Lowell, MA, USA; Geriatric Research Education Clinical Center, Edith Nourse Rogers Memorial Veterans Hospital, Bedford, MA, USA.
Tammy M Scott, Friedman School of Nutrition Science and Policy, Tufts University, Boston, MA, USA.
Laura Punnett, Department of Biomedical Engineering, University of Massachusetts Lowell, Lowell, MA, USA.
Katherine L Tucker, Department of Biomedical and Nutritional Sciences, University of Massachusetts Lowell, Lowell, MA, USA.
Natalia Palacios, Department of Public Health, Zuckerberg College of Health Sciences, University of Massachusetts Lowell, Lowell, MA, USA; Geriatric Research Education Clinical Center, Edith Nourse Rogers Memorial Veterans Hospital, Bedford, MA, USA; Department of Nutrition, Harvard University School of Public Health, Boston, MA, USA.
References
- 1. Holick MF, Chen TC. Vitamin D deficiency: a worldwide problem with health consequences. Am J Clin Nutr. 2008;87:1080S–6S. [DOI] [PubMed] [Google Scholar]
- 2. Holick MF. The vitamin D deficiency pandemic: approaches for diagnosis, treatment and prevention. Rev Endocr Metab Disord. 2017;18:153–65. [DOI] [PubMed] [Google Scholar]
- 3. Forrest KY, Stuhldreher WL. Prevalence and correlates of vitamin D deficiency in US adults. Nutr Res. 2011;31:48–54. [DOI] [PubMed] [Google Scholar]
- 4. Nair R, Maseeh A. Vitamin D: the “sunshine” vitamin. J Pharmacol Pharmacother. 2012;3:118–26. [DOI] [PMC free article] [PubMed] [Google Scholar]
- 5. Graziano S, Johnston R, Deng O, Zhang J, Gonzalo S. Vitamin D/vitamin D receptor axis regulates DNA repair during oncogene-induced senescence. Oncogene. 2016;35:5362–76. [DOI] [PMC free article] [PubMed] [Google Scholar]
- 6. Nair-Shalliker V, Armstrong BK, Fenech M. Does vitamin D protect against DNA damage?. Mutat Res. 2012;733:50–7. [DOI] [PubMed] [Google Scholar]
- 7. Cherniack EP, Troen BR, Florez HJ, Roos BA, Levis S. Some new food for thought: the role of vitamin D in the mental health of older adults. Curr Psychiatry Rep. 2009;11:12–9. [DOI] [PubMed] [Google Scholar]
- 8. Yin K, Agrawal DK. Vitamin D and inflammatory diseases. J Inflamm Res. 2014;7:69–87. [DOI] [PMC free article] [PubMed] [Google Scholar]
- 9. Kalueff AV, Tuohimaa P. Neurosteroid hormone vitamin D and its utility in clinical nutrition. Curr Opin Clin Nutr Metab Care. 2007;10:12–9. [DOI] [PubMed] [Google Scholar]
- 10. Llewellyn DJ, Lang IA, Langa KM, Melzer D. Vitamin D and cognitive impairment in the elderly U.S. population. J Gerontol A Biol Sci Med Sci. 2011;66:59–65. [DOI] [PMC free article] [PubMed] [Google Scholar]
- 11. Dobnig H, Pilz S, Scharnagl H, Renner W, Seelhorst U, Wellnitz B, Kinkeldei J, Boehm BO, Weihrauch G, Maerz W. Independent association of low serum 25-hydroxyvitamin D and 1,25-dihydroxyvitamin D levels with all-cause and cardiovascular mortality. Arch Intern Med. 2008;168:1340–9. [DOI] [PubMed] [Google Scholar]
- 12. Wang TJ, Pencina MJ, Booth SL, Jacques PF, Ingelsson E, Lanier K, Benjamin EJ, D'Agostino RB, Wolf M, Vasan RS. Vitamin D deficiency and risk of cardiovascular disease. Circulation. 2008;117:503–11. [DOI] [PMC free article] [PubMed] [Google Scholar]
- 13. Rostand SG. Ultraviolet light may contribute to geographic and racial blood pressure differences. Hypertension. 1997;30:150–6. [DOI] [PubMed] [Google Scholar]
- 14. Holick MF. Vitamin D deficiency. N Engl J Med. 2007;357:266–81. [DOI] [PubMed] [Google Scholar]
- 15. Holick MF. Vitamin D: importance in the prevention of cancers, type 1 diabetes, heart disease, and osteoporosis. Am J Clin Nutr. 2004;79:362–71. [DOI] [PubMed] [Google Scholar]
- 16. Merlino LA, Curtis J, Mikuls TR, Cerhan JR, Criswell LA, Saag KG; Iowa Women's Health Study. Vitamin D intake is inversely associated with rheumatoid arthritis: results from the Iowa Women's Health Study. Arthritis Rheum. 2004;50:72–7. [DOI] [PubMed] [Google Scholar]
- 17. Holick MF. Vitamin D: important for prevention of osteoporosis, cardiovascular heart disease, type 1 diabetes, autoimmune diseases, and some cancers. South Med J. 2005;98:1024–7. [DOI] [PubMed] [Google Scholar]
- 18. Chen TC, Holick MF. Vitamin D and prostate cancer prevention and treatment. Trends Endocrinol Metab. 2003;14:423–30. [DOI] [PubMed] [Google Scholar]
- 19. Freedman DM, Looker AC, Chang SC, Graubard BI. Prospective study of serum vitamin D and cancer mortality in the United States. J Natl Cancer Inst. 2007;99:1594–602. [DOI] [PubMed] [Google Scholar]
- 20. John EM, Schwartz GG, Dreon DM, Koo J. Vitamin D and breast cancer risk: the NHANES I epidemiologic follow-up study, 1971–1975 to 1992. National Health and Nutrition Examination Survey. Cancer Epidemiol Biomarkers Prev. 1999;8:399–406. [PubMed] [Google Scholar]
- 21. Tangpricha V, Flanagan JN, Whitlatch LW, Tseng CC, Chen TC, Holt PR, Lipkin MS, Holick MF. 25-hydroxyvitamin D-1alpha-hydroxylase in normal and malignant colon tissue. Lancet. 2001;357:1673–4. [DOI] [PubMed] [Google Scholar]
- 22. Drevets WC, Price JL, Furey ML. Brain structural and functional abnormalities in mood disorders: implications for neurocircuitry models of depression. Brain Struct Funct. 2008;213:93–118. [DOI] [PMC free article] [PubMed] [Google Scholar]
- 23. Eyles DW, Smith S, Kinobe R, Hewison M, McGrath JJ. Distribution of the vitamin D receptor and 1 alpha-hydroxylase in human brain. J Chem Neuroanat. 2005;29:21–30. [DOI] [PubMed] [Google Scholar]
- 24. Jiang P, Zhang L-H, Cai H-L, Li H-D, Liu Y-P, Tang M-M, Dang R-L, Zhu W-Y, Xue Y, He X. Neurochemical effects of chronic administration of calcitriol in rats. Nutrients. 2014;6:6048–59. [DOI] [PMC free article] [PubMed] [Google Scholar]
- 25. Wang JY, Wu JN, Cherng TL, Hoffer BJ, Chen HH, Borlongan CV, Wang Y. Vitamin D(3) attenuates 6-hydroxydopamine-induced neurotoxicity in rats. Brain Res. 2001;904:67–75. [DOI] [PubMed] [Google Scholar]
- 26. Suárez-Martínez EB, Pérez CM, Cruz SK, Khorsandi S, Chardón C, Ferder L. Importance of vitamin D and vitamin D levels status in Puerto Ricans. J Health Care Poor Underserved. 2013;24:38–47. [DOI] [PMC free article] [PubMed] [Google Scholar]
- 27. Eyles DW, Burne TH, McGrath JJ. Vitamin D, effects on brain development, adult brain function and the links between low levels of vitamin D and neuropsychiatric disease. Front Neuroendocrinol. 2013;34:47–64. [DOI] [PubMed] [Google Scholar]
- 28. Bertone-Johnson ER. Vitamin D and the occurrence of depression: causal association or circumstantial evidence?. Nutr Rev. 2009;67:481–92. [DOI] [PMC free article] [PubMed] [Google Scholar]
- 29. McCann JC, Ames BN. Is there convincing biological or behavioral evidence linking vitamin D deficiency to brain dysfunction?. FASEB J. 2008;22:982–1001. [DOI] [PubMed] [Google Scholar]
- 30. Berk M, Williams LJ, Jacka FN, O'Neil A, Pasco JA, Moylan S, Allen NB, Stuart AL, Hayley AC, Byrne ML et al. So depression is an inflammatory disease, but where does the inflammation come from?. BMC Med. 2013;11:200. [DOI] [PMC free article] [PubMed] [Google Scholar]
- 31. Chei CL, Raman P, Yin ZX, Shi XM, Zeng Y, Matchar DB. Vitamin D levels and cognition in elderly adults in China. J Am Geriatr Soc. 2014;62:2125–9. [DOI] [PMC free article] [PubMed] [Google Scholar]
- 32. Hoang MT, DeFina LF, Willis BL, Leonard DS, Weiner MF, Sherwood Brown E. Association between low serum 25-hydroxyvitamin D and depression in a large sample of healthy adults: the Cooper Center Longitudinal Study. Mayo Clin Proc. 2011;86:1050–5. [DOI] [PMC free article] [PubMed] [Google Scholar]
- 33. Kjaergaard M, Joakimsen R, Jorde R. Low serum 25-hydroxyvitamin D levels are associated with depression in an adult Norwegian population. Psychiatry Res. 2011;190:221–5. [DOI] [PubMed] [Google Scholar]
- 34. May HT, Bair TL, Lappe DL, Anderson JL, Horne BD, Carlquist JF, Muhlestein JB. Association of vitamin D levels with incident depression among a general cardiovascular population. Am Heart J. 2010;159:1037–43. [DOI] [PubMed] [Google Scholar]
- 35. Milaneschi Y, Shardell M, Corsi AM, Vazzana R, Bandinelli S, Guralnik JM, Ferrucci L. Serum 25-hydroxyvitamin D and depressive symptoms in older women and men. J Clin Endocrinol Metab. 2010;95:3225–33. [DOI] [PMC free article] [PubMed] [Google Scholar]
- 36. Williams JA, Sink KM, Tooze JA, Atkinson HH, Cauley JA, Yaffe K, Tylavsky FA, Rubin SM, Simonsick EM, Kritchevsky SB et al. Low 25-hydroxyvitamin D concentrations predict incident depression in well-functioning older adults: the Health, Aging, and Body Composition study. J Gerontol A Biol Sci Med Sci. 2014;70:757–63. [DOI] [PMC free article] [PubMed] [Google Scholar]
- 37. Videgren M, Virtanen JK, Tolmunen T, Nurmi T, Tuomainen T-P, Voutilainen S, Ruusunen A. Serum concentrations of 25-hydroxyvitamin D and depression in a general middle-aged to elderly population in Finland. J Nutr Health Aging. 2018;22:159–64. [DOI] [PubMed] [Google Scholar]
- 38. Jaddou HY, Batieha AM, Khader YS, Kanaan SH, El-Khateeb MS, Ajlouni KM. Depression is associated with low levels of 25-hydroxyvitamin D among Jordanian adults: results from a national population survey. Eur Arch Psychiatry Clin Neurosci. 2012;262:321–7. [DOI] [PubMed] [Google Scholar]
- 39. Sherchand O, Sapkota N, Chaudhari RK, Khan SA, Baranwal JK, Pokhrel T, Das BKL, Lamsal M. Association between vitamin D deficiency and depression in Nepalese population. Psychiatry Res. 2018;267:266–71. [DOI] [PubMed] [Google Scholar]
- 40. Chung HK, Cho Y, Choi S, Shin MJ. The association between serum 25-hydroxyvitamin D concentrations and depressive symptoms in Korean adults: findings from the fifth Korea National Health and Nutrition Examination Survey 2010. PLoS One. 2014;9:e99185. [DOI] [PMC free article] [PubMed] [Google Scholar]
- 41. Shin YC, Jung CH, Kim HJ, Kim EJ, Lim SW. The associations among vitamin D deficiency, C-reactive protein, and depressive symptoms. J Psychosom Res. 2016;90:98–104. [DOI] [PubMed] [Google Scholar]
- 42. Tolppanen AM, Sayers A, Fraser WD, Lewis G, Zammit S, Lawlor DA. The association of serum 25-hydroxyvitamin D3 and D2 with depressive symptoms in childhood—a prospective cohort study. J Child Psychol Psychiatry. 2012;53:757–66. [DOI] [PMC free article] [PubMed] [Google Scholar]
- 43. Hoogendijk WJG, Lips P, Dik MG, Deeg DJH, Beekman ATF, Penninx B. Depression is associated with decreased 25-hydroxyvitamin D and increased parathyroid hormone levels in older adults. Arch Gen Psychiatry. 2008;65:508–12. [DOI] [PubMed] [Google Scholar]
- 44. Chan R, Chan D, Woo J, Ohlsson C, Mellstrom D, Kwok T, Leung P. Association between serum 25-hydroxyvitamin D and psychological health in older Chinese men in a cohort study. J Affect Disord. 2011;130:251–9. [DOI] [PubMed] [Google Scholar]
- 45. Almeida OP, Hankey GJ, Yeap BB, Golledge J, Flicker L. Vitamin D concentration and its association with past, current and future depression in older men: the Health in Men Study. Maturitas. 2015;81:36–41. [DOI] [PubMed] [Google Scholar]
- 46. Jovanova O, Aarts N, Noordam R, Zillikens MC, Hofman A, Tiemeier H. Vitamin D serum levels are cross-sectionally but not prospectively associated with late-life depression. Acta Psychiatr Scand. 2017;135:185–94. [DOI] [PubMed] [Google Scholar]
- 47. Mousa A, Naderpoor N, de Courten MPJ, de Courten B. Vitamin D and symptoms of depression in overweight or obese adults: a cross-sectional study and randomized placebo-controlled trial. J Steroid Biochem Mol Biol. 2018;177:200–8. [DOI] [PubMed] [Google Scholar]
- 48. Pan A, Lu L, Franco OH, Yu Z, Li H, Lin X. Association between depressive symptoms and 25-hydroxyvitamin D in middle-aged and elderly Chinese. J Affect Disord. 2009;118:240–3. [DOI] [PubMed] [Google Scholar]
- 49. Zhao G, Ford ES, Li C, Balluz LS. No associations between serum concentrations of 25-hydroxyvitamin D and parathyroid hormone and depression among US adults. Br J Nutr. 2010;104:1696–702. [DOI] [PubMed] [Google Scholar]
- 50. Casseb GAS, Ambrosio G, Rodrigues ALS, Kaster MP. Levels of 25-hydroxyvitamin D3, biochemical parameters and symptoms of depression and anxiety in healthy individuals. Metab Brain Dis. 2019;34:527–35. [DOI] [PubMed] [Google Scholar]
- 51. Nanri A, Mizoue T, Matsushita Y, Poudel-Tandukar K, Sato M, Ohta M, Mishima N. Association between serum 25-hydroxyvitamin D and depressive symptoms in Japanese: analysis by survey season. Eur J Clin Nutr. 2009;63:1444–7. [DOI] [PubMed] [Google Scholar]
- 52. Tucker KL, Mattei J, Noel SE, Collado BM, Mendez J, Nelson J, Griffith J, Ordovas JM, Falcon LM. The Boston Puerto Rican Health Study, a longitudinal cohort study on health disparities in Puerto Rican adults: challenges and opportunities. BMC Public Health. 2010;10:107. [DOI] [PMC free article] [PubMed] [Google Scholar]
- 53. Looker AC, Dawson-Hughes B, Calvo MS, Gunter EW, Sahyoun NR. Serum 25-hydroxyvitamin D status of adolescents and adults in two seasonal subpopulations from NHANES III. Bone. 2002;30:771–7. [DOI] [PubMed] [Google Scholar]
- 54. Jacobs ET, Alberts DS, Foote JA, Green SB, Hollis BW, Yu Z, Martinez ME. Vitamin D insufficiency in southern Arizona. Am J Clin Nutr. 2008;87:608–13. [DOI] [PMC free article] [PubMed] [Google Scholar]
- 55. Castro JP, Penckofer S. The role of vitamin D in the health of Hispanic adults with diabetes. Hisp Health Care Int. 2014;12:90–8. [DOI] [PubMed] [Google Scholar]
- 56. Arneson WL, Arneson DL. Current methods for routine clinical laboratory testing of vitamin D levels. Lab Med. 2013;44:e38–42. [Google Scholar]
- 57. Institute of Medicine Dietary Reference Intakes for calcium and vitamin D. Washington (DC): The National Academies Press; 2011. [PubMed] [Google Scholar]
- 58. NIH-Office of Dietary Supplements Vitamin D factsheet for health professionals [Internet]. NIH;2018; [cited 2020 Mar 8]. Available from: https://ods.od.nih.gov/factsheets/VitaminD-HealthProfessional/.
- 59. Radloff LS. The CES-D scale: a self-report depression scale for research in the general population. Appl Psychol Meas. 1977;1:385–401. [Google Scholar]
- 60. Mahard RE. The CES-D as a measure of depressive mood in the elderly Puerto Rican population. J Gerontol. 1988;43:P24–5. [DOI] [PubMed] [Google Scholar]
- 61. Falcon LM, Tucker KL. Prevalence and correlates of depressive symptoms among Hispanic elders in Massachusetts. J Gerontol B Psychol Sci Soc Sci. 2000;55:S108–16. [DOI] [PubMed] [Google Scholar]
- 62. Cho MJ, Moscicki EK, Narrow WE, Rae DS, Locke BZ, Regier DA. Concordance between two measures of depression in the Hispanic Health and Nutrition Examination Survey. Soc Psychiatry Psychiatr Epidemiol. 1993;28:156–63. [DOI] [PubMed] [Google Scholar]
- 63. Paffenbarger RS Jr, Hyde RT, Wing AL, Lee IM, Jung DL, Kampert JB. The association of changes in physical-activity level and other lifestyle characteristics with mortality among men. N Engl J Med. 1993;328:538–45. [DOI] [PubMed] [Google Scholar]
- 64. Paffenbarger RS Jr, Wing AL, Hyde RT. Physical activity as an index of heart attack risk in college alumni. Am J Epidemiol. 1995;142:889–903. [DOI] [PubMed] [Google Scholar]
- 65. Tucker KL, Bermudez OI, Castaneda C. Type 2 diabetes is prevalent and poorly controlled among Hispanic elders of Caribbean origin. Am J Public Health. 2000;90:1288–93. [DOI] [PMC free article] [PubMed] [Google Scholar]
- 66. Shin-Buehring YS, Rasshofer R, Endres W. A new enzymatic method for pyridoxal-5-phosphate determination. J Inherit Metab Dis. 1981;4:123–4. [Google Scholar]
- 67. Lotto V, Choi S-W, Friso S. Vitamin B6: a challenging link between nutrition and inflammation in CVD. Br J Nutr. 2011;106:183–95. [DOI] [PubMed] [Google Scholar]
- 68. Tucker KL, Bianchi LA, Maras J, Bermudez OI. Adaptation of a food frequency questionnaire to assess diets of Puerto Rican and Non-Hispanic adults. Am J Epidemiol. 1998;148:507–18. [DOI] [PubMed] [Google Scholar]
- 69. Trichopoulou A, Costacou T, Bamia C, Trichopoulos D. Adherence to a Mediterranean diet and survival in a Greek population. N Engl J Med. 2003;348:2599–608. [DOI] [PubMed] [Google Scholar]
- 70. Llewellyn DJ, Langa KM, Lang IA. Serum 25-hydroxyvitamin D concentration and cognitive impairment. J Geriatr Psychiatry Neurol. 2009;22:188–95. [DOI] [PMC free article] [PubMed] [Google Scholar]
- 71. Kalueff AV, Eremin KO, Tuohimaa P. Mechanisms of neuroprotective action of vitamin D(3). Biochemistry (Moscow). 2004;69:738–41. [DOI] [PubMed] [Google Scholar]
- 72. Murphy MP, LeVine H. Alzheimer's disease and the β-amyloid peptide. J Alzheimers Dis. 2010;19:311. [DOI] [PMC free article] [PubMed] [Google Scholar]
- 73. Jaaskelainen T, Knekt P, Suvisaari J, Mannisto S, Partonen T, Saaksjarvi K, Kaartinen NE, Kanerva N, Lindfors O. Higher serum 25-hydroxyvitamin D concentrations are related to a reduced risk of depression. Br J Nutr. 2015;113:1418–26. [DOI] [PubMed] [Google Scholar]
- 74. Anglin RES, Samaan Z, Walter SD, McDonald SD. Vitamin D deficiency and depression in adults: systematic review and meta-analysis. Br J Psychiatry. 2013;202:100–7. [DOI] [PubMed] [Google Scholar]
- 75. Gowda U, Mutowo MP, Smith BJ, Wluka AE, Renzaho AM. Vitamin D supplementation to reduce depression in adults: meta-analysis of randomized controlled trials. Nutrition. 2015;31:421–9. [DOI] [PubMed] [Google Scholar]
- 76. Miyake Y, Tanaka K, Okubo H, Sasaki S, Arakawa M. Dietary vitamin D intake and prevalence of depressive symptoms during pregnancy in Japan. Nutrition. 2015;31:160–5. [DOI] [PubMed] [Google Scholar]
- 77. Spedding S. Vitamin D and depression: a systematic review and meta-analysis comparing studies with and without biological flaws. Nutrients. 2014;6:1501–18. [DOI] [PMC free article] [PubMed] [Google Scholar]
- 78. Kjaergaard M, Waterloo K, Wang CE, Almas B, Figenschau Y, Hutchinson MS, Svartberg J, Jorde R. Effect of vitamin D supplement on depression scores in people with low levels of serum 25-hydroxyvitamin D: nested case-control study and randomised clinical trial. Br J Psychiatry. 2012;201:360–8. [DOI] [PubMed] [Google Scholar]
- 79. Brouwer-Brolsma EM, Dhonukshe-Rutten RA, van Wijngaarden JP, van der Zwaluw NL, Sohl E, In't Veld PH, van Dijk SC, Swart KM, Enneman AW, Ham AC et al. Low vitamin D status is associated with more depressive symptoms in Dutch older adults. Eur J Nutr. 2016;55:1525–34. [DOI] [PMC free article] [PubMed] [Google Scholar]
- 80. Fernandes MR, Barreto W. Association between physical activity and vitamin D: a narrative literature review. Rev Assoc Med Bras. 2017;63:550–6. [DOI] [PubMed] [Google Scholar]
- 81. Craft LL, Perna FM. The benefits of exercise for the clinically depressed. Prim Care Companion J Clin Psychiatry. 2004;6:104–11. [DOI] [PMC free article] [PubMed] [Google Scholar]
- 82. Pourshahidi LK. Vitamin D and obesity: current perspectives and future directions. Proc Nutr Soc. 2015;74:115–24. [DOI] [PubMed] [Google Scholar]
- 83. Lange NE, Sparrow D, Vokonas P, Litonjua AA. Vitamin D deficiency, smoking, and lung function in the Normative Aging Study. Am J Respir Crit Care Med. 2012;186:616–21. [DOI] [PMC free article] [PubMed] [Google Scholar]
- 84. Ren W, Gu Y, Zhu L, Wang L, Chang Y, Yan M, Han B, He J. The effect of cigarette smoking on vitamin D level and depression in male patients with acute ischemic stroke. Compr Psychiatry. 2016;65:9–14. [DOI] [PubMed] [Google Scholar]
- 85. Boden JM, Fergusson DM. Alcohol and depression. Addiction. 2011;106:906–14. [DOI] [PubMed] [Google Scholar]
- 86. Ogunsakin O, Hottor T, Mehta A, Lichtveld M, McCaskill M. Chronic ethanol exposure effects on vitamin D levels among subjects with alcohol use disorder. Environ Health Insights. 2016;10:191–9. [DOI] [PMC free article] [PubMed] [Google Scholar]
- 87. Earls F. Sex differences in psychiatric disorders: origins and developmental influences. Psychiatr Dev. 1987;5:1–23. [PubMed] [Google Scholar]
- 88. Dalal PK, Agarwal M. Postmenopausal syndrome. Indian J Psychiatry. 2015;57:S222–32. [DOI] [PMC free article] [PubMed] [Google Scholar]
- 89. Shors TJ, Leuner B. Estrogen-mediated effects on depression and memory formation in females. J Affect Disord. 2003;74:85–96. [DOI] [PMC free article] [PubMed] [Google Scholar]
- 90. Klingberg E, Oleröd G, Konar J, Petzold M, Hammarsten O. Seasonal variations in serum 25-hydroxy vitamin D levels in a Swedish cohort. Endocrine. 2015;49:800–8. [DOI] [PMC free article] [PubMed] [Google Scholar]
- 91. Melrose S. Seasonal affective disorder: an overview of assessment and treatment approaches. Depress Res Treat. 2015;2015:178564. [DOI] [PMC free article] [PubMed] [Google Scholar]
- 92. Meesters Y, Gordijn MC. Seasonal affective disorder, winter type: current insights and treatment options. Psychol Res Behav Manag. 2016;9:317–27. [DOI] [PMC free article] [PubMed] [Google Scholar]
- 93. Katon W, Ciechanowski P. Impact of major depression on chronic medical illness. J Psychosom Res. 2002;53:859–63. [DOI] [PubMed] [Google Scholar]
- 94. Popa TA, Ladea M. Nutrition and depression at the forefront of progress. J Med Life. 2012;5:414–9. [PMC free article] [PubMed] [Google Scholar]
- 95. Hvas AM, Juul S, Bech P, Nexø E. Vitamin B6 level is associated with symptoms of depression. Psychother Psychosom. 2004;73:340–3. [DOI] [PubMed] [Google Scholar]
- 96. Spinneker A, Sola R, Lemmen V, Castillo MJ, Pietrzik K, González-Gross M. Vitamin B6 status, deficiency and its consequences – an overview. Nutr Hosp. 2007;22:7–24. [PubMed] [Google Scholar]
- 97. Almeida OP, Ford AH, Flicker L. Systematic review and meta-analysis of randomized placebo-controlled trials of folate and vitamin B12 for depression. Int Psychogeriatr. 2015;27:727–37. [DOI] [PubMed] [Google Scholar]
- 98. Augusto RA, Cobayashi F, Cardoso MA. Associations between low consumption of fruits and vegetables and nutritional deficiencies in Brazilian schoolchildren. Public Health Nutr. 2015;18:927–35. [DOI] [PMC free article] [PubMed] [Google Scholar]
- 99. Sánchez-Villegas A, Cabrera-Suárez B, Molero P, González-Pinto A, Chiclana-Actis C, Cabrera C, Lahortiga-Ramos F, Florido-Rodríguez M, Vega-Pérez P, Vega-Pérez R et al. Preventing the recurrence of depression with a Mediterranean diet supplemented with extra-virgin olive oil. The PREDI-DEP trial: study protocol. BMC Psychiatry. [Internet]2019;19:63 doi:10.1186/s12888-019-2036-4. [DOI] [PMC free article] [PubMed] [Google Scholar]
- 100. Maynard M, Andrade L, Packull-McCormick S, Perlman CM, Leos-Toro C, Kirkpatrick SI. Food insecurity and mental health among females in high-income countries. Int J Environ Res Public Health. 2018;15:1424. [DOI] [PMC free article] [PubMed] [Google Scholar]
- 101. Hammer-Helmich L, Haro JM, Jönsson B, Tanguy Melac A, Di Nicola S, Chollet J, Milea D, Rive B, Saragoussi D. Functional impairment in patients with major depressive disorder: the 2-year PERFORM study. Neuropsychiatr Dis Treat. 2018;14:239–49. [DOI] [PMC free article] [PubMed] [Google Scholar]
- 102. Collin C, Assmann KE, Deschasaux M, Andreeva VA, Lemogne C, Charnaux N, Sutton A, Hercberg S, Galan P, Touvier M et al. Plasma vitamin D status and recurrent depressive symptoms in the French SU.VI.MAX cohort. Eur J Nutr. 2017;56:2289–98. [DOI] [PubMed] [Google Scholar]
- 103. Shah S, Chiang C, Sikaris K, Lu Z, Bui M, Zebaze R, Seeman E. Serum 25-hydroxyvitamin D insufficiency in search of a bone disease. J Clin Endocrinol Metab. 2017;102:2321–8. [DOI] [PubMed] [Google Scholar]
- 104. WHO Scientific Group on the Prevention and Management of Osteoporosis Prevention and management of osteoporosis: report of a WHO Scientific Group. Geneva (Switzerland): World Health Organization; 2003. [Google Scholar]
- 105. Harvard Medical School. Vitamin D: what's the “right” level? [Internet]. 2016 [cited 2018 Oct 26]. Available from: https://www.health.harvard.edu/blog/vitamin-d-whats-right-level-2016121910893.
Associated Data
This section collects any data citations, data availability statements, or supplementary materials included in this article.