

Abstract
Dopamine is a wake-promoting neuromodulator in mammals and fruit flies. In Drosophila melanogaster, the network of clock neurons that drives sleep/activity cycles comprises both wake-promoting and sleep-promoting cell types. The large ventrolateral neurons (l-LNvs) and small ventrolateral neurons (s-LNvs) have been identified as wake-promoting neurons within the clock neuron network. The l-LNvs are innervated by dopaminergic neurons, and earlier work proposed that dopamine signaling raises cAMP levels in the l-LNvs and thus induces excitatory electrical activity (action potential firing), which results in wakefulness and inhibits sleep. Here, we test this hypothesis by combining cAMP imaging and patch-clamp recordings in isolated brains. We find that dopamine application indeed increases cAMP levels and depolarizes the l-LNvs, but, surprisingly, it does not result in increased firing rates. Downregulation of the excitatory D1-like dopamine receptor (Dop1R1) in the l-LNvs and s-LNvs, but not of Dop1R2, abolished the depolarization of l-LNvs in response to dopamine. This indicates that dopamine signals via Dop1R1 to the l-LNvs. Downregulation of Dop1R1 or Dop1R2 in the l-LNvs and s-LNvs does not affect sleep in males. Unexpectedly, we find a moderate decrease of daytime sleep with downregulation of Dop1R1 and of nighttime sleep with downregulation of Dop1R2. Since the l-LNvs do not use Dop1R2 receptors and the s-LNvs also respond to dopamine, we conclude that the s-LNvs are responsible for the observed decrease in nighttime sleep. In summary, dopamine signaling in the wake-promoting LNvs is not required for daytime arousal, but likely promotes nighttime sleep via the s-LNvs.
SIGNIFICANCE STATEMENT In insect and mammalian brains, sleep-promoting networks are intimately linked to the circadian clock, and the mechanisms underlying sleep and circadian timekeeping are evolutionarily ancient and highly conserved. Here we show that dopamine, one important sleep modulator in flies and mammals, plays surprisingly complex roles in the regulation of sleep by clock-containing neurons. Dopamine inhibits neurons in a central brain sleep center to promote sleep and excites wake-promoting circadian clock neurons. It is therefore predicted to promote wakefulness through both of these networks. Nevertheless, our results reveal that dopamine acting on wake-promoting clock neurons promotes sleep, revealing a previously unappreciated complexity in the dopaminergic control of sleep.
Keywords: cAMP, clock neurons, dopamine, patch-clamp recording, sleep, wakefulness
Introduction
Drosophila melanogaster has become a powerful and widely used model system for sleep research (for review, see Cirelli, 2009; Dubowy and Sehgal, 2017; Helfrich-Förster, 2018). As in mammals, the sleep-like state of Drosophila is associated with reduced sensory responsiveness and reduced brain activity (Nitz et al., 2002; van Swinderen et al., 2004), and is subject to both circadian and homeostatic regulation (Hendricks et al., 2000; Shaw et al., 2000). Furthermore, as in mammals, dopamine and octopamine (the insect functional homolog to noradrenaline) promote arousal in fruit flies (Andretic et al., 2005; Kume et al., 2005; Lima and Miesenböck, 2005; Wu et al., 2008; Lebestky et al., 2009; Crocker et al., 2010; Riemensperger et al., 2011), and GABA promotes sleep (Agosto et al., 2008; Gmeiner et al., 2013). Dopamine is most probably the strongest wake-promoting neuromodulator in fruit flies (for review, see Birman, 2005). Hyperactive and sleepless fumin mutants carry a mutation in the dopamine transporter, which transports released dopamine back into the dopaminergic neurons (Kume et al., 2005). The fumin mutation results in a hypomorphic transporter, which leads to permanently high dopamine levels. Similar wake-promoting and sleep-reducing effects are observed when dopaminergic neurons are excited (Lima and Miesenböck, 2005; Wu et al., 2008; Shang et al., 2011; Liu et al., 2012; Ueno et al., 2012). Conversely, mutants deficient for tyrosine hydroxylase (TH), the rate-limiting enzyme for dopamine synthesis in the nervous system, have reduced dopamine levels and increased sleep throughout the day (Riemensperger et al., 2011).
In D. melanogaster, the mushroom bodies (Joiner et al., 2006; Pitman et al., 2006; Yuan et al., 2006), and the pars intercerebralis (Foltenyi et al., 2007; Crocker et al., 2010) and lateralis (Chen et al., 2016), the fan-shaped body of the central complex (Liu et al., 2012; Ueno et al., 2012; Pimentel et al., 2016; Donlea et al., 2018), have been identified as brain regions that regulate sleep. In addition, the pigment-dispersing factor (PDF)-expressing large ventral lateral neurons (l-LNvs) and small ventral lateral neurons (s-LNvs) have been identified as wake-promoting neurons within the flies circadian clock neuron network (Parisky et al., 2008; Shang et al., 2008; Sheeba et al., 2008a; Lebestky et al., 2009; Guo et al., 2016; 2018; Potdar and Sheeba, 2018; Liang et al., 2019).
Both, the s-LNvs and l-LNvs express the neuropeptide PDF and send dendrites into the accessory medulla (AME), the insect clock center (Helfrich-Förster, 1995; Helfrich-Förster et al., 2007). These neurons are thought to be wake promoting: their activity coincides with the morning peak of wakefulness (Liang et al., 2019), and their optogenetic excitation, along with other lateral neuron types, reduces sleep (Guo et al., 2018). The s-LNvs project into the dorsolateral brain and are there connected to other clock neurons and several neurons downstream of the clock that controls activity and sleep (for review, see King and Sehgal, 2020). The l-LNvs are conspicuous clock neurons with wide arborizations in the ipsilateral and contralateral optic lobe and connections between the brain hemispheres (Helfrich-Förster et al., 2007). In the AME, their neurites overlap with those of dopaminergic neurons (Hamasaka and Nässel, 2006; Shang et al., 2011). Microarray studies show that they express genes encoding the excitatory dopamine receptors D1-like dopamine receptor (Dop1R1), Dop1R2, and DopEcR (dopamine/ecdysteroid receptor) and the inhibitory dopamine D2R, in addition to the excitatory octopamine receptors OAMB (octopamine receptor in mushroom bodies) and OA2 (octopamine 2 receptor; Kula-Eversole et al., 2010; Shang et al., 2011).
The l-LNvs respond to both dopamine and octopamine through increases in cAMP, but the responses to dopamine are stronger (Shang et al., 2011). Furthermore, the l-LNvs are directly light sensitive and promote arousal and activity in response to light, especially in the morning (Shang et al., 2008; Sheeba et al., 2008b; Fogle et al., 2011). Despite the strong responses of the l-LNvs to dopamine and their proposed role in controlling arousal, it is not known how dopamine signaling to the l-LNvs increases wakefulness and inhibits sleep. Receptivity to dopamine in the s-LNvs has not been previously addressed. Here, we downregulated Dop1R1 and Dop1R2 in the wake-promoting l-LNvs and s-LNvs and examined the consequences on intracellular cAMP levels, membrane potential, and electrical firing rate in the electrophysiologically accessible l-LNvs. Moreover, we analyzed the behavioral consequences of Dop1R1/Dop1R2 knockdown in the l-LNvs and s-LNvs on sleep and activity rhythms. As expected, we find that the knockdown of Dop1R1 reduces both cAMP and electrophysiological responses to bath-applied dopamine in the l-LNvs, confirming that dopamine signals via Dop1R1s. Unexpectedly, we find that the downregulation of the excitatory Dop1R1 receptor slightly decreases daytime sleep, suggesting that dopamine signaling via Dop1R1 to the LNvs usually promotes daytime sleep rather than wakefulness. Finally, we find that dopamine also likely signals to the s-LNvs via Dop1R2s, and that the downregulation of these receptors decreases night sleep. Collectively, these results cast doubt on the currently held view of LNvs as dedicated wake-promoting neurons and suggest a more complex regulation of sleep by these important clock neurons.
Materials and Methods
Fly stocks
Flies were raised on Drosophila food (0.8% agar, 2.2% sugar-beet syrup, 8.0% malt extract, 1.8% yeast, 1.0% soy flour, 8.0% corn flour, and 0.3% hydroxybenzoic acid) at 25°C under a 12 h light/dark (LD) cycle and transferred to 20°C at an age of ∼3 d.
To visualize TH-positive (dopaminergic) and PDF-positive neurons, we used TH-Gal4 (Friggi-Grelin et al., 2003) to drive UAS-10xmyrGFP in dopaminergic neurons and stained with anti-green fluorescent protein (GFP) and anti-PDF. For visualizing presynapses of dopaminergic neurons and postsynapses of PDF neurons, we expressed the vesicle marker synaptotagmin::GFP (UAS-sytI/II::GFP; Bloomington Drosophila Stock Center, Indiana University, Bloomington, IN) under the control of TH-Gal4 in dopaminergic neurons and a GFP-labeled postsynaptic protein—the Down syndrome cell-adhesion molecule (UAS-dscam::GFP; Wang et al., 2004)—under the control of Pdf-Gal4 in PDF neurons. To visualize the spatial vicinity of dopaminergic and PDF fibers, we used Split-GFP imaging (GFP reconstitution across synaptic partners (GRASP); Feinberg et al., 2008): yw;pdf-LexA/LexAop-GFP11;TH-Gal4/UAS-GFP1-10 flies were used to express the GFP11 fragment in the PDF-expressing LNvs and the GFP1-10 fragment in dopaminergic neurons, respectively. yw;pdf-LexA/LexAop-GFP11;TM6B.Tb/UAS-GFP1-10 flies were used as controls.
To downregulate the different dopamine receptors in all clock neurons or only in the PDF neurons (s-LNvs and l-LNvs), we used Clk856-Gal4 (Gummadova et al., 2009) or Pdf-Gal4 (Park et al., 2014), respectively, to either express UAS-Dop1R1RNAi (stock #31765, Bloomington Drosophila Stock Center), UAS-Dop1R2RNAi (no. 26 018, Bloomington Drosophila Stock Center), or UAS-D2RRNAi (stock #26001, Bloomington Drosophila Stock Center) alone, or to simultaneously express UAS-Dop1R1RNAi and UAS-Dop1R2RNAi. The flies with the relevant Gal4 and UAS constructs (crossed with UAS-dicer2 flies) were taken as controls. In addition, we used an inducible Gal4 version, termed GeneSwitch (GS; Osterwalder et al., 2001), under the control of the Pdf promotor (Depetris-Chauvin et al., 2011) to downregulate Dop1R1s or Dop1R2s in the PDF neurons only during the adulthood of the flies. GS is a fusion among the Gal4 binding, the nuclear factor-κB activation, and the human progesterone receptor ligand-binding domains, which is expressed in the pattern dictated by the desired promoter but remains transcriptionally silent in the absence of RU486 (RU), an analog of progesterone. RU was mixed to the food of the adult flies in the Trikinetics monitors (see below). In all experiments UAS-Dicer2 (stock #60012, Vienna Drosophila RNAi Center, Vienna, Austria) was expressed additionally to enhance the effect. For simplicity, we will call the experimental flies Clk856>Dop1RxRNAi, Pdf>Dop1RxRNAi, or Pdf-GS>Dop1RxRNAi, where the “x” stands for the relevant dopamine receptor. Their sleep and activity profiles will always be depicted in red, while the relevant control flies are shown in black or gray.
For imaging experiments, the above-described Clk856-Gal4 or Pdf-Gal4 line was used to express the ratiometric cAMP sensor UAS-Epac1-camps (Nikolaev et al., 2004), UAS-dicer2, and the RNAi constructs for different dopamine receptors (see above).
Quantitative PCR
To test the efficiency of the dopamine receptor knockdown we crossed the UAS-RNAi flies with elav-Gal4 flies (P{w[1mW. h] 5 GawB}elav[C155], Bloomington Drosophila Stock Center). This pan-neuronal driver was chosen to produce downregulation of the DopRs in all postmitotic neurons, thus allowing the assessment of the RNAi downregulation efficiency at the molecular level. Gal4 and UAS homozygous parental lines were used as controls. For quantitative PCR (qPCR), total RNA was extracted from five fly heads using the Zymo Quick-RNATM Microprep Kit and cDNA was prepared using the Qiagen QuantiTect Reverse Transcription Kit. We used three biological replicates for each fly line, and two runs were performed for each replicate. qPCRs were performed with the Bioline SensiFAST SYBR No-Rox Kit in the Qiagen Rotor-Gene Q qPCR machine, and raw data were adjusted by dynamic tube and slope correction calculation using Rotor-Gene Q Series software. The relative mRNA concentrations were calculated using the δ-CT equation, and α-tubulin was used as the reference gene. The following primers (5′−3') were used in the qPCR (0.1 mm concentration each), as follows: Dop1R1, GCCGCTGTCACTTGTGTGTCAATTGTAG; ACACCGGCAAAGGTCATCACCAGC; Dop1R2, GGCCACCAACTCTCTCATCACCAGC; AGATTCAGTATGGAGGCGGTGCTG; and α-tubulin, TCTGCGATTCGATGGTGCCCTTAAC; GGATCGCACTTGACCATCTGGTTGGC.
Immunostaining and microscopy
For immunostaining, whole-mount brains of male flies were fixed in 4% paraformaldehyde in PBS for 2 h at room temperature, followed by four washes in PBS containing 0.3% Triton X-100 (PBT). They were blocked in 5% normal goat serum in PBT. Subsequently, the specimens were incubated in the primary antibody solution overnight at 4°C. The primary antibody solution contained GFP antibody (raised in rabbit; dilution, 1:1000; catalog #A11122, Thermo Fisher Scientific) and PDF antibody (monoclonal mouse C7 antibody; dilution, 1:100; Developmental Studies Hybridoma Bank at the University of Iowa). After rinsing in PBT, fluorescence-conjugated secondary antibodies (Alexa Fluor Dyes, Thermo Fisher Scientific) were applied overnight at 4°C. The stained brains were finally embedded in Vectashield and scanned with a confocal microscope (TCS SPE, Leica).
Ex vivo live-cAMP imaging
Flies were well entrained to a 12 h LD cycle and imaging always took place during the light phase of the LD cycle [between zeitgeber time 2 (ZT2) and ZT8]. For imaging, male flies were anesthetized on ice and brains were dissected in cold hemolymph-like saline (HL3; Stewart et al., 1994) and mounted at the bottom of a plastic Petri dish in HL3. Brains were allowed to recover from dissection for at least 10 min before imaging. An epifluorescent imaging setup (VisiChrome High Speed Polychromator System, Visitron Systems; Axioskop2 FS plus, Zeiss Research Microscopy Solutions) with a 40× dipping objective [Zeiss 40×/1.0 differential interference contrast (DIC) visible-infrared (IR)] was used for all imaging experiments. Neurons were localized using GFP optics and were identified according to their position in the brain. Regions of interest were defined on single cell bodies in the Visiview Software (version 2.1.1; Visitron Systems). Time-lapse frames were acquired with 0.2 Hz for 12 min, exciting the cyan fluorescent protein (CFP) fluorophore of the ratiometric cAMP sensor with light of 405 nm. Emissions of CFP and yellow fluorescent protein (YFP) were detected separately by a CCD-camera (Photometrics, CoolSNAP HQ, Visitron Systems) with a beam splitter. After measuring baseline CFP and YFP levels for ∼100 s, pharmacological treatments were bath applied dropwise using a pipette. HL3 application served as negative control and 10 μm NKH477 (an activator of all adenylate cyclases) as positive control. Dopamine and SKF38393 (a DopR1 agonist) were diluted in HL3 and were applied in an end concentration of 1 and 0.1 mm, respectively. For tetrodotoxin (TTX) treatments, brains were incubated in 2 μm TTX in HL3 for 20 min before imaging, and dopamine was diluted in 2 μm TTX in HL3 for the application. Inverse fluorescence resonance energy transfer (iFRET) was calculated according to the following equation: iFRET=CFP/(YFP-CFP*0.357) (Shafer et al., 2008). Thereby, CFP and YFP are background corrected raw fluorescence data, and 0.357 was determined as the fraction of CFP spillover into the YFP channel in our imaging setup, which had to be subtracted from YFP fluorescence. Finally, iFRET traces of individual neurons were normalized to baseline levels and averaged for each treatment. For quantification and statistical comparison of response amplitudes of each treatment or genotype, maximum iFRET changes were determined for individual neurons.
Ex vivo patch-clamp electrophysiology
Three- to 9-d-old female flies were anesthetized with a brief incubation of the vial on ice, and brain dissection was performed in external recording solution, which consisted of the following (in mm): 101 NaCl, 3 KCl, 1 CaCl2, 4 MgCl2, 1.25 NaH2PO4, 5 glucose, and 20.7 NaHCO3, pH 7.2, with an osmolarity of 250 mmol/kg (based on the saline solution used by Cao and Nitabach, 2008). After removal of the proboscis, air sacks, and head cuticle, the brain was routinely glued ventral side up to a SYLGARD-coated coverslip using a few microliters of tissue adhesive Vetbond (3M). The time from anesthesia to the establishment of the recordings was ∼20 min, which was spent as follows: l-LNvs were visualized by red fluorescence in Pdf-RFP flies (which express a red fluorophore under the Pdf promoter, Ruben et al., 2012) using an Olympus BX51WI upright microscope with 60× water-immersion lens, and ThorLabs LEDD1B and TK-LED (TOLKET S.R.L) illumination systems. Once the fluorescent cells were identified, cells were visualized under IR-DIC using a DMK23UP1300 Imaging Source camera and IC Capture 2.4 software. l-LNvs were distinguished from s-LNvs by their size and anatomic position. To allow access of the recording electrode, the superficial glia directly adjacent to l-LNvs somas were locally digested with protease XIV solution (10 mg/ml; P5147, Sigma-Aldrich) dissolved in external recording solution. This was achieved using a large opened tip (∼20 µm) glass capillary (pulled from glass of the type FG-GBF150-110–7.5; Sutter Instrument) and gentle massage of the superficial glia with mouth suction to render the underlying cell bodies accessible for the recording electrode with minimum disruption of the neuronal circuits. After this procedure, protease solution was quickly washed by the perfusion of external solution. Recordings were performed using thick-walled borosilicate glass pipettes (FG-GBF150-86–7.5, Sutter Instrument) pulled to 7–8 MΩ using a horizontal puller P-97 (Sutter Instrument) and fire polished to 9–12 MΩ. Recordings were made using a Multiclamp 700B amplifier controlled by pClamp 10.4 software via an Axon Digidata 1515 analog-to-digital converter (Molecular Devices). Recording pipettes were filled with internal solution containing the following (in mm): 102 potassium gluconate, 17 NaCl, 0.085 CaCl2, 0.94 EGTA, and 8.5 HEPES, pH 7.2, with an osmolarity of 235 mmol/kg (based on the solution used by Cao and Nitabach, 2008). Gigaohm seals were accomplished using minimal suction followed by break-in into the whole-cell configuration using gentle suction in voltage-clamp mode with a holding voltage of −60 mV. Gain of the amplifier was set to 1 during recordings, and a 10 kHz low-pass filter was applied throughout. Spontaneous firing was recorded in current clamp (I = 0) mode. Analysis of traces was conducted using Clampfit 10.4 software. For action potential firing rate calculation, the event detection tool of Clampfit 10.4 was used. Perfusion of external saline in the recording chamber was achieved using a peristaltic pump (catalog #ISM831, ISMATEC). After 3 min of recording basal conditions, 10 ml of dopamine (1 mm) prepared in external saline was perfused over ∼3 min. Dopamine was then washed out with external saline perfusion during 10 min. For the basal condition, the number of action potentials on the last minute before dopamine application was counted. For the dopamine condition, the number of action potentials was counted on the last minute of dopamine perfusion. For the washout condition, the number of action potentials was counted on the last minute of the recording. In all cases, the firing rate, in hertz, was calculated by dividing the number of action potentials over 60 s. The membrane potential was assessed during the same periods for each condition. All recordings were performed during the time range of ZT6 to ZT9.
Recording of sleep and activity
The locomotor activity of male 3- to 7-d-old flies was recorded as described previously (Hermann-Luibl et al., 2014) using Drosophila Activity Monitors by TriKinetics. The fly tubes were fixed by a Plexiglas frame in such a way that the infrared beam crossed each fly tube at a distance of ∼3 mm from the food. The food consisted of 4% sugar in agar. For the gene-switch experiments, RU486 (mifepristone, Sigma-Aldrich) was dissolved in 80% ethanol and mixed with the food to a final concentration of 200 mg/ml. In the controls, the same amount of ethanol (vehicle) was added to the food. Flies were monitored for 9 d in 12 h LD cycles with a light intensity of 100 lux at 20°C and then were released into constant darkness (DD). Recording days 3–7 in LD phases were used for sleep and activity analysis.
Sleep analysis was performed with a custom-made Excel macro (Gmeiner et al., 2013; Hermann-Luibl et al., 2014), which included functions for calculating the number of sleep bouts and average sleep bout durations for day and night. Sleep was defined as the occurrence of 5 consecutive recording minutes without interruption of the infrared beam within the TriKinetics monitor. For average daily sleep profiles, sleep was calculated in 1 h bins and averaged over the 5 selected days for each single fly and genotype. Furthermore, the total amount of sleep was averaged over the 5 d, as well as the amount of sleep during the light phase and the dark phase. The Excel macro also counted the number of sleep bouts during light and dark phases of each day and calculated the average number of sleep bouts over the 5 d. The average sleep bout durations during light and dark phases were calculated by dividing the amount of sleep by the number of sleep bouts in each period. Every experiment was repeated at least twice, and at a minimum 29 flies of each genotype were used for the analysis.
The same 5 d of recordings used for sleep evaluation were also analyzed for fly activity. Daily average activity profiles were calculated for each fly as described in the study by Schlichting and Helfrich-Förster (2015). From these, the total activity (number of infrared beam crosses) of every fly during the entire day, the dark phase and the light phase, were calculated and plotted for each genotype. An activity index (the average of beam crosses per active minute) was also calculated but not shown, since it correlated with the total activity. The free-running period of each fly was determined from the recordings in DD to judge whether downregulating the dopamine receptors changed the speed of the circadian clock.
Statistics
Statistical analyses of sleep and activity data were performed using the R environment (version 3.5.3). Data were tested for normal distribution with a Shapiro–Wilk normality test (p > 0.05). If any group of the comparison was not normally distributed, the whole comparison was handled as not normally distributed. In this case, the Mann–Whitney U test was used. A t test was used for normally distributed data in case of variance homogeneity (Levene's test, p > 0.05), otherwise a Welch t test was performed. For correction of multiple comparisons, a Bonferroni correction was used. Period length was tested for statistically significant influences of dopamine receptor RNAi and RU treatment by a two-way ANOVA followed by a post hoc test with Bonferroni correction. Statistical tests on live imaging data were also done with the R environment. We compared the Epac1-camps inverse FRET ratio between vehicle and test compounds and used the Wilcoxon signed-rank test with Bonferroni correction for multiple comparisons of maximum changes. Exceptions are stated in the figure legends. Electrophysiological data (membrane potential and firing rate) was analyzed with the Kruskal–Wallis nonparametric test, where the α parameter was 0.05 and the post hoc test used the Fisher's least significant difference criterion. A Bonferroni correction was applied as the adjustment method.
Results
Dopaminergic neurons are presynaptic to the ventrolateral clock neurons (l-LNvs and s-LNvs) that arborize in the accessory medulla
The AME of Drosophila can be subdivided into the following two parts: a central part and a ventral elongation (Fig. 1). Whereas the central part is innervated by several clock neurons including the PDF-positive s-LNvs, the ventral elongation receives fibers only from the l-LNvs (Helfrich-Förster et al., 2007; Schubert et al., 2018). Previous studies already suggested that the PDF fibers in the ventral elongation of the AME are predominantly postsynaptic (of dendritic nature; Helfrich-Förster et al., 2007) and in close vicinity to dopaminergic fibers (Shang et al., 2011; Fig. 1a), but whether the dopaminergic fibers were of presynaptic nature was unclear. By expressing the vesicle marker Synaptotagmin (SytI/II)::GFP in the TH-Gal4-positive (dopaminergic) neurons and the postsynaptic marker Dscam::GFP in the Pdf-Gal4-positive neurons, we show here that this is indeed the case (Fig. 1). Prominent SytI/II::GFP staining was present in TH-Gal4-positive fibers that are aligned along the ventral elongation (Fig. 1c), and Dscam::GFP was strongly localized in the PDF fibers of the entire ventral elongation of the AME (Fig. 1d). Using GRASP imaging, we confirmed previous results that PDF-positive and TH-Gal4-positive fibers have contact in the central part of the AME and its ventral elongation (Shang et al., 2011): reconstituted GFP signals were present in both parts of the AME (Fig. 1b), whereas no reconstituted GFP signals were detected in control flies. In summary, we show here that the dopaminergic neurons are presynaptic to the l-LNvs and s-LNvs.
Figure 1.

Dopaminergic neurons are presynaptic to the LNvs. Staining of whole-mount brains showing the spatial vicinity of dopaminergic neurites (visualized with TH-Gal4) and neurites from the PDF-positive LNvs in the accessory medulla of one hemisphere. All pictures are overlays of 2-µm-thick confocal stacks. a, Medulla (ME) and AME labeled with anti-PDF (magenta) and anti-GFP (TH-Gal4;UAS-10xmyrGFP, green; overlay of 10 confocal stacks). TH-Gal4 and PDF overlap in the central part (CE) and ventral elongation (VE) of the AME. l-LNvs, PDF-positive large ventrolateral neurons; s-LNvs, PDF-positive small ventrolateral neurons. b, GRASP between Pdf-Gal4 neurons and TH-Gal4 neurons. GRASP signals are found in the CE and VE of the AME (overlay of six confocal sections). c, Expression of the presynaptic marker Synaptotagmin::GFP (SytI/II::GFP) in the TH-Gal4 neurons (GFP; green) and costaining against PDF (magenta; overlay of three confocal stacks). GFP-positive vesicles (arrowheads) are present along the PDF-positive fibers in the VE. d, Expression of the postsynaptic marker Dscam::GFP (green) in the Pdf-Gal4-positive l-LNvs and costaining with anti-PDF (magenta; overlay of three confocal stacks). The PDF-positive fibers in the VE of the AME are predominantly dendritic. Scale bars: a, b, 20 µm; c, d, 10 µm.
Dopamine signals to different clock neurons
It was shown previously that dopamine application to isolated brains elevates cAMP levels in the l-LNvs (Shang et al., 2011). We confirmed this result and extended it to the other clock neurons that have arborizations in the central part of the AME: the s-LNvs, the dorsolateral neurons (LNds), and the anterior dorsal neurons 1 (DN1as; Helfrich-Förster et al., 2007; Schubert et al., 2018). The l-LNvs showed the strongest responses to dopamine, which were even higher after blocking synaptic transmission by TTX, suggesting that inhibitory signals from other interneurons usually reduce the cAMP response to dopamine (Fig. 2a). Significant responses to dopamine that persisted under TTX were also present in the LNds (Fig. 2b) and the DN1s (Fig. 2c). The s-LNvs also exhibited significantly increased cAMP levels after dopamine application; but these cells are hard to image, because they are very small and often located underneath the l-LNvs, so that their responses cannot be unequivocally separated from those of the l-LNvs. Therefore, we could only image a few of them without the application of TTX (Fig. 3). The results of all statistical comparisons are shown in Table 1.
Figure 2.

Ex vivo live-cAMP imaging on Drosophila clock neurons. a–c, Mean inverse FRET traces of l-LNv, LNd and DN1 clock neurons of clk856> Epac1 flies. Error bars (gray) represent SEM, and short black bars indicate application of the different solutions: HL3 = buffer (negative control), DA (= 1 mm dopamine), DA+TTX (= 1 mm DA + 2 μm tetrodotoxin), and SKF38393 (= 0.1 mm Dop1R1-agonist), respectively. d–f, Quantification of maximum inverse FRET changes for each single neuron (dots in box plots) of each treatment. Black horizontal lines in the box plots represent the median; responses that were significantly different from each other are labeled by different letters and conditions that share letter designations are not significantly different (Table 1, p values). Cells of all three neuronal clusters respond with robust and significant increases in cAMP levels on application of DA and DA+TTX compared with negative controls, indicating a direct neuronal connection between dopaminergic neurons and clock neurons. Application of the Dop1R1 agonist SKF also significantly increased cAMP levels in all three clusters of clock neurons (f).
Figure 3.
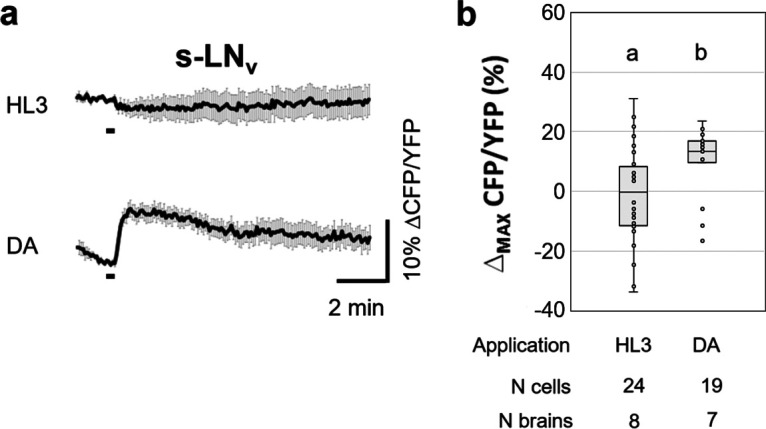
Ex vivo live cAMP imaging on Drosophila s-LNv neurons. a, Mean inverse FRET traces of s-LNv clock neurons of clk856>Epac flies. Error bars (gray) represent the SEM, and short black bars indicate the application of a negative control (HL3) or 1 mm dopamine (DA). b, Quantification of maximum inverse FRET changes for each single neuron (dots in box plots) of each treatment. Black horizontal lines in the box plots represent the median, and different letters indicate significant differences (Table 1, p values). s-LNvs significantly responded to DA with an increase in cAMP. In this case, the Mann–Whitney U test was used for pairwise comparison of maximum changes.
Table 1.
Statistical comparison of cAMP increase in the different clock neurons of clk856>Epac1 flies after adding of buffer (HL3), DA, DA + TTX or the Dop1R1 agonist SKF38393
| Comparison | l-LNv | LNd | DN1 | s-LNv |
|---|---|---|---|---|
| HL3 vs DA | p = 0.0001221 | p = 0.0060920 | p = 0.0000582 | p = 0.0128000 |
| HL3 vs DA + TTX | p = 0.0000005 | p = 0.0000082 | p = 0.0060920 | - |
| HL3 vs SKF38393 | p = 0.0000916 | p = 0.0003560 | p = 0.0143560 | - |
| DA vs DA + TTX | p = 0.0003052 | p = 0.6420000 | p = 0.4020000 | - |
| DA vs SKF38393 | p = 0.0002442 | p = 0.9804000 | p = 0.0199200 | - |
| DA + TTX vs SKF38393 | p = 0.0001221 | p = 0.0099200 | p = 0.0714000 | - |
Next, we tested whether these cAMP responses were mediated by Dop1R1 or Dop1R2. Knockdown of Dop1R1 by RNAi in all clock neurons reduced cAMP responses in the l-LNvs (Fig. 4a,d), the DN1s (Fig. 4c,f), and the LNds (Fig. 4b,e), whereas the downregulation of Dop1R2 appeared to reduce cAMP levels in all neuron clusters slightly but not significantly (Fig. 4a–c). Notably, the cAMP signals in the LNds were quite variable when Dop1R1 or Dop1R2 were downregulated; some neurons still responded to dopamine, while others did not (Fig. 4e). The same applies for the DN1s knockdown of Dop1R1; half of the cells responded, the other half did not (Fig. 4f). However, with knockdown of Dop1R2, only two of the measured 22 DN1 cells did not respond to dopamine (Fig. 4f). Altogether, this suggests that some LNds and DN1s express Dop1R1 and others Dop1R2. Consistent with this hypothesis, the simultaneous downregulation of Dop1R1 and Dop1R2 abolished the responses to dopamine in all evaluated neurons (Fig. 4). Downregulation of the inhibitory dopamine receptor D2R, slightly increased the responses to dopamine in the l-LNvs (Fig. 4a,d) and the LNds (Fig. 4b,e); but, in contrast to a previous study (Shang et al., 2011), this increase was not significant. The results of all statistical comparisons are shown in Table 2. Though our data indicate that Dop1R1 and Dop1R2 downregulation reduced the receptivity to dopamine, we addressed the extent of knockdown produced by our UAS-RNAi experiments by examining the levels of dopamine receptor expression using qPCR in control brains and after Dop1R1 and Dop1R2 receptor knockdown in all neurons. We found that the expression of Dop1R2 mRNA is ∼20–30 times higher than that of Dop1R1 and that the downregulation was effective in both cases (Fig. 5a). Whether DopR1 and DopR2 protein levels mirror these large differences in mRNA levels will require further analysis. To make sure that the neurons maintained their ability to increase cAMP levels in our experimental lines, we measured cAMP levels in response to NKH477, an adenylyl cyclase activator, and found that they all responded (Fig. 5b,c).
Figure 4.

Ex vivo live cAMP imaging on Drosophila clock neurons expressing RNAi constructs against different dopamine receptors. a–c, Mean inverse FRET traces of l-LNv, LNd, and DN1 clock neurons of clk856>dicer2, Epac1, and XRNAi flies. The X stands for “wild-type” (+) or the following relevant dopamine receptor RNAi lines: R1, Dop1R1RNAi; R2, Dop1R2RNAi; D2R, D2RRNAi; and R1/R2, Dop1R1RNAi/Dop1R2RNAi. Error bars (gray) represent SEM, and short black bars indicate the application of negative control (HL3) or 1 mm dopamine (DA). d–f, Quantification of maximum inverse FRET changes for each single neuron (dots in box plots) of each treatment. Black horizontal lines in the box plots represent the median; responses that were significantly different from each other are labeled by different letters and conditions that share letter designations are not significantly different (Table 2, p values). l-LNv and DN1 neurons responded significantly to the application of DA, except when Dop1R1s or Dop1R1/R2s were knocked down. Responses of the LNd were not different from negative controls when Dop1R1, or Dop1R2, or both (Dop1R1/R2) were knocked down.
Table 2.
Statistical comparison of cAMP increase in the different clock neurons after dopamine receptor knockdown and adding of buffer (HL3) or DA
| Comparison | l-LNv | LNd | DN1 |
|---|---|---|---|
| HL3 vs DA | p = 0.0058596 | p = 0.0029298 | p = 0.0009156 |
| HL3 vs DA + Dop1R1 knockdown | p = 0.0610160 | p = 1.0000000 | p = 1.0000000 |
| HL3 vs DA + Dop1R2 knockdown | p = 0.0058596 | p = 0.0937800 | p = 0.0025632 |
| HL3 vs DA + D2R knockdown | p = 0.0058596 | p = 0.0205080 | p = 0.0001831 |
| HL3 vs DA + Dop1R1/Dop1R2 knockdown | p = 0.0058596 | p = 1.0000000 | p = 1.0000000 |
| DA vs DA + Dop1R1 knockdown | p = 0.0000229 | p = 1.0000000 | p = 0.0004006 |
| DA vs DA + Dop1R2 knockdown | p = 0.3281400 | p = 0.0937800 | p = 1.0000000 |
| DA vs DA + D2R knockdown | p = 1.0000000 | p = 1.0000000 | p = 1.0000000 |
| DA vs DA + Dop1R1/Dop1R2 knockdown | p = 0.0000004 | p = 0.0405800 | p = 0.0000185 |
| Dop1R1 vs Dop1R2 knockdown | p = 0.0003205 | p = 1.0000000 | p = 0.0332520 |
| Dop1R1 vs D2R knockdown | p = 0.0000916 | p = 1.0000000 | p = 0.0021228 |
| Dop1R1 vs Dop1R1/Dop1R2 knockdown | p = 1.0000000 | p = 1.0000000 | p = 1.0000000 |
| Dop1R2 vs D2R knockdown | p = 0.1393200 | p = 0.1875000 | p = 1,0000000 |
| Dop1R2 vs Dop1R1/Dop1R2 knockdown | p = 0.0014478 | p = 0.1875000 | p = 0.0003147 |
| D2R vs Dop1R1/Dop1R2 knockdown | p = 0.0000916 | p = 0.0256320 | p = 0.0000014 |
The p values were revealed by the Wilcoxon signed-rank test after Bonferroni's correction (results shown in Fig. 4). DA, Dopamine.
Figure 5.

qPCR analysis of whole heads and ex vivo live cAMP imaging on Drosophila clock neurons expressing RNAi constructs against different dopamine receptors (clk856>dicer2,Epac1;Dop1RXRNAi flies). a, Relative mRNA expression of Dop1R1 (light gray) and Dop1R2 (dark gray) in the heads of elav-Gal4-driven Dop1R1 and Dop1R2 RNAi flies and their respective controls relative to the reference expression of α-tubulin. In control flies, the Dop1R2 mRNA expression is ∼20–30 times higher than that of Dop1R1 mRNA. In both cases, flies of elav-Gal4>RNAi crosses show a clear reduction of the corresponding mRNA compared with their control flies (Dop1R1-RNAi: ∼50%, Dop1R2-RNAi: ∼75%). b, Mean inverse FRET traces of l-LNv clock neurons with downregulated Dop1R1 (Dop1R1RNAi). The same set of neurons (five neurons from two brains) was first subject to 1 mm dopamine (DA) application showing no response and afterward to the application of 10 μm of the adenylate cyclase activator NKH477, which evoked an increase in cAMP. c, Mean inverse FRET traces of the same l-LNv, LNd, and DN1 clock neurons shown in Figure 4a–c (bottom) expressing DopR1RNAi/DopR2RNAi after application of NKH477. Error bars (gray) represent the SEM, and short black bars indicate the application of a negative control (HL3) or 1 mm DA.
In summary, our results show that the responses to dopamine are predominantly mediated by Dop1R1s in the l-LNvs and DN1s and by Dop1R1s and Dop1R2s in the LNds. As described above, we could not identify the relevant Dop1Rs of the s-LNvs, because these cells were hidden by the l-LNvs or just located too close to them, which prevented a successful imaging in all the preparations with downregulated Dop1Rs.
Effects of Dop1R1 and Dop1R2 downregulation in the clock neurons on sleep
To study the consequences of reduced dopamine signaling in the LNv clock neurons on sleep, we first downregulated the activating Dop1R1s and Dop1R2s in all clock neurons (using Clk856-Gal4). We did not see any significant changes in sleep pattern (Fig. 6a), total sleep, or sleep during day and night, or on sleep bout duration or the number of sleep bouts (Fig. 6b) with downregulation of each of the receptors alone or downregulation of both receptors simultaneously (Table 3, statistical comparisons). However, the downregulation of Dop1R2 significantly reduced activity levels during the day and increased it during the night (Fig. 6c,d, Table 3). A tendency toward lower activity during the day was also seen for the downregulation of the two dopamine receptors simultaneously; however, the experimental line was only significantly different from the Clk-Gal4 control (Table 3). We judge the effects of the knockdown as significant only when the experimental line was significantly different from both parental controls and when the change in behavioral parameter was in the same direction. The free-running period in DD did not change when dopamine receptors were knocked down, and only the power of the rhythm was decreased slightly by knockdown of both dopamine receptors simultaneously (Table 4).
Figure 6.
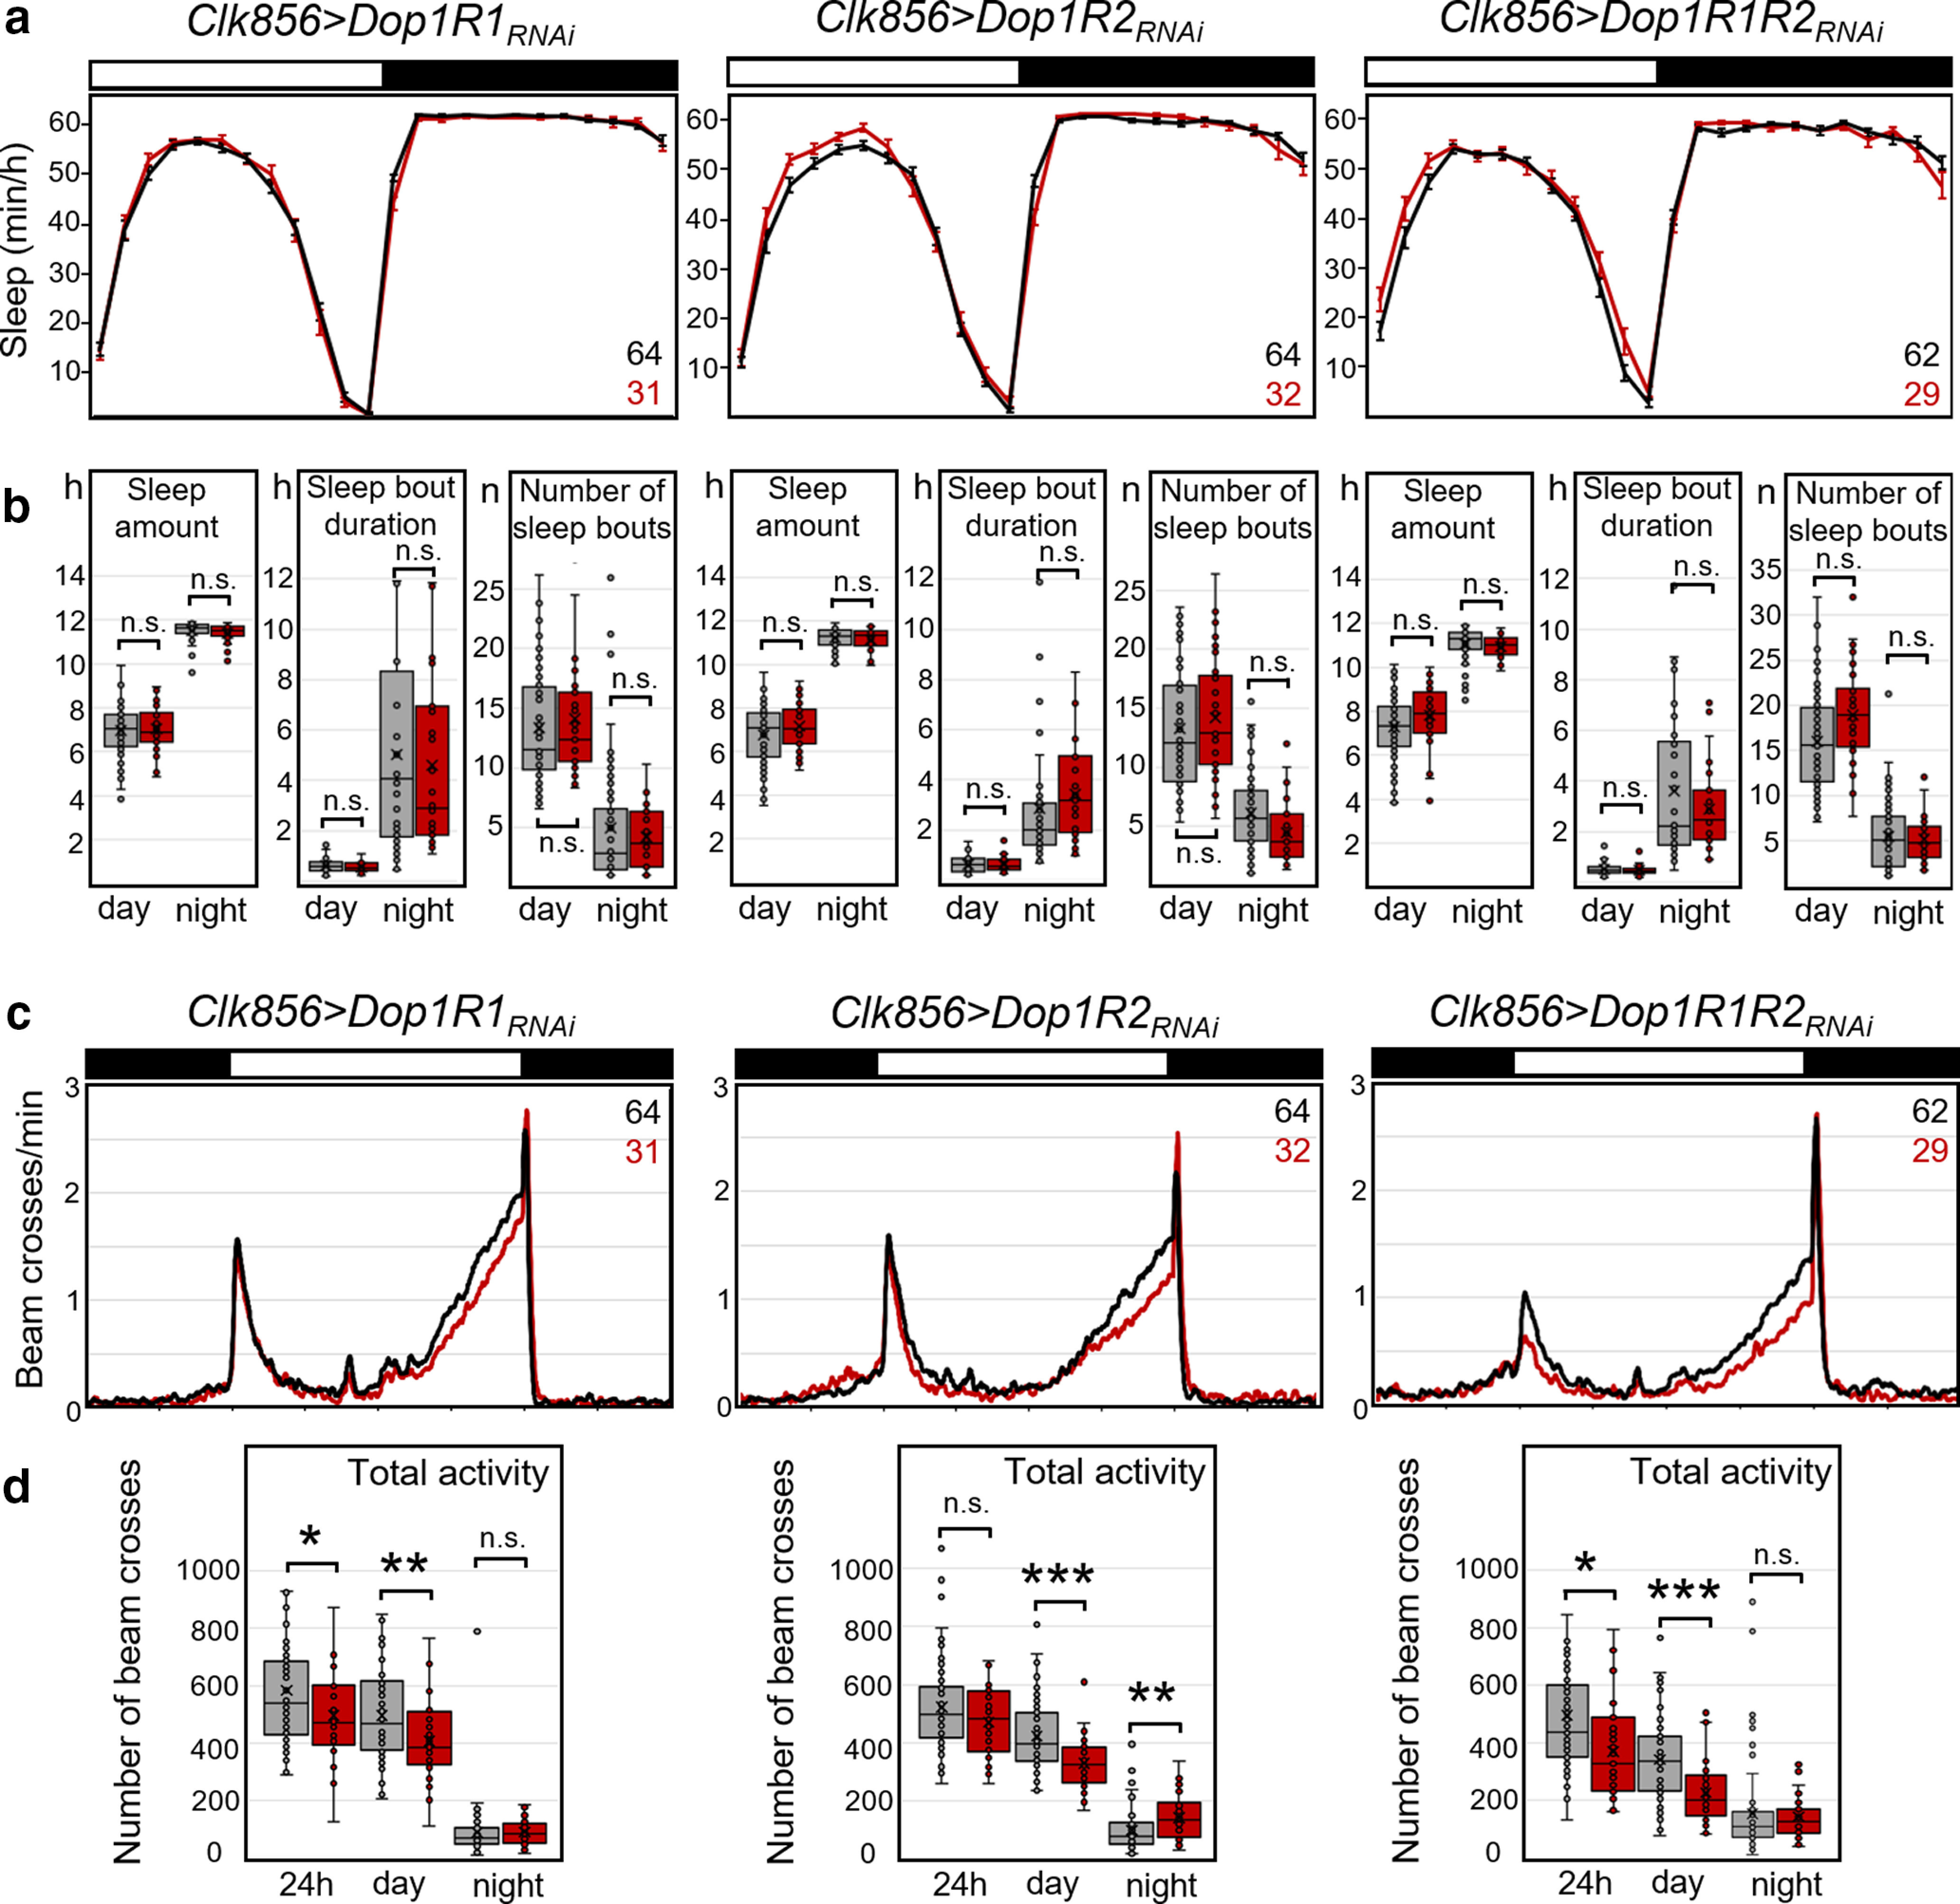
Sleep and activity in clock neuron-specific dopamine receptor knockdown flies. Dop1R1, Dop1R2, or both were knocked down using clk856-Gal4. a, Average daily sleep profiles of experimental flies (red plus error bars, clk856>Dop1RRNAi) and respective Gal4 and UAS controls (gray). To facilitate comparison, both controls were additionally pooled (black line with error bars). b, Box plots of sleep parameters (total sleep in hours, sleep bout duration, and number of sleep bouts during the day and the night; same color code as in a). The median, upper, and lower quartiles as well as upper and lower extremes plus the single data points are plotted. No significant differences were observed between experimental flies and controls in any of the three cases (Table 3, p values). c, Average activity profiles of the same flies that are depicted in a (same color code). The flies with downregulated dopamine receptors were always less active during the day compared with the controls, but this was only significantly different from both parental controls in the case of Dop1R2 knockdown. Dop1R2 knockdown additionally increased activity during the night. d, Box plots of total activity during the day and the night. Significant differences are indicated by asterisks (*p < 0.05; **p < 0.01; ***p < 0.001); for p values, see Table 3; the asterisks indicate the significance level relative to that control that was closest to the experimental line values. The numbers of tested flies are indicated in a and c. n.s., not significant.
Table 3.
Statistical comparison of sleep and activity parameters between control flies and flies with dopamine receptors downregulated in all clock neurons (clk856>) or specifically in the PDF neurons (pdf>)
| Comparison | Clk856> |
Pdf> |
||
|---|---|---|---|---|
| Day | Night | Day | Night | |
| Sleep amount | ||||
| UAS control vs Dop1R1 knockdown | pt = 0.830909 | p = 0.045860 | p = 0.001255 | p = 0.038096 |
| Gal4 control vs Dop1R1 knockdown | pt = 0.541045 | p = 1.000000 | p = 0.000005 | p = 0.082467 |
| Pooled controls vs Dop1R1 knockdown | pt = 1.000000 | p = 0.376090 | p = 0.000005 | p = 0.015782 |
| UAS control vs Dop1R2 knockdown | pt = 0.757909 | p = 1.000000 | pt = 0.015660 | p = 0.000607 |
| Gal4 control vs Dop1R2 knockdown | pt = 0.260124 | p = 0.045215 | pwt = 0.000771 | p = 0.000003 |
| Pooled controls vs Dop1R2 knockdown | pt = 1.000000 | p = 1.000000 | pt = 0.000262 | p = 0.000002 |
| UAS control vs Dop1R1/Dop1R2 knockdown | pt = 1.000000 | p = 1.000000 | pt = 0.027734 | p = 0.001093 |
| Gal4 control vs Dop1R1/Dop1R2 knockdown | pt = 0.003439 | p = 0.000325 | pt = 0.000284 | p = 0.000003 |
| Pooled controls vs Dop1R1/Dop1R2 knockdown | pt = 0.787476 | p = 0.271963 | pt = 0.000667 | p = 0.000002 |
| Sleep bout duration | ||||
| UAS control vs Dop1R1 knockdown | p = 0.006072 | p = 0.619628 | pwt = 0.000024 | p = 1.000000 |
| Gal4 control vs Dop1R1 knockdown | p = 0.191122 | p = 1.000000 | pwt = 0.000004 | p = 0.980243 |
| Pooled controls vs Dop1R1 knockdown | p = 1.000000 | p = 1.000000 | pwt = 2.47E-08 | p = 1.000000 |
| UAS control vs Dop1R2 knockdown | p = 0.011435 | p = 1.000000 | p = 0.054402 | p =1.000000 |
| Gal4 control vs Dop1R2 knockdown | p = 0.217083 | p = 0.054546 | p = 0.032456 | p = 0.003028 |
| Pooled controls vs Dop1R2 knockdown | p = 1.000000 | p = 0.195421 | p = 0.012510 | p = 1.000000 |
| UAS control vs Dop1R1/Dop1R2 knockdown | p = 0.244778 | p = 1.000000 | p = 0.000940 | p = 0.000413 |
| Gal4 control vs Dop1R1/Dop1R2 knockdown | p = 1.000000 | p = 1.000000 | p = 0.000152 | p = 0.000010 |
| Pooled controls vs Dop1R1/Dop1R2 knockdown | p = 1.000000 | p = 1.000000 | p = 0.000042 | p = 0.000006 |
| Sleep bout number | ||||
| UAS control vs Dop1R1 knockdown | p = 0.058019 | p = 0.857326 | p = 0.001791 | p = 1.000000 |
| Gal4 control vs Dop1R1 knockdown | p = 1.000000 | p = 1.000000 | p = 0.003101 | p = 0.896752 |
| Pooled controls vs Dop1R1 knockdown | p = 1.000000 | p = 1.000000 | p = 0.000372 | p = 1.000000 |
| UAS control vs Dop1R2 knockdown | p = 0.034754 | p = 0.026511 | p = 0.805820 | p = 0.446833 |
| Gal4 control vs Dop1R2 knockdown | p = 1.000000 | p = 1.000000 | p = 1.000000 | p = 0.008647 |
| Pooled controls vs Dop1R2 knockdown | p = 1.000000 | p = 0.105451 | p = 0.764239 | p = 1.000000 |
| UAS control vs Dop1R1/Dop1R2 knockdown | pt = 0.361982 | p = 1.000000 | p = 0.007079 | p = 0.002326 |
| Gal4 control vs Dop1R1/Dop1R2 knockdown | pt = 0.197960 | p = 1.000000 | p = 0.004600 | p = 0.000103 |
| Pooled controls vs Dop1R1/Dop1R2 knockdown | pt = 0.117620 | p = 1.000000 | p = 0.001003 | p = 0.000031 |
| Amount of total activity | ||||
| UAS control vs Dop1R1 knockdown | pt = 0.000010 | p = 0.129185 | pt = 0.016181 | p = 0.044254 |
| Gal4 control vs Dop1R1 knockdown | pt = 1.000000 | p = 1.000000 | pt = 0.035930 | p = 0.197960 |
| Pooled controls vs Dop1R1 knockdown | pt = 0.013721 | p = 0.391287 | pt = 1.000000 | p = 0.044796 |
| UAS control vs Dop1R2 knockdown | p = 0.016065 | p = 0.005842 | pt = 0.007108 | p = 0.000381 |
| Gal4 control vs Dop1R2 knockdown | p = 0.008412 | p = 0.007950 | pt = 0.421417 | p = 0.000001 |
| Pooled controls vs Dop1R2 knockdown | p = 0.000243 | p = 0.007770 | pt = 0.029412 | p = 0.000001 |
| UAS control vs Dop1R1/Dop1R2 knockdown | p = 0.128325 | p = 0.553020 | pt = 1.000000 | p = 0.013274 |
| Gal4 control vs Dop1R1/Dop1R2 knockdown | p = 5.34E-08 | p = 0.004650 | pt = 1.000000 | p = 0.000003 |
| Pooled controls vs Dop1R1/Dop1R2 knockdown | p = 0.000102 | p = 0.522738 | pt = 1.000000 | p = 0.000044 |
Data were tested for normal distribution with a Shapiro–Wilk normality test (p > 0.05). A t test (pt) was used for normally distributed data in case of variance homogeneity (Levene's test, p > 0.05) otherwise a Welch's t test (pwt) was performed. If any group of the comparison was not normally distributed, the Mann–Whitney U test was used. Bonferroni's correction was used for multiple comparisons (results shown in Figs. 6, 7).
Table 4.
Rhythmic parameters of the free-running rhythms under DD
| Genotype | Rhythmic | Period (±SD) | Relative power (±SD) |
|---|---|---|---|
| UAS-dicer2;clk856-Gal4;UAS-Dop1R1RNAi | 94% | 23.82 ± 0.41 | 3950.63 ± 1145.38 |
| UAS-dicer2;clk856-Gal4;UAS-Dop1R2RNAi | 100% | 23.93 ± 0.40 | 4637.78 ± 1399.28 |
| UAS-dicer2;clk856-Gal4;UAS-Dop1R1R2RNAi | 84% | 23.83 ± 0.44 | 2687.00 ± 772.08* |
| UAS-dicer2;clk856-Gal4 | 97% | 24.03 ± 0.46 | 3709.97 ± 1146.97 |
| UAS-dicer2;Pdf-Gal4;UAS-Dop1R1RNAi | 97% | 23.93 ± 0.33 | 6496.61 ± 1652.04 |
| UAS-dicer2;Pdf-Gal4;UAS-Dop1R2RNAi | 97% | 24.09 ± 0.41 | 5315.03 ± 2031.54 |
| UAS-dicer2;Pdf-Gal4;UAS-Dop1R1R2RNAi | 97% | 24.00 ± 0.31 | 3752.74 ± 1485.88 |
| UAS-dicer2;Pdf-Gal4 | 100% | 24.31 ± 0.34 | 6966.94 ± 1699.23 |
| UAS-dicer2;;UAS-Dop1R1RNAi | 100% | 23.70 ± 0.42 | 4812.78 ± 1702.03 |
| UAS-dicer2;;UAS-Dop1R2RNAi | 100% | 23.75 ± 0.26 | 4198.81 ± 1351.07 |
| UAS-dicer2;;UAS-Dop1R1R2RNAi | 100% | 23.66 ± 0.34 | 4135.06 ± 1298.63 |
| UAS-dicer2;Pdf-GS;UAS-Dop1R1RNAi + Eth | 100% | 23.74 ± 0.35 | 2833.94 ± 720.94 |
| UAS-dicer2;Pdf-GS;UAS-Dop1R1RNAi + RU | 100% | 24.18 ± 0.54** | 2668.28 ± 365.25 |
| UAS-dicer2;Pdf-GS;UAS-Dop1R2RNAi + Eth | 94% | 23.84 ± 0.34 | 3886.97 ± 978.24 |
| UAS-dicer2;Pdf-GS;UAS-Dop1R2RNAi + RU | 97% | 24.87 ± 0.52** | 2865.97 ± 461.19 |
| UAS-dicer2;Pdf-GS + Eth | 100% | 23.76 ± 0.24 | 4120.34 ± 715.72 |
| UAS-dicer2;Pdf-GS + RU | 100% | 24.46 ± 0.42** | 4332.97 ± 894.48 |
| UAS-dicer2;;UAS-Dop1R1RNAi + Eth | 100% | 23.84 ± 0.34 | 3686.97 ± 978.24 |
| UAS-dicer2;;UAS-Dop1R1RNAi + RU | 100% | 23.89 ± 0.25 | 3608.44 ± 830.90 |
| UAS-dicer2;;UAS-Dop1R2RNAi + Eth | 100% | 23.81 ± 0.30 | 3433.91 ± 859.93 |
| UAS-dicer2;;UAS-Dop1R2RNAi + RU | 100% | 23.81 ± 0.36 | 3526.28 ± 582.67 |
*Significant differences (p < 0.05) in power between flies with downregulated dopamine receptors in all clock neurons in comparison to the relevant controls.
**Highly significant differences (p < 0.01) after RU application in the Pdf-GS experiments.
Since among all clock neurons the s-LNvs and l-LNvs have been the ones with the most prominent role in sleep and arousal regulation, we decided to repeat Dop1R1 and Dop1R2 downregulation more specifically using the Pdf-Gal4 driver. The l-LNvs and s-LNvs collectively produce the first daily peak of wakefulness (Renn et al., 1999; Grima et al., 2004; Stoleru et al., 2004; Rieger et al., 2006; Potdar and Sheeba, 2018; Liang et al., 2019), and the l-LNvs mediate light-driven arousal (Parisky et al., 2008; Shang et al., 2008; Sheeba et al., 2008a; Lebestky et al., 2009). We repeated Dop1R1 and Dop1R2 downregulation in these neurons using the Pdf-Gal4 driver. Once again, the general sleep pattern was not affected by the downregulation (Fig. 7a), but the amount of sleep was significantly reduced for downregulation of Dop1R1 and Dop1R2, and for the simultaneous downregulation of both receptors (Fig. 7b, Table 3). Closer inspection revealed that Dop1R1 downregulation reduced sleep significantly during the day, whereas Dop1R2 downregulation reduced sleep significantly both during the day and the night, as did the downregulation of both receptors simultaneously. In most cases, the reduction in sleep amount was caused by a significant shortening of sleep bout duration (Fig. 7b). For knockdown of Dop1R1 or simultaneous knockdown of Dop1R1 and Dop1R2, the number of sleep bouts was higher, but this increase did not compensate for total sleep loss. Thus, dopamine receptor knockdowns produced fragmented sleep.
Figure 7.
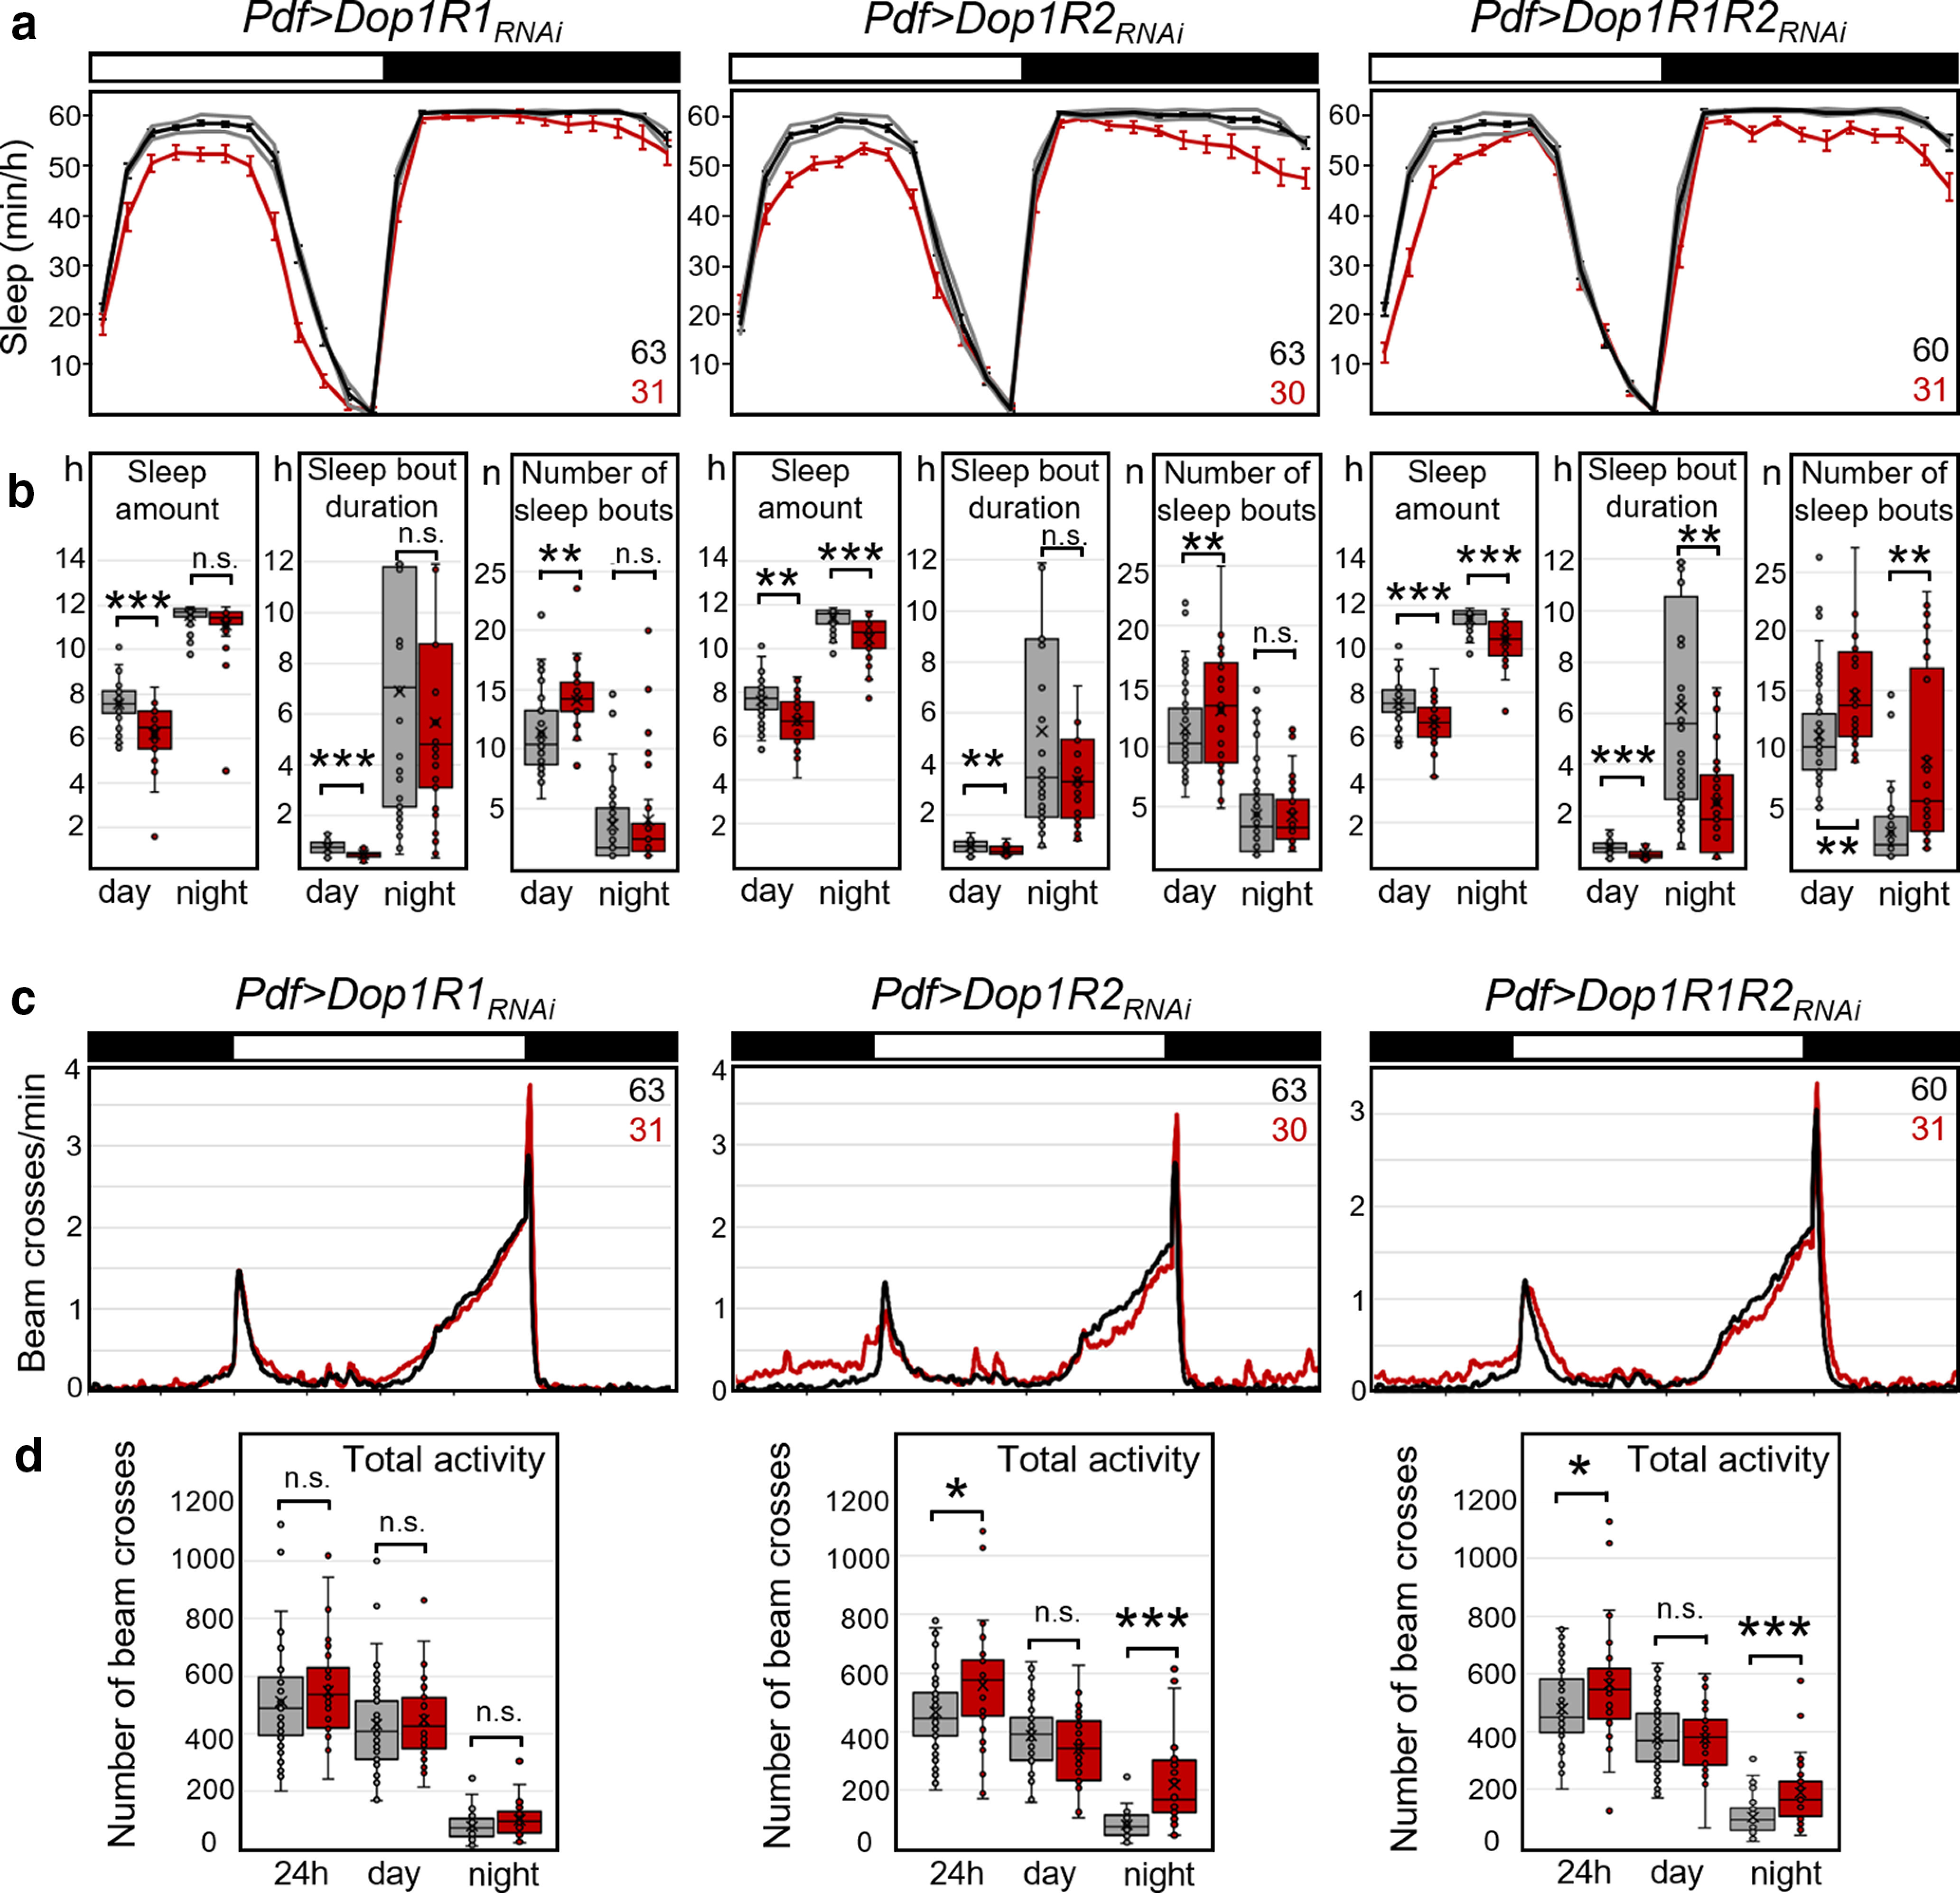
Sleep and activity in PDF neuron-specific dopamine receptor knock-down flies. Dop1R1, Dop1R2, or both were knocked down using Pdf-Gal4. a, Average daily sleep profiles of experimental flies (red, Pdf>Dop1RRNAi) and respective Gal4 and UAS controls (gray lines and pooled black line). Both controls showed significantly more sleep than the flies with dopamine receptor knockdown. b, Box plots of sleep parameters as shown in Figure 6. Flies showed significantly less sleep, and in several cases shorter sleep bouts, when Dop1R1, Dop1R2, or both were knocked down in the PDF neurons. Knockdown of Dop1R1 decreased daytime sleep, whereas knockdown of Dop1R2 and simultaneous knockdown of both receptors decreased day and nighttime sleep. After simultaneous knockdown of both dopamine receptors, the number of sleep bouts increased, but this did not compensate for the loss in sleep amount. c, Average activity profiles of the same flies that are depicted in a. The flies with downregulated Dop1R2 receptor and with simultaneously downregulated Dop1R1/Dop1R2s were more active in the night than the controls. d, Box plots of total activity during the day and the night. Significant differences are indicated by asterisks (*p < 0.05; **p < 0.01; ***p < 0.001); for p values, see Table 3. The numbers of tested flies are indicated in a and c. n.s., not significant.
The effects of dopamine receptor downregulation on activity levels were mixed. We did not observe any effects on daytime activity, but nighttime activity was slightly but significantly increased by Dop1R2 knockdown and knockdown of both receptors (Fig. 7c,d). We did not observe any effects on the period or the power of the free-running rhythms in DD (Table 4). In summary, these results suggest that reduction in dopamine signaling in the LNvs has no effect on the speed of the clock. However, dopamine signaling unexpectedly appears to increase sleep via Dop1R1s during the day and via Dop1R2s during the day and the night. These results should be treated with caution because they were achieved by constitutive knockdown of dopamine receptors, which may cause developmental effects.
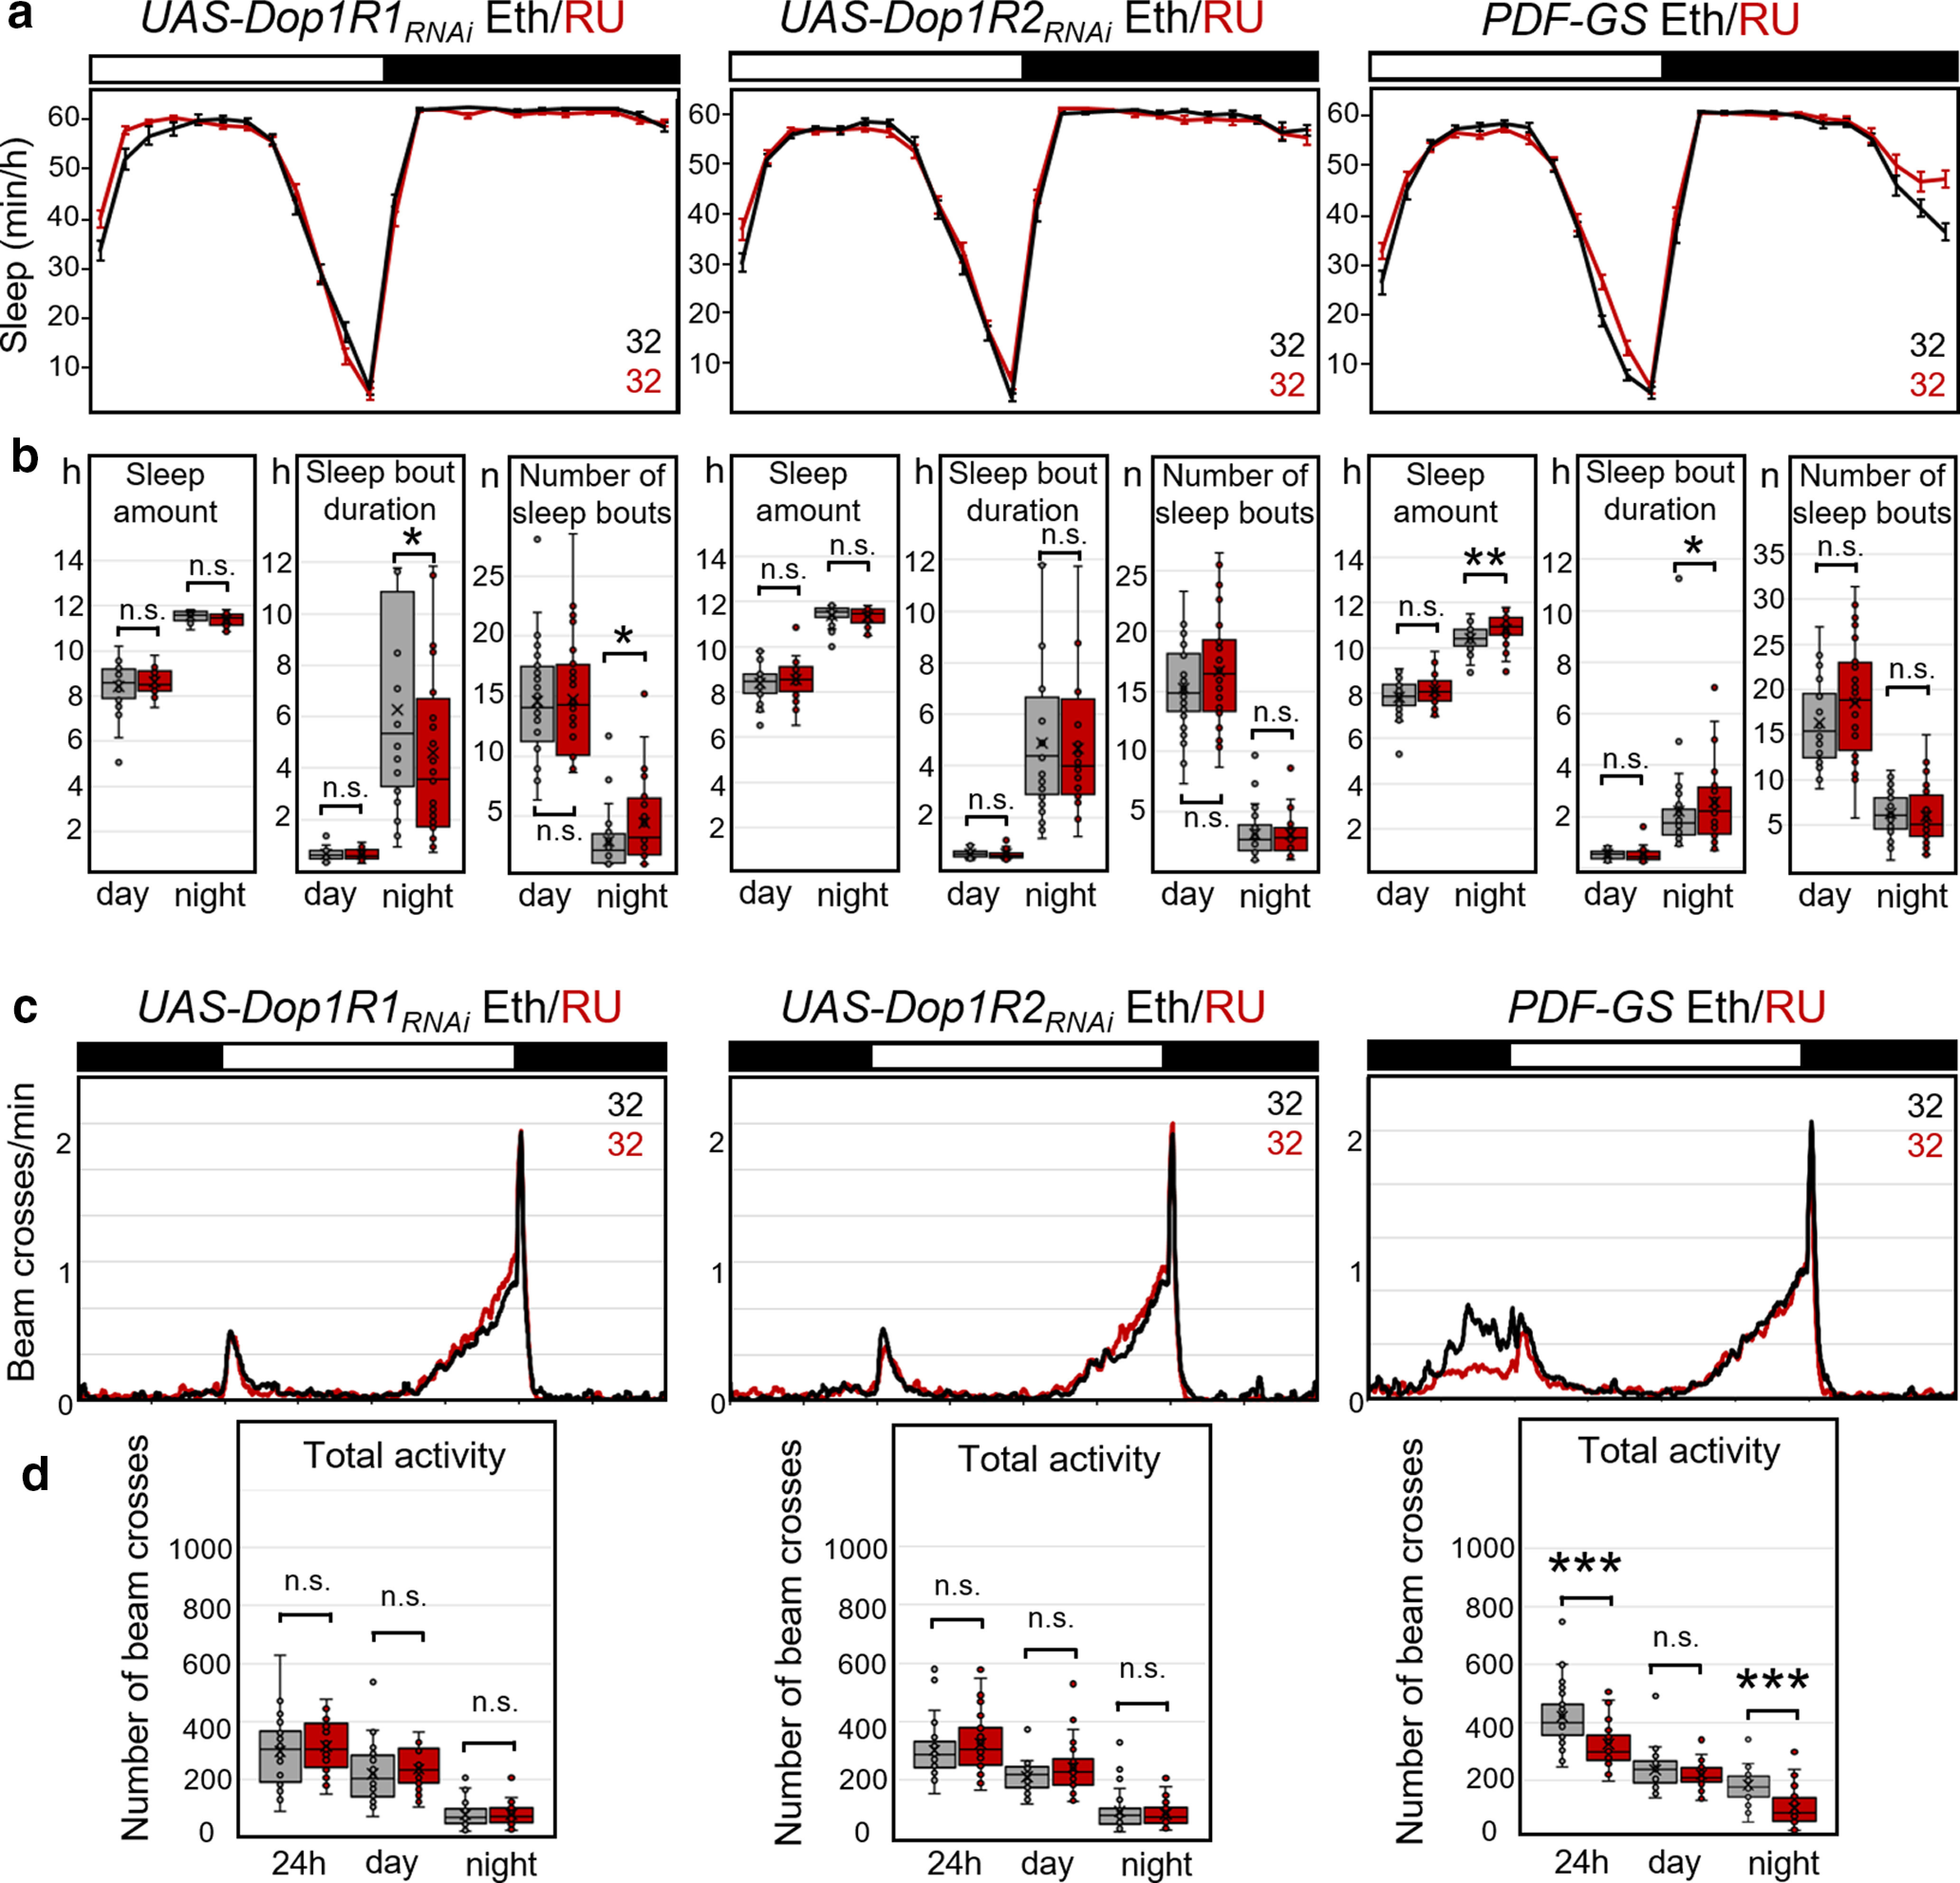
To assess possible developmental effects of Dop1R1 or Dop2R1 knockdown on the PDF neurons, we repeated our LNv knock-down experiments using GS (Depetris-Chauvin et al., 2011). Feeding flies the progesterone derivative RU (dissolved in ethanol) only during adulthood restricted the expression of RNAi constructs to the adult stage. We used two types of controls: (1) Pdf-GS and UAS-Dop1R-RNAi flies, in which the dopamine receptors were not downregulated and which were fed either with ethanol alone or with RU, served as controls for the effect of RU (Fig. 8); and (2) Pdf-GS>UAS-Dop1RNAi fed with ethanol alone served as controls for Pdf-GS>UAS-Dop1R-RNAi flies fed with RU (Fig. 9). Though we did not find any systematic difference in activity and sleep between the RU and ethanol-fed flies (Fig. 8, Table 5), the dopamine receptor knockdown clearly affected sleep (Fig. 9). Only in Pdf-GS controls did we find that nocturnal sleep was significantly increased and nocturnal activity was significantly decreased during the last few hours of the night after feeding RU (Fig. 8). In the experimental animals, the differences we observed between unconditional Dop1R2 knockdowns and controls during the day disappeared when this receptor was knocked down conditionally, suggesting that these were caused by developmental effects. Nevertheless, the significant reduction in daytime sleep caused by Dop1R1 knockdown and the reduction of night sleep after Dop1R2 knockdown were still seen with conditional knockdown using gene-switch (Fig. 9a,b, Table 5). Furthermore, the conditional knockdown of Dop1R1 receptors increased activity during the night (Fig. 9c,d, Table 5). Since the effects of conditional dopamine receptor downregulation were in the same direction as the constitutive receptor downregulation and in the opposite direction of RU feeding (Fig. 8) in Pdf-GS controls, we conclude that these are specific and indeed caused by downregulation of the dopamine receptors in the PDF neurons.
Figure 8.
Sleep and activity in control flies fed with RU dissolved in ethanol or only with ethanol. a, Average daily sleep profiles of flies fed with RU in ethanol (red) and flies fed only with ethanol (black). b, Box plots of sleep parameters. c, Average activity profiles of the same flies that are depicted in a. d, Box plots of total activity during the day and the night. Significant differences are indicated by asterisks (*p < 0.05; **p < 0.01; ***p < 0.001); for p values, see Table 3. Feeding of RU affected sleep amount and activity marginally. Only Pdf-Gal4 flies fed with RU slept significantly more and were less active in the night than flies fed only with ethanol. The numbers of tested flies are indicated in a and c. n.s., not significant.
Figure 9.

Sleep and activity in flies with conditional dopamine receptor knockdown in the PDF neurons (with Pdf-GS). a, Average daily sleep profiles of experimental flies (red, Pdf-GS>Dop1RRNAi fed with RU in ethanol) and control flies (black, Pdf-GS>Dop1RRNAi fed with ethanol). b, Box plots of sleep parameters. Flies showed significantly less total sleep when Dop1R1, Dop1R2, or both were knocked down in the PDF neurons. The knockdown of Dop1R1 decreased daytime sleep, whereas the knockdown of Dop1R2 decreased nighttime sleep. In both cases, this happened via a reduction in sleep bout duration. The number of sleep bouts was only significantly affected after the knockdown of the Dop1R2 receptor. c, Average activity profiles of the same flies that are depicted in a. The flies with downregulated dopamine receptors were generally more active than the controls, but this turned out to be significant only in the night for Dop1R1 knockdown. d, Box plots of total activity during the day and the night. Significant differences are indicated by asterisks (*p < 0.05; **p < 0.01; ***p < 0.001); for p values, see Table 5. The numbers of tested flies are indicated in a and c. n.s., not significant.
Table 5.
Statistical comparison of sleep and activity parameters between control flies and flies with conditional dopamine receptor downregulation in the pdf neurons (Pdf-GS)
| Comparison | Day | Night |
|---|---|---|
| Sleep amount | ||
| UAS-Dop1R1RNAi control Eth vs RU | p = 1.000000 | p = 0.141903 |
| UAS-Dop1R2RNAi control Eth vs RU | pt = 1.000000 | p = 1.000000 |
| Pdf-GS control Eth vs RU | pt = 0.661597 | p = 0.010374 |
| Pdf-GS>UAS-Dop1R1RNAi Eth vs RU | p = 0.000940 | p = 1.000000 |
| Pdf-GS>UAS-Dop1R2RNAi Eth vs RU | pt = 1.000000 | pwt = 0.001652 |
| Sleep bout duration | ||
| UAS-Dop1R1RNAi control Eth vs RU | pt = 1.000000 | p = 0.171722 |
| UAS-Dop1R2RNAi control Eth vs RU | p = 1.000000 | p = 1.000000 |
| Pdf-GS control Eth vs RU | p = 1.000000 | p = 1.000000 |
| Pdf-GS>UAS-Dop1R1RNAi Eth vs RU | p = 0.043608 | p = 0.501011 |
| Pdf-GS>UAS-Dop1R2RNAi Eth vs RU | pt = 1.000000 | p = 0.001289 |
| Sleep bout number | ||
| UAS-Dop1R1RNAi control Eth vs RU | p = 1.000000 | p = 0.252372 |
| UAS-Dop1R2RNAi control Eth vs RU | pt = 0.896328 | p = 1.000000 |
| Pdf-GS control Eth vs RU | pt = 0.716168 | p = 1.000000 |
| Pdf-GS>UAS-Dop1R1RNAi Eth vs RU | pt = 1.000000 | p = 0.939772 |
| Pdf-GS>UAS-Dop1R2RNAi Eth vs RU | p = 1.000000 | p = 0.002116 |
| Amount of total activity | ||
| UAS-Dop1R1RNAi control Eth vs RU | p = 0.448602 | p = 1.000000 |
| UAS-Dop1R2RNAi control Eth vs RU | p = 0.339736 | p = 1.000000 |
| Pdf-GS control Eth vs RU | p = 0.748836 | p = 0.000020 |
| Pdf-GS>UAS-Dop1R1RNAi Eth vs RU | p = 0.095238 | p = 0.006267 |
| Pdf-GS>UAS-Dop1R2RNAi Eth vs RU | pt = 0.191841 | p = 0.051620 |
Data were tested for normal distribution with a Shapiro–Wilk normality test (p > 0.05). A t test (pt) was used for normally distributed data in the case of variance homogeneity (Levene's test, p > 0.05) otherwise a Welch's t test (pwt) was performed. If any group of the comparison was not normally distributed, the Mann–Whitney U test was used. Bonferroni's correction was used for multiple comparisons (results shown in Figs. 8, 9).
We observed a highly significant period-lengthening effect of RU application in Pdf-GS controls and all the crosses with the Pdf-GS strain (Table 4), which has been reported in the past (Depetris-Chauvin et al., 2011; Frenkel et al., 2017). Therefore, we conclude that conditional dopamine receptor downregulation itself does not affect the free-running period, which is in line with the results obtained via permanent dopamine receptor knockdown.
Dopamine depolarizes the l-LNvs via Dop1R1, but does not increase their firing rate
When observed electrophysiologically using whole-cell patch clamp, the l-LNvs fire spontaneous action potentials in bursting or tonic modes (Cao and Nitabach, 2008; Sheeba et al., 2008b; Depetris-Chauvin et al., 2011; Fogle et al., 2011; Muraro and Ceriani, 2015). As reported previously, when whole-cell patch-clamp recordings are performed during the day and established rapidly after brain dissection (Muraro and Ceriani, 2015), all l-LNvs fire action potentials in the bursting mode (Fig. 10). To further explore the role of dopamine on the physiology of l-LNvs, we bath applied dopamine across control l-LNvs (Fig. 10a) and in l-LNvs in which Dop1R1 (Fig. 10b) or Dop1R2 (Fig. 10c) had been downregulated using RNAi constructs driven by the Pdf-Gal4. Control and Dop1R2RNAi l-LNvs displayed robust depolarizations on 1 mm dopamine application (Fig. 10a,c,d). In contrast, we observed significantly reduced dopamine-induced depolarization when Dop1R1 expression was downregulated (Fig. 10b,d). This result is consistent with cAMP imaging experiments (Fig. 4) and supports the hypothesis that dopamine responses in l-LNvs are mainly mediated by Dop1R1. Although we observed a small trend toward a decrease in firing rate on dopamine application, this was not statistically significant (Fig. 11). These results suggest that, in l-LNvs, dopamine plays a modulatory role as it depolarizes the membrane without significantly changing the firing rate. Thus, dopamine might make the l-LNvs more sensitive to excitatory inputs.
Figure 10.
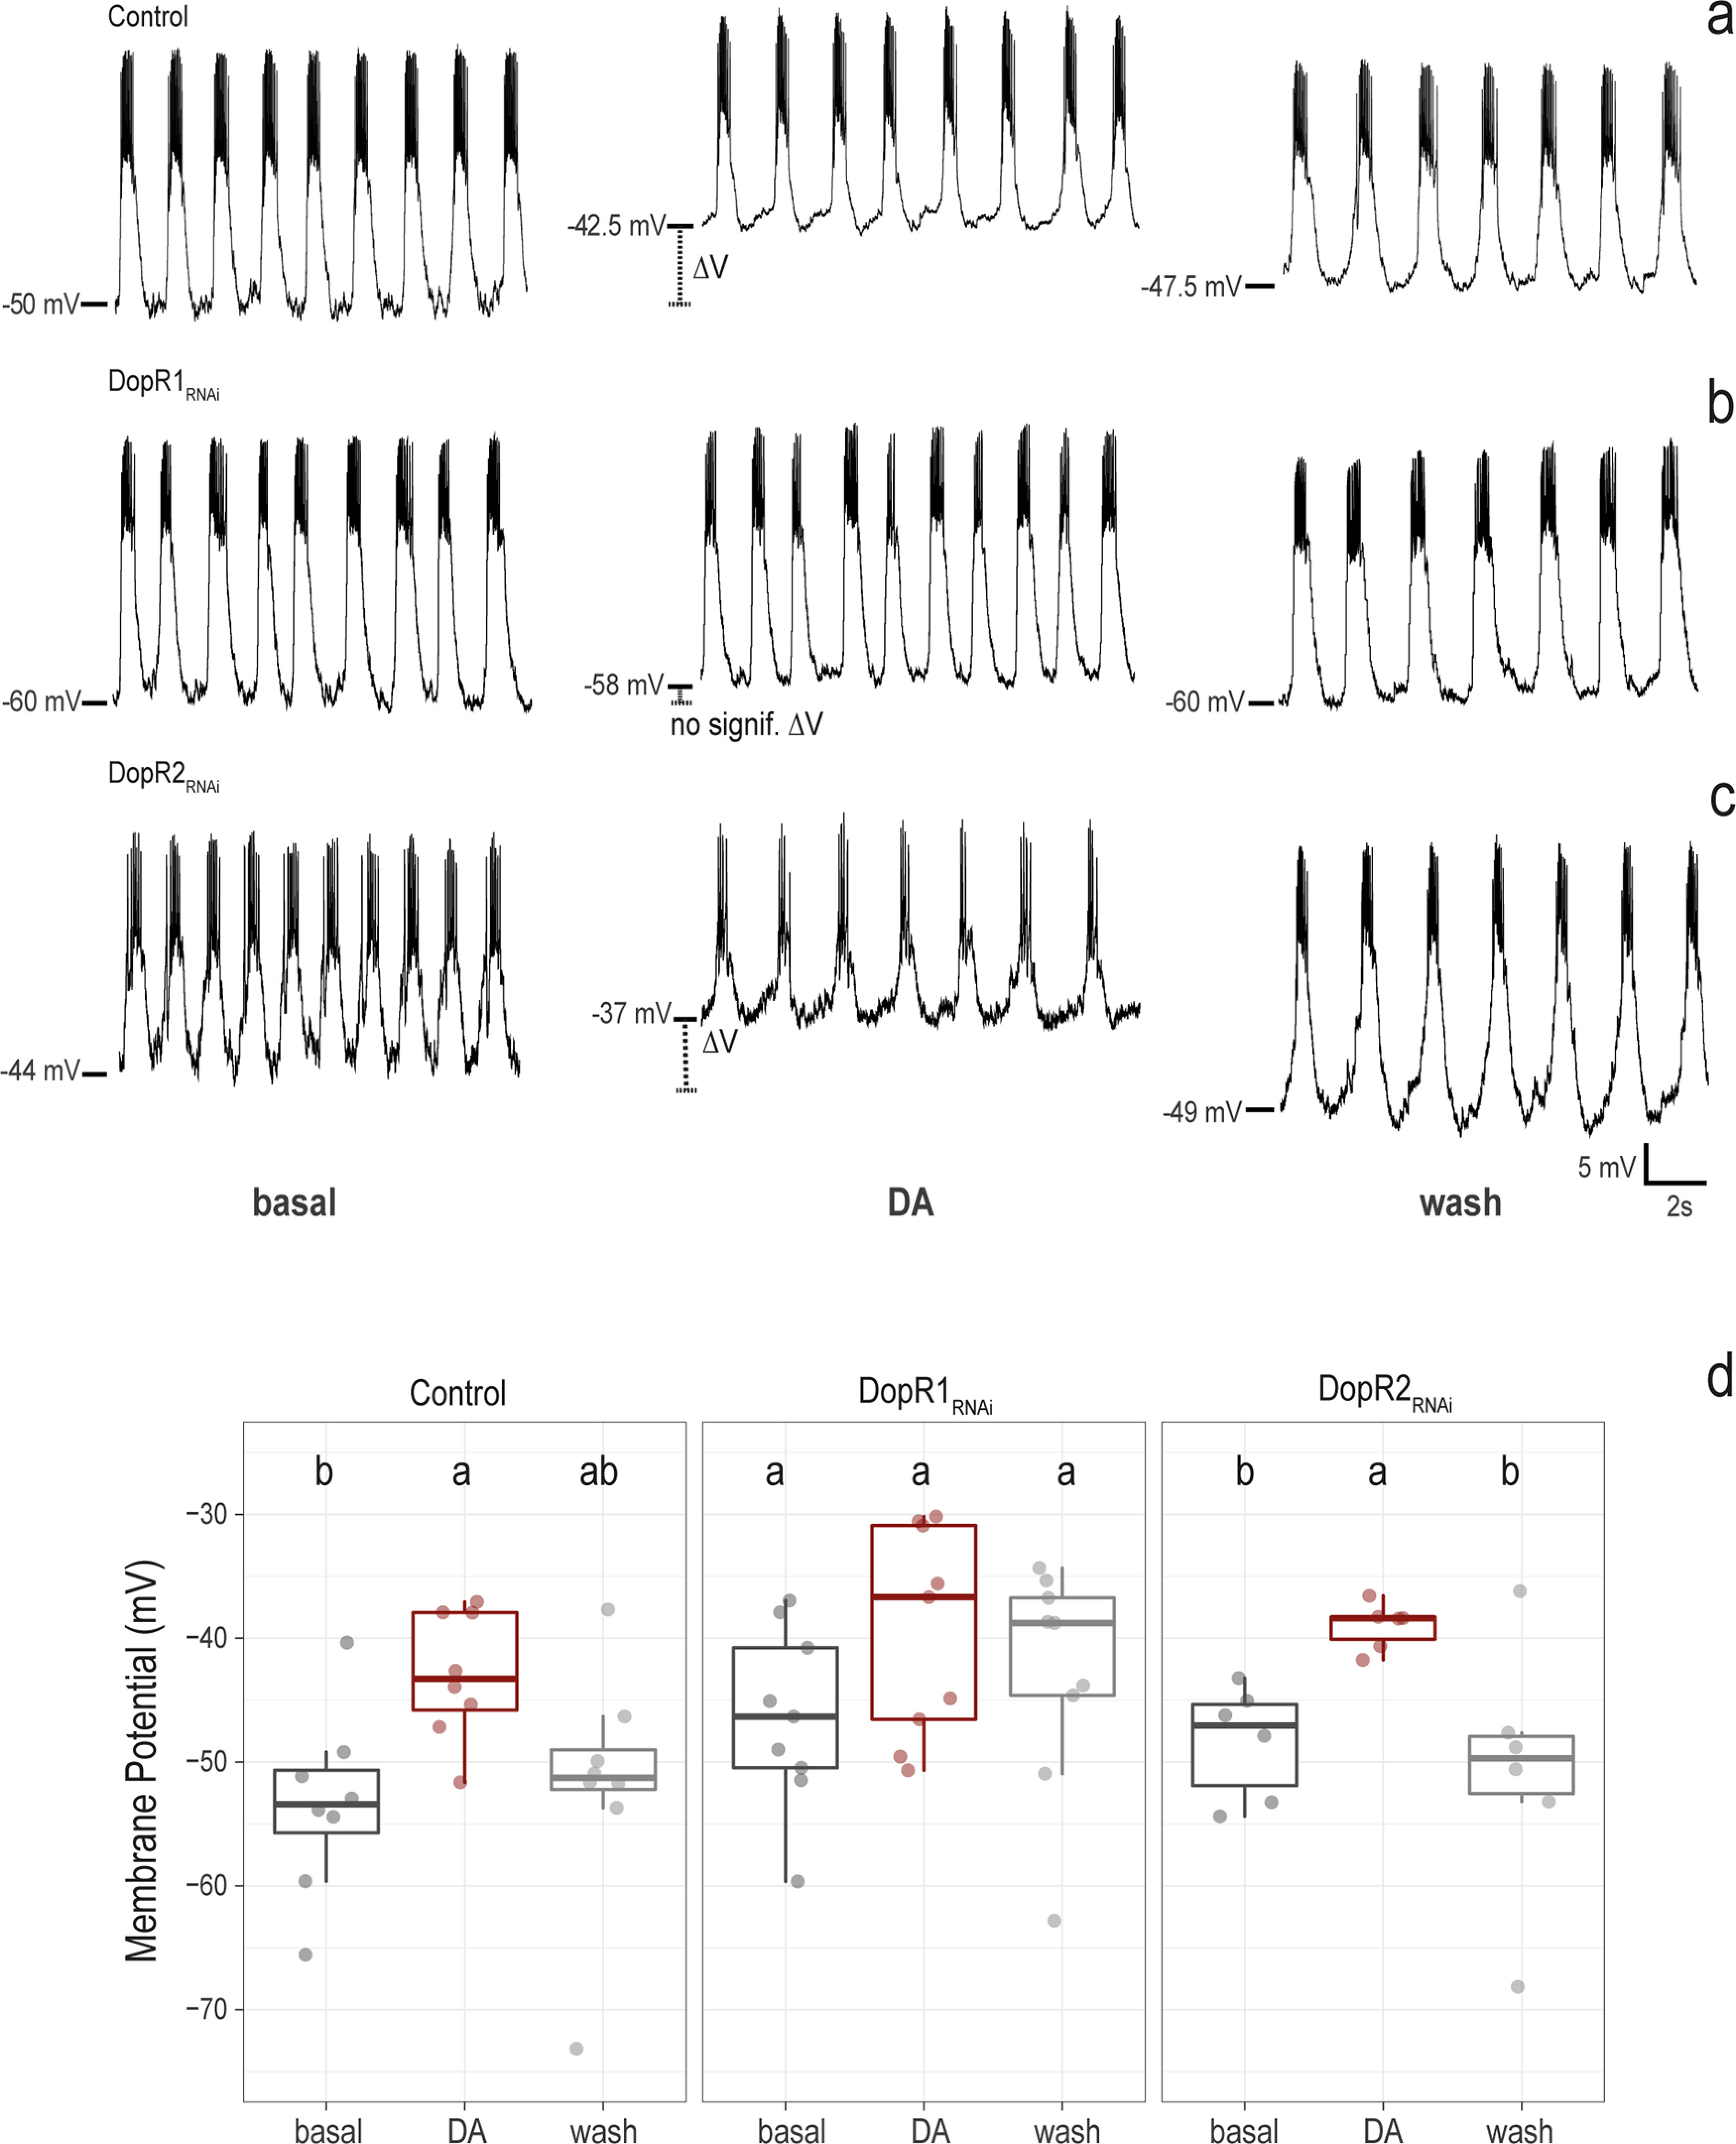
Dop1R1 mediates l-LNv responses to dopamine. a–c, Representative traces of whole-cell patch-clamp recordings during basal conditions (perfusion of external saline, left panels), dopamine (DA; perfusion of 1 mM dopamine, middle panels), and washout (perfusion of external saline, right panels). a–d, Control group, Pdf-Gal4,UAS-dicer;pdf Red>+ (a), Dop1R1RNAi group (b), Pdf-Gal4,UAS-dicer2;pdf Red>UAS-Dop1R1RNAi. (c), Pdf-Gal4,UAS-dicer2;pdf Red>UAS-Dop1R2RNAi (d). Box plots showing the value of membrane potential in millivolts for the same genotypes in each condition (basal, DA, wash). Kruskal–Wallis nonparametric test with Bonferroni's correction was applied for statistical analysis. The α parameter was 0.05. Different letters indicate significant differences. Control, n = 8; DopR1RNAi, n = 9; Dop1R2RNAi, n = 6.
Figure 11.

Dopamine does not increase l-LNv firing rate. Box plots showing the value of firing rate (number of action potentials per second) obtained in whole-cell patch-clamp configuration under three different conditions (basal, dopamine, wash) for Pdf-Gal4,UAS-dicer;pdf Red>+ (Control, left); DopR1RNAi group, Pdf-Gal4,UAS-dicer;pdf Red>UAS-Dop1R1RNAi (DopR1RNAi, middle); Pdf-Gal4,UAS-dicer;pdf Red>UAS-Dop1R2RNAi (Dop1R2RNAi, right). Kruskal–Wallis nonparametric test with Bonferroni correction was applied for statistical analysis. The α parameter was 0.05. No statistically significant differences were found (same letter indicates no significant differences). Control, n = 8; Dop1R1RNAi, n = 9; Dop1R2RNAi, n = 6.
Discussion
All tested clock neurons respond to dopamine
Here we show that dopamine acts broadly on the neurons of the Drosophila clock network that have neurites in the AME, a neuropil that is invaded by presynaptic terminals of dopaminergic neurons. All of these clock neurons responded to dopamine with increases in cAMP. The responses of the l-LNvs and DN1s were almost completely blocked by downregulation of Dop1R1s, but not significantly by downregulation of Dop1R2s, whereas the responses of some LNds were blocked by downregulation of Dop1R1s and others by downregulation of Dop1R2s. Dopamine responses of all LNd cells were eliminated by simultaneous downregulation of both receptors, indicating that they use different activating dopamine receptors.
Since the electrophysiological and cAMP responses of the l-LNvs were not blocked by downregulating Dop1R2s, we conclude that these neurons use only Dop1R1s. Unfortunately, we could not assess the nature of the Dop1Rs in the s-LNvs, but we hypothesize that these use Dop1R2s for the following reason: the downregulation of Dop1R2s in the s-LNvs and l-LNvs significantly reduces the night-time sleep of the flies. Since the l-LNvs appear not to use Dop1R2s, this effect is most likely mediated by the s-LNvs.
Dopamine signaling on the s-LNvs appears to promote sleep
Multiple lines of evidence are consistent with a wake-promoting role for the s-LNvs (Liang et al., 2019). We were therefore surprised to find that the knockdown of the excitatory dopamine receptor Dop1R2 produce decreases in nighttime sleep. We note here that the s-LNvs have been shown to promote sleep during the entire day via PDF signaling to the AllatostatinA (AstA)-positive posterior lateral protocerebrum (“PLP”) neurons (Chen et al., 2016), which were recently shown to be identical to the lateral posterior clock neurons (LPNs; Ni et al., 2019). Optogenetic excitation of the LPNs promotes sleep (Guo et al., 2018), and glutamatergic and AstA neurites provide excitatory inputs on to the sleep promoting dorsal fan-shaped body (Donlea et al., 2011; Liu et al., 2012, 2016; Ueno et al., 2012; Pimentel et al., 2016; Ni et al., 2019). Thus, our results, along with previous work, suggest the following: (1) that the role of the s-LNvs in the control of sleep is more complex than previously acknowledged; (2) that dopamine likely increases cAMP levels in the s-LNvs via Dop1R2; and (3) that the s-LNvs excite the sleep-promoting LPNs, which subsequently activate the dorsal fan-shaped body neurons leading to sleep. Thus, downregulation of Dop1R2s in the s-LNvs would therefore be predicted to reduce sleep, which fits our observations and is consistent with the literature.
Dopamine signaling on the l-LNvs is not wake promoting
The l-LNvs were reported to be strongly wake promoting (Sheeba et al., 2008a; Chung et al., 2009; Shang et al., 2011), but it was not clear whether dopamine signaling was responsible for this effect. Here, we could not detect the wake-promoting effects of dopamine signaling on the PDF neurons. In contrast, the downregulation of the excitatory Dop1R1s and Dop1R2s in these neurons (along with the s-LNvs) slightly increased wakefulness. Night sleep decreased after knockdown of Dop1R2s, while day sleep decreased after knockdown of Dop1R1 receptors. Our physiological observations make it clear that Dop1R1s are expressed by the l-LNvs. This evidently speaks against a wake-promoting role of dopamine signaling to l-LNvs.
The present study supports the findings of Ueno et al. (2012), who found that the ablation of the l-LNvs did not eliminate the strong arousal effects of dopamine, thereby suggesting that dopamine does not drive the wake-promoting role of the l-LNvs. In fact, our results suggest a moderate sleep-promoting effect of dopamine signaling on the l-LNvs, despite the fact that dopamine depolarizes the l-LNvs, potentially making them more excitable. Glutamate, GABA, and histamine inhibit the l-LNvs (Cao and Nitabach, 2008; Schlichting et al., 2016). While GABAergic inputs to l-LNvs have a clear role in the promotion of sleep (Agosto et al., 2008; Parisky et al., 2008; Chung et al., 2009; Gmeiner et al., 2013), such a role has not yet been demonstrated for histamine or glutamate. Other putative silencing neuromodulators of the l-LNvs are glycine (Frenkel et al., 2017) and serotonin (Yuan et al., 2005, 2006), but how these different signals interact to regulate the command of l-LNvs over wakefulness is still an open question.
Our study does not call into question the wake-promoting role of the l-LNvs. The ablation of the l-LNvs increases sleep, which demonstrates that their wake-promoting influence exceeds their sleep-promoting influence (Chung et al., 2009). Furthermore, the l-LNvs are electrically the most active during the day when the flies are awake (Sheeba et al., 2008b; Shang et al., 2011), and the electrical hyperexcitation of the l-LNvs increases activity at night and disrupts nocturnal sleep (Sheeba et al., 2008a). Thus, the l-LNvs are firing during the day, thereby promoting daytime wakefulness, and their firing is decreased at night when flies maintain their deepest sleep. The wake-promoting neuromodulators octopamine and acetylcholine act on l-LNvs (Kula-Eversole et al., 2010; Muraro and Ceriani, 2015), but the results described above lead to the surprising conclusion that dopamine does not act as a wake-promoting neuromodulator on the l-LNvs.
In any case, the sleep-promoting role of dopamine via the l-LNvs is moderate when compared with the sleep-promoting effects of the fan-shaped body neurons that lack dopaminergic input (Liu et al., 2012; Ueno et al., 2012). Thus, dopamine signaling via the fan-shaped body has a stronger impact on sleep than dopamine signaling via the l-LNvs or the s-LNvs. The precise role played by dopaminergic inputs to l-LNvs and their modulatory effect on the integration of the multiple excitatory and inhibitory afferences received by these important arousal neurons awaits further research.
Dopamine has different effects on the fan-shaped body neurons and the PDF neurons
Dop1R1 and Dop1R2 receptors have already been implicated in the control of sleep in previous studies. Lebestky et al. (2009) showed that the rescue of Dop1R1 receptors in the l-LNvs of Dop1R1 mutants can partially rescue the flies' normal sleep pattern, which fits our observation that the l-LNvs use Dop1R1 receptors. Liu et al. (2012) and Ueno et al. (2012) showed that dopaminergic neurons signal via Dop1R1s on neurons in the fan-shaped body, whereas Pimentel et al. (2016) demonstrated a role of Dop1R2s in the fan-shaped body. Here we suggest that dopamine signals via Dop1R2s on the s-LNvs. Although PDF neurons and fan-shaped body neurons respond to dopamine via the same activating receptors and in both cases via an increase in cAMP levels, the electrical responses of the neurons to dopamine appear to be different.
In the fan-shaped body neurons, the increase of cAMP leads to an upregulation of the voltage-independent leak current K+ channel “Sandman” and its translocation to the plasma membrane (Pimentel et al., 2016). Consequently, the fan-shaped body neurons switch to long-lasting hyperpolarization (OFF state), which keeps the fruit flies awake. The Rho-GTPase-activating protein Crossveinless-c locks the fan-shaped body neurons in the OFF state (Donlea et al., 2014) until unknown mechanisms flip the neurons back to the ON state. Thus, Dop1R1/2s silence neurons in the fan-shaped body via the increase of cAMP levels (Liu et al., 2012; Ueno et al., 2012; Pimentel et al., 2016).
Our results indicate a very different effect of Dop1R1 signaling in the l-LNvs. The neurons depolarized in response to dopamine, and this effect was blocked after knockdown of Dop1R1s. Thus, dopamine excites the l-LNvs as predicted, but does not increase their firing rate. The main effect of dopamine perfusion in our ex vivo preparation was a robust and reversible depolarization of the membrane, which should make l-LNvs more sensitive to excitatory inputs. Thus, the effect of dopamine on the l-LNvs may be context dependent. Lebestky et al. (2009) aroused the flies by repetitive air puffs and found that dopamine reduced the hyperactivity of the flies in response to this excitation, while it increased spontaneous nocturnal activity. Both effects were mediated via Dop1R1s. Although Lebestky et al. (2009) traced the dopamine effects on startle-induced hyperactivity to the central complex, we cannot exclude that similar mechanisms work in the l-LNvs. Therefore, it will be most interesting to study the effects of Dop1R1 knockdown in the l-LNvs on the sleep and activity of flies in the context of stimulus-induced arousal to test not only the role of dopaminergic inputs to l-LNvs in the context of basal sleep–wake activity, but also in the context of environmentally stimulated arousal or in the presence of challenges to the sleep homeostat, such as in the generation of a sleep rebound phenomenon after a night of sleep deprivation.
In summary, dopamine appears to have different modulatory effects on the fan-shaped body neurons and the PDF neurons—inhibiting the former and exciting the latter. In both cases, dopamine signaling increases sleep, though in different ways and to different degrees. Dopamine signaling to the fan-shaped body is strongly sleep promoting, while dopamine signaling to the PDF neurons is weakly sleep promoting and, in case of the l-LNvs, perhaps dependent on the arousal state of the flies.
Footnotes
This study was supported by German Research Foundation Grants Fo207/14-1 and PA3241/2-1 to C.H.F. and M.S., respectively; Agencia Nacional de Promoción de la Investigación, el Desarrollo Tecnológico y la Innovación Grant PICT-2015-2557 to N.I.M.; and FOCEM-Mercosur Grant COF 03/11 to the Biomedicine Research Institute of Buenos Aires; and by National Institutes of Health/National Institute of Neurological Disorders and Stroke Grant R01-NS-077933 and an National Science Foundation IOS (Integrative Organismal Systems) Grant 1354046 to O.T.S. We thank Serge Birman for providing the TH-Gal4 line and for profound discussions on dopamine effects; Jan Marek Ache for valuable discussion and editing of the manuscript; Indra Hering for help with the sleep experiments; and Barbara Mühlbauer for general excellent assistance.
The authors declare no competing financial interests.
References
- Agosto J, Choi JC, Parisky KM, Stilwell G, Rosbash M, Griffith LC (2008) Modulation of GABAA receptor desensitization uncouples sleep onset and maintenance in Drosophila. Nat Neurosci 11:354–359. 10.1038/nn2046 [DOI] [PMC free article] [PubMed] [Google Scholar]
- Andretic R, van Swinderen B, Greenspan RJ (2005) Dopaminergic modulation of arousal in Drosophila. Curr Biol 15:1165–1175. 10.1016/j.cub.2005.05.025 [DOI] [PubMed] [Google Scholar]
- Birman S. (2005) Arousal mechanisms: speedy flies don't sleep at night. Curr Biol 15:R511–R513. 10.1016/j.cub.2005.06.032 [DOI] [PubMed] [Google Scholar]
- Cao G, Nitabach MN (2008) Circadian control of membrane excitability in Drosophila melanogaster lateral ventral clock neurons. J Neurosci 28:6493–6501. 10.1523/JNEUROSCI.1503-08.2008 [DOI] [PMC free article] [PubMed] [Google Scholar]
- Chen J, Reiher W, Hermann-Luibl C, Sellami A, Cognigni P, Kondo S, Helfrich-Förster C, Veenstra JA, Wegener C (2016) Allatostatin A signalling in Drosophila regulates feeding and sleep and is modulated by PDF. PLoS Genet 12:e1006346 10.1371/journal.pgen.1006492 [DOI] [PMC free article] [PubMed] [Google Scholar]
- Chung BY, Kilman VL, Keath JR, Pitman JL, Allada R (2009) The GABAA receptor RDL acts in peptidergic PDF neurons to promote sleep in Drosophila. Curr Biol 19:386–390. 10.1016/j.cub.2009.01.040 [DOI] [PMC free article] [PubMed] [Google Scholar]
- Cirelli C. (2009) The genetic and molecular regulation of sleep: from fruit flies to humans. Nat Rev Neurosci 10:549–560. 10.1038/nrn2683 [DOI] [PMC free article] [PubMed] [Google Scholar]
- Crocker A, Shahidullah M, Levitan IB, Sehgal A (2010) Identification of a neural circuit that underlies the effects of octopamine on sleep: wake behavior. Neuron 65:670–681. 10.1016/j.neuron.2010.01.032 [DOI] [PMC free article] [PubMed] [Google Scholar]
- Depetris-Chauvin A, Berni J, Aranovich EJ, Muraro NI, Beckwith EJ, Ceriani MF (2011) Adult-specific electrical silencing of pacemaker neurons uncouples molecular clock from circadian outputs. Curr Biol 21:1783–1793. 10.1016/j.cub.2011.09.027 [DOI] [PMC free article] [PubMed] [Google Scholar]
- Donlea JM, Thimgan MS, Suzuki L, Gottschalk L, Shaw PJ (2011) Inducing sleep by remote control facilitates memory consolidation in Drosophila. Science 332:1571–1576. 10.1126/science.1202249 [DOI] [PMC free article] [PubMed] [Google Scholar]
- Donlea JM, Pimentel D, Miesenböck G (2014) Neuronal machinery of sleep homeostasis in Drosophila. Neuron 81:860–872. 10.1016/j.neuron.2013.12.013 [DOI] [PMC free article] [PubMed] [Google Scholar]
- Donlea JM, Pimentel D, Talbot CB, Kempf A, Omoto JJ, Hartenstein V, Miesenböck G (2018) Recurrent circuitry for balancing sleep need and sleep. Neuron 97:378–389. 10.1016/j.neuron.2017.12.016 [DOI] [PMC free article] [PubMed] [Google Scholar]
- Dubowy C, Sehgal A (2017) Circadian rhythms and sleep in Drosophila melanogaster. Genetics 205:1373–1397. 10.1534/genetics.115.185157 [DOI] [PMC free article] [PubMed] [Google Scholar]
- Feinberg EH, Vanhoven MK, Bendesky A, Wang G, Fetter RD, Shen K, Bargmann CI (2008) GFP Reconstitution Across Synaptic Partners (GRASP) defines cell contacts and synapses in living nervous systems. Neuron 57:353–363. 10.1016/j.neuron.2007.11.030 [DOI] [PubMed] [Google Scholar]
- Fogle KJ, Parson KG, Dahm NA, Holmes TC (2011) CRYPTOCHROME is a blue-light sensor that regulates neuronal firing rate. Science 331:1409–1413. 10.1126/science.1199702 [DOI] [PMC free article] [PubMed] [Google Scholar]
- Foltenyi K, Greenspan RJ, Newport JW (2007) Activation of EGFR and ERK by rhomboid signaling regulates the consolidation and maintenance of sleep in Drosophila. Nat Neurosci 10:1160–1167. 10.1038/nn1957 [DOI] [PubMed] [Google Scholar]
- Frenkel L, Muraro NI, Beltrán González AN, Marcora MS, Bernabó G, Hermann-Luibl C, Romero JI, Helfrich-Förster C, Castaño EM, Marino-Busjle C, Calvo DJ, Ceriani MF (2017) Organization of circadian behavior relies on glycinergic transmission. Cell Rep 19:72–85. 10.1016/j.celrep.2017.03.034 [DOI] [PubMed] [Google Scholar]
- Friggi-Grelin F, Coulom H, Meller M, Gomez D, Hirsh J, Birman S (2003) Targeted gene expression in Drosophila dopaminergic cells using regulatory sequences from tyrosine hydroxylase. J Neurobiol 54:618–627. 10.1002/neu.10185 [DOI] [PubMed] [Google Scholar]
- Gmeiner F, Kołodziejczyk A, Yoshii T, Rieger D, Nässel DR, Helfrich-Förster C (2013) GABAB receptors play an essential role in maintaining sleep during the second half of the night in Drosophila melanogaster. J Exp Biol 216:3837–3843. 10.1242/jeb.085563 [DOI] [PubMed] [Google Scholar]
- Grima B, Chélot E, Xia R, Rouyer F (2004) Morning and evening peaks of activity rely on different clock neurons of the Drosophila brain. Nature 431:869–873. 10.1038/nature02935 [DOI] [PubMed] [Google Scholar]
- Gummadova JO, Coutts GA, Glossop NR (2009) Analysis of the Drosophila Clock promoter reveals heterogeneity in expression between subgroups of central oscillator cells and identifies a novel enhancer region. J Biol Rhythms 24:353–367. 10.1177/0748730409343890 [DOI] [PubMed] [Google Scholar]
- Guo F, Yu J, Jung HJ, Abruzzi KC, Luo W, Griffith LC, Rosbash M (2016) Circadian neuron feedback controls the Drosophila sleep-activity profile. Nature 536:292–297. 10.1038/nature19097 [DOI] [PMC free article] [PubMed] [Google Scholar]
- Guo F, Holla M, Díaz MM, Rosbash M (2018) A circadian output circuit controls sleep-wake arousal in Drosophila. Neuron 100:624–635.e4. 10.1016/j.neuron.2018.09.002 [DOI] [PubMed] [Google Scholar]
- Hamasaka Y, Nässel DR (2006) Mapping of serotonin, dopamine, and histamine in relation to different clock neurons in the brain of Drosophila. J Comp Neurol 494:314–330. 10.1002/cne.20807 [DOI] [PubMed] [Google Scholar]
- Helfrich-Förster C. (1995) The period clock gene is expressed in central nervous system neurons which also produce a neuropeptide that reveals the projections of circadian pacemaker cells within the brain of Drosophila melanogaster. Proc Natl Acad Sci U S A 92:612–616. 10.1073/pnas.92.2.612 [DOI] [PMC free article] [PubMed] [Google Scholar]
- Helfrich-Förster C. (2018) Sleep in insects. Annu Rev Entomol 63:69–86. 10.1146/annurev-ento-020117-043201 [DOI] [PubMed] [Google Scholar]
- Helfrich-Förster C, Shafer OT, Wülbeck C, Grieshaber E, Rieger D, Taghert P (2007) Development and morphology of the clock-gene-expressing lateral neurons of Drosophila melanogaster. J Comp Neurol 500:47–70. 10.1002/cne.21146 [DOI] [PubMed] [Google Scholar]
- Hendricks JC, Finn SM, Panckeri KA, Chavkin J, Williams JA, Sehgal A, Pack AI (2000) Rest in Drosophila is a sleep-like state. Neuron 25:129–318. 10.1016/S0896-6273(00)80877-6 [DOI] [PubMed] [Google Scholar]
- Hermann-Luibl C, Yoshii T, Senthilan PR, Dircksen H, Helfrich-Förster C (2014) The ion transport peptide is a new functional clock neuropeptide in the fruit fly Drosophila melanogaster. J Neurosci 34:9522–9536. 10.1523/JNEUROSCI.0111-14.2014 [DOI] [PMC free article] [PubMed] [Google Scholar]
- Joiner WJ, Crocker A, White BH, Sehgal A (2006) Sleep in Drosophila is regulated by adult mushroom bodies. Nature 441:757–760. 10.1038/nature04811 [DOI] [PubMed] [Google Scholar]
- King AN, Sehgal A (2020) Molecular and circuit mechanisms mediating circadian clock output in the Drosophila brain. Eur J Neurosci 51:268–281. 10.1111/ejn.14092 [DOI] [PMC free article] [PubMed] [Google Scholar]
- Kula-Eversole E, Nagoshi E, Shang Y, Rodriguez J, Allada R, Rosbash M (2010) Surprising gene expression patterns within and between PDF-containing circadian neurons in Drosophila. Proc Natl Acad Sci U S A 107:13497–13502. 10.1073/pnas.1002081107 [DOI] [PMC free article] [PubMed] [Google Scholar]
- Kume K, Kume S, Park SK, Hirsh J, Jackson FR (2005) Dopamine is a regulator of arousal in the fruit fly. J Neurosci 25:7377–7384. 10.1523/JNEUROSCI.2048-05.2005 [DOI] [PMC free article] [PubMed] [Google Scholar]
- Lebestky T, Chang JS, Dankert H, Zelnik L, Kim YC, Han KA, Wolf FW, Perona P, Anderson DJ (2009) Two different forms of arousal in Drosophila are oppositely regulated by the dopamine D1 receptor ortholog DopR via distinct neural circuits. Neuron 64:522–536. 10.1016/j.neuron.2009.09.031 [DOI] [PMC free article] [PubMed] [Google Scholar]
- Liang X, Ho MCW, Zhang Y, Li Y, Wu MN, Holy TE, Taghert PH (2019) Morning and evening circadian pacemakers independently drive premotor centers via a specific dopamine relay. Neuron 102:843–857. 10.1016/j.neuron.2019.03.028 [DOI] [PMC free article] [PubMed] [Google Scholar]
- Lima SQ, Miesenböck G (2005) Remote control of behavior through genetically targeted photostimulation of neurons. Cell 121:141–152. 10.1016/j.cell.2005.02.004 [DOI] [PubMed] [Google Scholar]
- Liu Q, Liu S, Kodama MR, Driscoll MR, Wu MN (2012) Two dopaminergic neurons signal to the dorsal fan-shaped body to promote wakefulness in Drosophila. Curr Biol 22:2114–2123. 10.1016/j.cub.2012.09.008 [DOI] [PMC free article] [PubMed] [Google Scholar]
- Liu S, Liu Q, Tabuchi M, Wu MN (2016) Sleep drive is encoded by neural plastic changes in a dedicated circuit. Cell 165:1347–1360. 10.1016/j.cell.2016.04.013 [DOI] [PMC free article] [PubMed] [Google Scholar]
- Muraro N, Ceriani MF (2015) Acetylcholine from visual circuits modulates the activity of arousal neurons in Drosophila. J Neurosci 35:16315–16327. 10.1523/JNEUROSCI.1571-15.2015 [DOI] [PMC free article] [PubMed] [Google Scholar]
- Ni JD, Gurav AS, Liu W, Ogunmowo TH, Hackbart H, Elsheikh A, Verdegaal AA, Montell C (2019) Differential regulation of the Drosophila sleep homeostat by circadian and arousal inputs. Elife 8:e40487 10.7554/eLife.40487 [DOI] [PMC free article] [PubMed] [Google Scholar]
- Nikolaev VO, Bünemann M, Hein L, Hannawacker A, Lohse MJ (2004) Novel single chain cAMP sensors for receptor-induced signal propagation. J Biol Chem 279:37215–37218. 10.1074/jbc.C400302200 [DOI] [PubMed] [Google Scholar]
- Nitz DA, van Swinderen B, Tononi G, Greenspan RJ (2002) Electrophysiological correlates of rest and activity in Drosophila melanogaster. Curr Biol 12:1934–1940. 10.1016/S0960-9822(02)01300-3 [DOI] [PubMed] [Google Scholar]
- Osterwalder T, Yoon KS, White BH, Keshishian H (2001) A conditional tissue-specific transgene expression system using inducible GAL4. Proc Natl Acad Sci U S A 98:12596–12601. 10.1073/pnas.221303298 [DOI] [PMC free article] [PubMed] [Google Scholar]
- Parisky KM, Agosto J, Pulver SR, Shang Y, Kuklin E, Hodge JJ, Kang K, Liu X, Garrity PA, Rosbash M, Griffith LC (2008) PDF cells are a GABAresponsive wake-promoting component of the Drosophila sleep circuit. Neuron 60:672–682. 10.1016/j.neuron.2008.10.042 [DOI] [PMC free article] [PubMed] [Google Scholar]
- Park S, Sonn JY, Oh Y, Lim C, Choe J (2014) SIFamide and SIFamide receptor define a novel neuropeptide signaling to promote sleep in Drosophila. Mol Cells 37:295–301. 10.14348/molcells.2014.2371 [DOI] [PMC free article] [PubMed] [Google Scholar]
- Pimentel D, Donlea JM, Talbot CB, Song SM, Thurston AJ, Miesenböck G (2016) Operation of a homeostatic sleep switch. Nature 536:333–337. 10.1038/nature19055 [DOI] [PMC free article] [PubMed] [Google Scholar]
- Pitman JL, McGill JJ, Keegan KP, Allada R (2006) A dynamic role for the mushroom bodies in promoting sleep in Drosophila. Nature 441:753–756. 10.1038/nature04739 [DOI] [PubMed] [Google Scholar]
- Potdar S, Sheeba V (2018) Wakefulness is promoted during day time by PDFR signalling to dopaminergic neurons in Drosophila melanogaster. eNeuro 5:ENEURO.0129-18.2018–18 10.1523/ENEURO.0129-18.2018 [DOI] [PMC free article] [PubMed] [Google Scholar]
- Renn SC, Park JH, Rosbash M, Hall JC, Taghert PH (1999) A pdf neuropeptide gene mutation and ablation of PDF neurons each cause severe abnormalities of behavioral circadian rhythms in Drosophila. Cell 99:791–802. 10.1016/S0092-8674(00)81676-1 [DOI] [PubMed] [Google Scholar]
- Rieger D, Shafer OT, Tomioka K, Helfrich-Förster C (2006) Functional analysis of circadian pacemaker neurons in Drosophila melanogaster. J Neurosci 26:2531–2543. 10.1523/JNEUROSCI.1234-05.2006 [DOI] [PMC free article] [PubMed] [Google Scholar]
- Riemensperger T, Isabel G, Coulom H, Neuser K, Seugnet L, Kume K, Iché-Torres M, Cassar M, Strauss R, Preat T, Hirsh J, Birman S (2011) Behavioral consequences of dopamine deficiency in the Drosophila central nervous system. Proc Natl Acad Sci U S A 108:834–839. 10.1073/pnas.1010930108 [DOI] [PMC free article] [PubMed] [Google Scholar]
- Ruben M, Drapeau MD, Mizrak D, Blau J (2012) A mechanism for circadian control of pacemaker neuron excitability. J Biol Rhythms 27:353–364. 10.1177/0748730412455918 [DOI] [PMC free article] [PubMed] [Google Scholar]
- Schlichting M, Helfrich-Förster C (2015) Photic entrainment in Drosophila assessed by locomotor activity recordings. Methods Enzymol 552:105–123. 10.1016/bs.mie.2014.10.017 [DOI] [PubMed] [Google Scholar]
- Schlichting M, Menegazzi P, Lelito KR, Yao Z, Buhl E, Dalla Benetta E, Bahle A, Denike J, Hodge JJL, Helfrich-Förster C, Shafer OT (2016) A neural network underlying circadian entrainment and photoperiodic adjustment of sleep and activity in Drosophila. J Neurosci 36:9084–9096. 10.1523/JNEUROSCI.0992-16.2016 [DOI] [PMC free article] [PubMed] [Google Scholar]
- Schubert FK, Hagedorn N, Yoshii T, Helfrich-Förster C, Rieger D (2018) Neuroanatomical details of Drosophila lateral neurons support their functional role in the circadian system. J Comp Neurol 526:1209–1231. 10.1002/cne.24406 [DOI] [PMC free article] [PubMed] [Google Scholar]
- Shafer OT, Kim DJ, Dunbar-Yaffe R, Nikolaev VO, Lohse MJ, Taghert PH (2008) Widespread receptivity to neuropeptide PDF throughout the neuronal circadian clock network of Drosophila revealed by real-time cyclic AMP imaging. Neuron 58:223–237. 10.1016/j.neuron.2008.02.018 [DOI] [PMC free article] [PubMed] [Google Scholar]
- Shang Y, Griffith LC, Rosbash M (2008) Light-arousal and circadian photoreception circuits intersect at the large PDF cells of the Drosophila brain. Proc Natl Acad Sci U S A 105:19587–11994. 10.1073/pnas.0809577105 [DOI] [PMC free article] [PubMed] [Google Scholar]
- Shang Y, Haynes P, Pírez N, Harrington KI, Guo F, Pollack J, Hong P, Griffith LC, Rosbash M (2011) Imaging analysis of clock neurons reveals light buffers the wake-promoting effect of dopamine. Nat Neurosci 14:889–895. 10.1038/nn.2860 [DOI] [PMC free article] [PubMed] [Google Scholar]
- Shaw PJ, Cirelli C, Greenspan RJ, Tononi G (2000) Correlates of sleep and waking in Drosophila melanogaster. Science 287:1834–1837. 10.1126/science.287.5459.1834 [DOI] [PubMed] [Google Scholar]
- Sheeba V, Fogle KJ, Kaneko M, Rashid S, Chou Y-T, Sharma VK, Holmes TC (2008a) Large ventral lateral neurons modulate arousal and sleep in Drosophila. Curr Biol 18:1537–1545. 10.1016/j.cub.2008.08.033 [DOI] [PMC free article] [PubMed] [Google Scholar]
- Sheeba V, Gu H, Sharma VK, O'Dowd DK, Holmes TC (2008b) Circadian- and light-dependent regulation of resting membrane potential and spontaneous action potential firing of Drosophila circadian pacemaker neurons. J Neurophysiol 99:976–988. 10.1152/jn.00930.2007 [DOI] [PMC free article] [PubMed] [Google Scholar]
- Stewart BA, Atwood HL, Renger JJ, Wang J, Wu CF (1994) Improved stability of Drosophila larval neuromuscular preparations in haemolymph-like physiological solutions. J Comp Physiol A 175:179–191. 10.1007/BF00215114 [DOI] [PubMed] [Google Scholar]
- Stoleru D, Peng Y, Agosto J, Rosbash M (2004) Coupled oscillators control morning and evening locomotor behaviour of Drosophila. Nature 431:862–868. 10.1038/nature02926 [DOI] [PubMed] [Google Scholar]
- Ueno T, Tomita J, Tanimoto H, Endo K, Ito K, Kume S, Kume K (2012) Identification of a dopamine pathway that regulates sleep and arousal in Drosophila. Nat Neurosci 15:1516–1523. 10.1038/nn.3238 [DOI] [PubMed] [Google Scholar]
- Van Swinderen B, Nitz DA, Greenspan RJ (2004) Uncoupling of brain activity from movement defines arousal States in Drosophila. Curr Biol 14:81–87. 10.1016/j.cub.2003.12.057 [DOI] [PubMed] [Google Scholar]
- Wang J, Ma X, Yang JS, Zheng X, Zugates CT, Lee CHJ, Lee T (2004) Transmembrane/juxtamembrane domain-dependent Dscam distribution and function during mushroom body neuronal morphogenesis. Neuron 43:663–672. 10.1016/j.neuron.2004.06.033 [DOI] [PubMed] [Google Scholar]
- Wu MN, Koh K, Yue Z, Joiner WJ, Sehgal A (2008) A genetic screen for sleep and circadian mutants reveals mechanisms underlying regulation of sleep in Drosophila. Sleep 31:465–472. 10.1093/sleep/31.4.465 [DOI] [PMC free article] [PubMed] [Google Scholar]
- Yuan Q, Lin F, Zeng X, Sehgal A (2005) Serotonin modulates circadian entrainment in Drosophila. Neuron 47:115–127. 10.1016/j.neuron.2005.05.027 [DOI] [PubMed] [Google Scholar]
- Yuan Q, Joiner WJ, Sehgal A (2006) A sleep-promoting role for the Drosophila serotonin receptor 1A. Curr Biol 16:1051–1062. 10.1016/j.cub.2006.04.032 [DOI] [PubMed] [Google Scholar]