Abstract
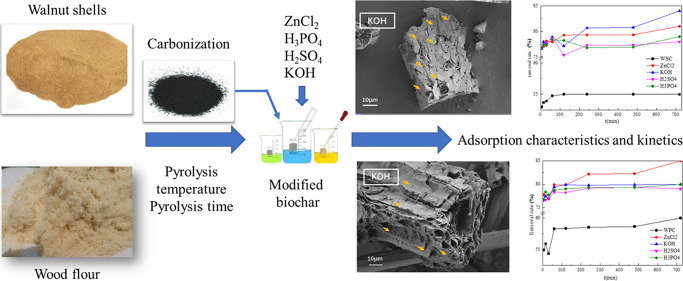
Walnut shell biochar (WSC) and wood powder biochar (WPC) prepared using the limited oxygen pyrolysis process were used as raw materials, and ZnCl2, KOH, H2SO4, and H3PO4 were used to modify them. The evaluation of the liquid-phase adsorption performance using methylene blue (MB) as a pigment model showed that modified biochar prepared from both biomasses had a mesoporous structure, and the pore size of WSC was larger than that of WPC. However, the alkaline modified was more conducive to the formation of pores in the biomass-modified biochar materials; KOH treatment resulted in the highest modified biochar-specific surface area. The isothermal adsorption of MB by the two biomass pyrolysis charcoals conformed to the Freundlich equation, and the adsorption process conformed to the quasi-second-order kinetic equation, which is mainly physical adsorption. The large number of oxygen-containing functional groups on the particle surface provided more adsorption sites for MB adsorption, which was beneficial to the adsorption reactions. The adsorption effects of woody biomass were obviously higher than that of shell biomass, and the adsorption capacities of the two raw materials’ pyrolysis charcoal were in the order of WPC > WSC. The adsorption effects of different treatment reagents on MB were in the order ZnCl2 > KOH > H3PO4 > H2SO4. The maximum adsorption capacities of the two biomass treatments were 850.9 mg/g for WPC with ZnCl2 treatment and 701.3 mg/g for WSC with KOH treatment.
1. Introduction
Yunnan is one of the 23 provinces in China. It is located in the southwest of China and is part of the Yunnan–Guizhou Plateau. With land resource characteristics including less land and more mountains, Yunnan Province has developed a vigorous walnut industry in recent years, relying on the advantages of ecological and biological resources. In 2019, the walnut planting area in Yunnan Province reached 2.87 million hm2, the output reached 1.19 million tons, and the output was increasing at a rate of approximately 15% per year.1−3 The Yunnan walnut planting area, output, and output rate rank first in China. Among the varieties grown, Juglans Silillata Dode is of high quality, has thin shells and high kernel yields, and constitutes a large proportion of the planting. It is one of the good quality economic forest tree species in Yunnan.4 Studies have found that walnut oil is rich in oleic, linoleic, and linolenic acids, which can improve blood lipid concentrations in the body and prevent arterial diseases. Thus, Yunnan Province produces large amounts of walnut oil.
Processed walnut oil contains a certain amount of pigments and impurities, which affects the uniformity of the oil product. To meet the market’s color requirements for walnut oil, walnut oil is often bleached. Currently, commonly used bleaching techniques include adsorption,5−7 membrane,8,9 light energy,10,11 and ultrasonic-assisted,12,13 chemical,14 and enzymatic decolorization.15 The chemical method uses chemical reagents to decompose the pigment through a reaction; the color fades and the decolorization efficiency is high. However, the chemical method has challenges such as the destruction of oil and fat components and the analysis of chemical reagents that are rarely used in the processing of edible oil. Enzymatic decolorization utilizes biological enzymes to degrade the pigment portion. The decolorization process is gentle, and the degree of decolorization is high; however, the enzymatic method requires harsh conditions, and the decolorization efficiency is low, which is not suitable for industrial production. The light energy decolorization method oxidizes the photosensitive groups of pigments, thereby destroying the color structure of the pigment to achieve decolorization through a safe and pollution-free process. However, the decolorization selection orientation is too strong and the decolorization production efficiency is low. Membrane decolorization has a positive effect, simple operation, and high decolorization, but it is expensive and difficult to apply on a large scale. Ultrasonic decolorization is often used in conjunction with chemical decolorization and, thus, rarely used in the edible oil industry.16 Compared with bleaching technologies, the adsorption method has advantages of high bleaching efficiency and low bleaching cost and is used more frequently in industrial production.
The adsorption method of bleaching mainly absorbs and removes the pigments and impurities in the oil through the surface action of the adsorbent.17,18 The adsorption mechanism works by the combined actions of physical adsorption and chemical adsorption. Physical adsorption often occurs during low-temperature bleaching processes and relies on intermolecular forces between surface groups of the adsorbent and the pigment to form single- and multilayer selective mixed adsorption, which requires low activation energy.19−21 Chemical adsorption often occurs during high-temperature processes. The unevenness of the atoms on the surface of the adsorbent leads to the asymmetry of the gravitational force on the surface of the adsorbent, and thus, the surface molecules have a certain free energy, thereby adsorbing certain substances, causing the free energy to decrease. The formation of shared electrons or transfer of electrons between adsorbates is through selective and monolayer adsorption.22,23
Decolorants often use activated clay, modified biochar, attapulgite, zeolite, or other materials. In the oil industry, activated clay is often used for bleaching, but the oil after bleaching using activated clay has a special taste, and activated clay has a good adsorption capacity only for chlorophyll, carotenoid, and their derivatives.24,25 Modified biochar has a rich void structure and chemical groups distributed on its surface. It can act through both physical and chemical adsorption, and thus, it has a high pigment adsorption rate and does not pollute the oil.26−28 To enhance the bleaching effect of the modified biochar, biochar is often activated during preparation. Activation technology is roughly divided into physical and chemical activation methods. The physical activation method has the advantages of a simple process and low equipment requirements.29,30 The disadvantages include higher activation temperature, longer activation time, and higher energy consumption. The chemical activation method has the advantages of low activation temperature, easy control of the activation reaction, and excellent performance of the prepared product, but there can be issues such as environmental pollution.31−33 However, with the current mature industrial wastewater treatment system, this has been well resolved. The commonly used chemical activation method often employs acidic chemical reagents such as H3PO4 and H2SO4, which have issues such as high activation energy consumption, high pollution, and non-recyclability. However, ZnCl2 and KOH activators have the advantages of low activation temperature and high biochar yield. At the same time, the prepared modified biochar has a controllable void structure. In recent years, the application of wood, walnut shell, and the bamboo-modified biochar is more and more frequent.34−36
Currently, the walnut industry in Yunnan Province produces large quantities of waste walnut shells, which are disposed of mainly by incineration. However, the walnut shell has a stable structure and poor combustibility, leading to potentially wasted resources and environmental pollution. Development of a walnut shell-modified biochar for the decolorization of walnut oil could not only use waste walnut shells with high quality but also reduce environmental pollution.
In this study, waste walnut shell and wood flour were utilized as the raw material for the production of granular-modified carbon by the pyrolysis method at 550 °C. Aiming to reveal the effect of different modifications such as concentrated sulfuric acid, phosphoric acid, ZnCl2, and KOH on the evolution of biochar physicochemical properties as well as the molecular interactions of carbon species with adsorbate, the related experiments were carried out. The one-step preparation process involving an in situ pyrolysis process reduced the activation process, saved energy, reduced wastewater discharge, and realized green and clean production of carbon-adsorbed materials. The characteristics of the resulting biochars were analyzed using a variety of techniques, including scanning electron microscopy (SEM), N2 adsorption/desorption isotherm (BET), elemental analysis, X-ray diffraction (XRD), X-ray photoelectron spectroscopy (XPS), Fourier transform infrared spectroscopy (FTIR), and so forth. The liquid adsorption behavior of biochar was investigated using methylene blue (MB) as a pollutant probe; MB is widely used in dyes, biological dyes, drugs, and other aspects, and it is widely represented in the pigment structure. Finally, the adsorption characteristics, kinetics, and thermodynamics of the pigment model compound (MB) were studied, the effects of activator, type of carbon, adsorption time, and other factors on the adsorption effect were analyzed, which provided the theoretical basis for the high-value utilization of biomass.
2. Experimental Section
2.1. Experimental Materials
Yunnan pine powder and Juglans Silillata Dode shell were dried at 105 °C for 5 h, ground to a 60-mesh powder, and placed in sealed containers for future use. AR reagents, such as MB, concentrated sulfuric acid, phosphoric acid, ZnCl2, and KOH, were purchased from Shanghai Titan Technology Co., Ltd., China. The raw materials were tested using a Shimadzu 20A high-performance liquid chromatography device (Table 1).
Table 1. Components of Different Biomass Feedstock.
| sample | cellulose (%) | hemicellulose (%) | lignin (%) | other (%) |
|---|---|---|---|---|
| walnut shells | 21.36 | 19.89 | 54.52 | 4.23 |
| Yunnan pine powder | 43.98 | 23.76 | 32.26 | 1.45 |
2.2. Preparation of Biochar
10 g of the biomass sample was heated in a tube furnace to raise the temperature to 550 °C at a rate of 5 °C/min in a nitrogen atmosphere. The temperature was maintained for 1 h for carbonization and then cooled to room temperature. The carbonized biomass was soaked in 30% activator (concentrated sulfuric acid, phosphoric acid, zinc chloride, or potassium hydroxide) at room temperature for 8 h, then washed with purified water to neutrality, dried at 105 °C, and placed in sealed containers until ready for use.
2.3. Characterization of Biochar
Infrared spectrometer MagnaIR-560E.S.P (Nicolet Company, United States) was used for FTIR analysis. A tableting method was used to mix and press the biochar powder and potassium bromide. The scanning range was 4000–400 cm–1, and the number of scans was 64. A K-Alpha XPS manufactured by Thermo Fisher Scientific of the United States was used to analyze the surface material composition, element content, and chemical state structure. A Zeiss Gemini300 scanning electron microscope was used to analyze the biochar appearance. A German Bruker D8 ADVANCE X-ray diffractometer with a scanning step of 0.02° was used. XRD test conditions were as follows: Cu Kα ray source, tube voltage of 40 kV, tube current of 40 mA, 2θ angle range 5–80°, and scan rate 2°/min. The specific surface area was measured using an ASAP2020 specific surface area and pore size analyzer (Micromeritics Corporation, USA). The specific surface area was regressed linearly using the BET equation. The pore volume of the micropores and mesopore of biochar were calculated using the BJH method and the density functional theory method, respectively.
2.4. Adsorption Test
The pigment model compound (MB) was used as an adsorbent for adsorption experiments, and the applicability of biomass-modified carbon as an adsorbent in walnut oil decolorization was studied. A 1000 mg/L of MB standard solution was prepared first and then diluted them into 50, 100, 150, 200, and 300 mg/L MB standard solutions. 0.5 g of the modified biochar and 100 mL of MB solution with a mass concentration of 300 mg/L were added into the Erlenmeyer flask and immersed and absorbed at 25 °C for 5, 15, 30, 60, 120, 240, 480 min, and the absorbance was measured after filtration. The adsorption capacity and removal rate were calculated, and the effect of adsorption time on the adsorption effect was compared. 100 mL of MB standard solution with a mass concentration of 50, 100, 150, 200, 300 mg/L was added into the conical flask, and then, 0.5 g of various types of the modified biochar were added. It was immersed and adsorbed at 25 °C for 8 h, the absorbance after filtration was measured, the adsorption capacity was calculated, and the effect of the initial mass concentration of MB solution on the adsorption effect was compared.
3. Results and Discussion
3.1. XRD Analysis of Biochar
Figure 1 shows the XRD spectra of different raw materials for baking charcoal. The characteristic absorption peaks of type I lignocellulose appeared in both biochar near 2θ = 22°, corresponding to the 101/002 diffraction absorption peak.37−39 After walnut shell biochar (WSC) acid treatment, the degree of graphitization of biochar at 2θ = 43° changed a little, but the degree of rock desertification of alkaline-treated WSC biochar increased. After acid–base treatment of wood powder biochar (WPC), the degree of graphitization of biochar treated with ZnCl2 decreased, but the degree of graphitization with other treatments increased significantly. After alkali treatment of WSC, crystallinity increased, and the alkali treatment dissolved the amorphous structure and improved the crystallinity. The crystallinity of all biochar decreased after WPC treatment, and the greatest decrease was for biochar after KOH treatment (Table 2).
Figure 1.
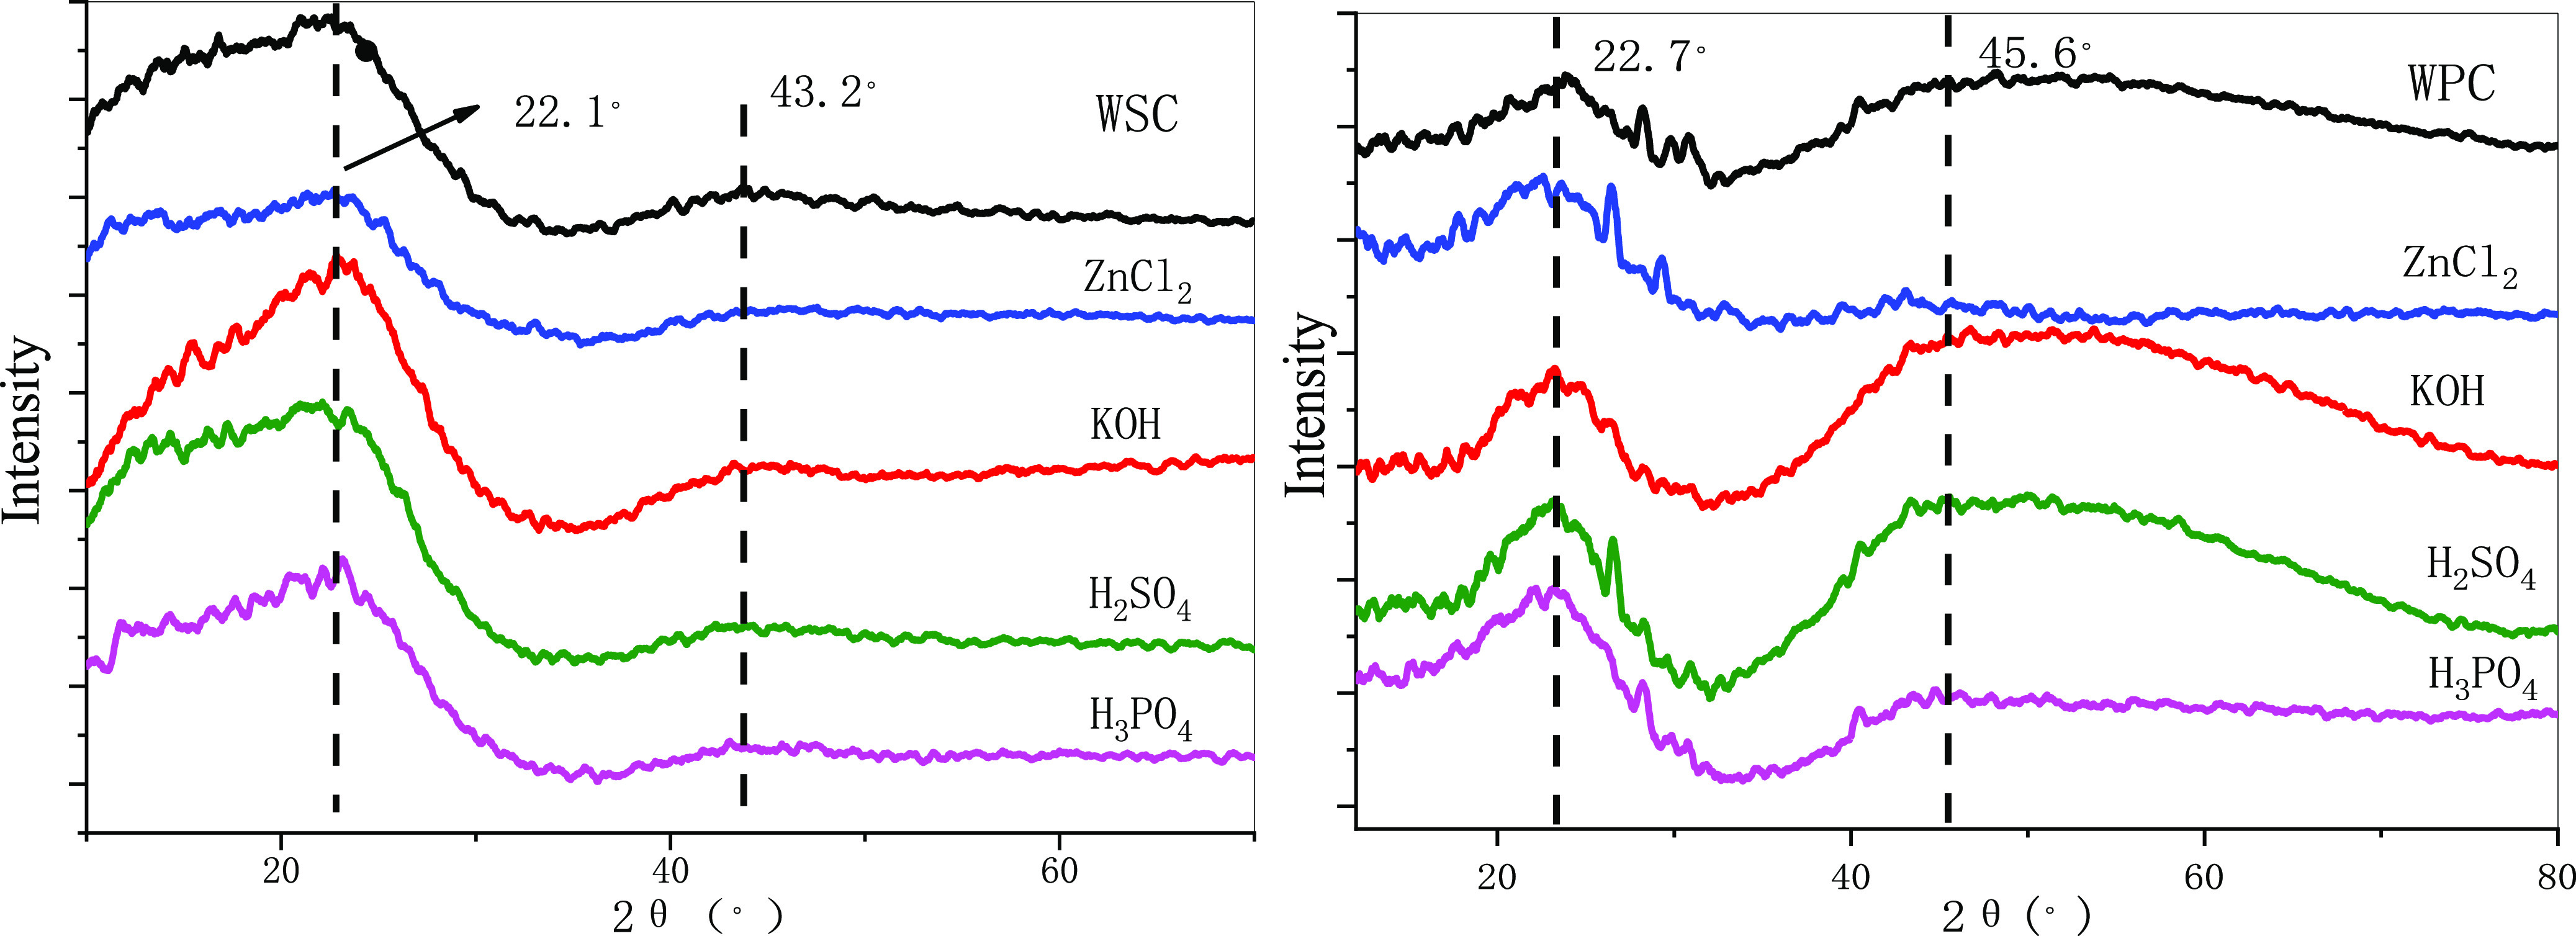
XRD spectrum of the modified biochar.
Table 2. Biochar Crystallinity and Particle Size.
| species | crystallinity (%) | particle size (nm) | species | crystallinity (%) | particle size (nm) |
|---|---|---|---|---|---|
| WSC | 56.47 | 3.87 | WPC | 79.47 | 9.11 |
| ZnCl2 | 58.18 | 3.84 | ZnCl2 | 77.28 | 4.03 |
| KOH | 70.04 | 3.65 | KOH | 55.33 | 10.44 |
| H2SO4 | 52.33 | 3.73 | H2SO4 | 66.79 | 8.71 |
| H3PO4 | 54.24 | 3.79 | H3PO4 | 76.72 | 4.32 |
3.2. SEM Analysis of Apparent Morphology
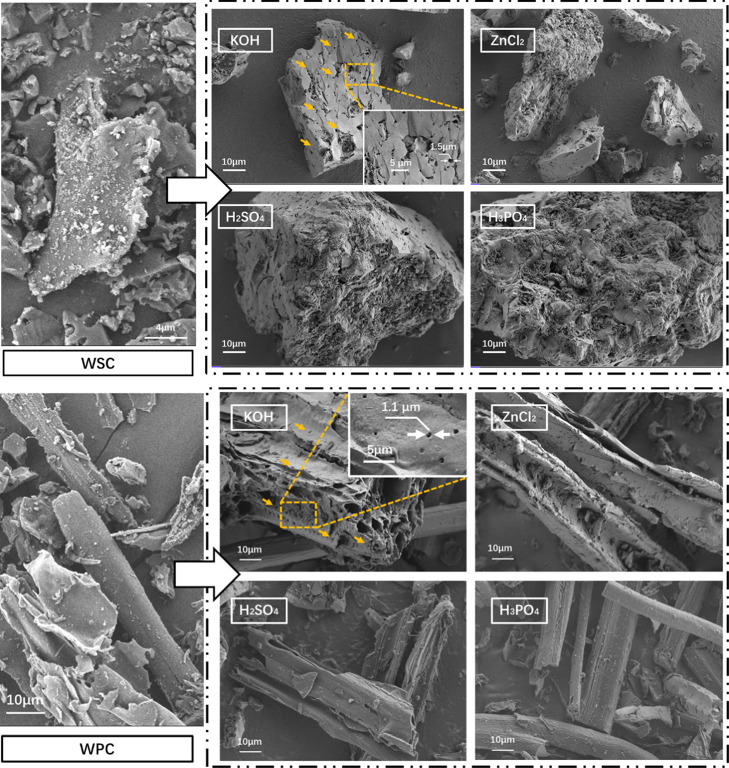
As shown in Figure 2, the surface structure of biochar changed after modified treatment. Before being modified, WSC had a non-smooth surface and many small particles, and its pores were rarely observed. After KOH-modified treatment, the surface of the carbon material was smooth, a large number of large pores were generated on the surface, and its specific surface area increased. However, the carbon treated with ZnCl2, H2SO4, and H3PO4 acidic modified was too acidic, resulting in serious corrosion and collapse of the pore structure of the surface such that the pore structure was rarely observed. Charcoal materials are generally fibrous.40,41 The surface smoothness of unmodified (WPC, WSC) materials was poor, and pore structure was rarely observed. When KOH was used as an activator, pores of different sizes were evenly generated on the surface, and large pore structures appeared on the surface. The carbon materials modified by the three acidic modified had improved surface finish and fewer surface pore structures. When combining the functions of the four modified on the two biomass materials, the modified improved the finish of the carbon material and reduced its ash content. The alkaline activator was more conducive to the formation of pores in the biomass-modified biochar material.
Figure 2.
SEM of the modified biochar surface structure.
3.3. Pore Structure Analysis
As shown in Figure 3 and Table 3, the isotherms of the five types of WPC appeared as type I isotherm adsorption lines without obvious hysteresis loops. From the pore size distribution diagram, it can be seen that the pore size of the WPC material was mostly distributed between 1 and 15 nm. In addition, different treatment reagents had different effects on the texture properties of the carbon materials. After modification by KOH and ZnCl2, the pore size was mainly mesoporous and, with the other reagents, was mainly macropores. Moreover, the specific surface area increased appreciably—712.07 and 534.40 m2/g for KOH and ZnCl2, respectively, laying a foundation for the later adsorption. However, after H3PO4 and H2SO4 modified and modification, the specific surface area was reduced. Due to the low acidity, the modified performance was poor and the deliming degree was low; thus, the specific surface area and pore size were relatively low. The wood material was loose, had many volatile components, and produced tar during pyrolysis, which blocked the pores of the charcoal. According to the electron microscope data, the unactivated charcoal had a small number of surface pores, which generally made the specific surface area smaller. Modified by potassium hydroxide resulted in better reactions with substances in the wood pores to make pores. The acidic activator was usually easier to react with the amorphous cellulose in the wood, thereby corroding the wood, collapsing the pores, and reducing the specific surface area, as consistent with the SEM data.
Figure 3.
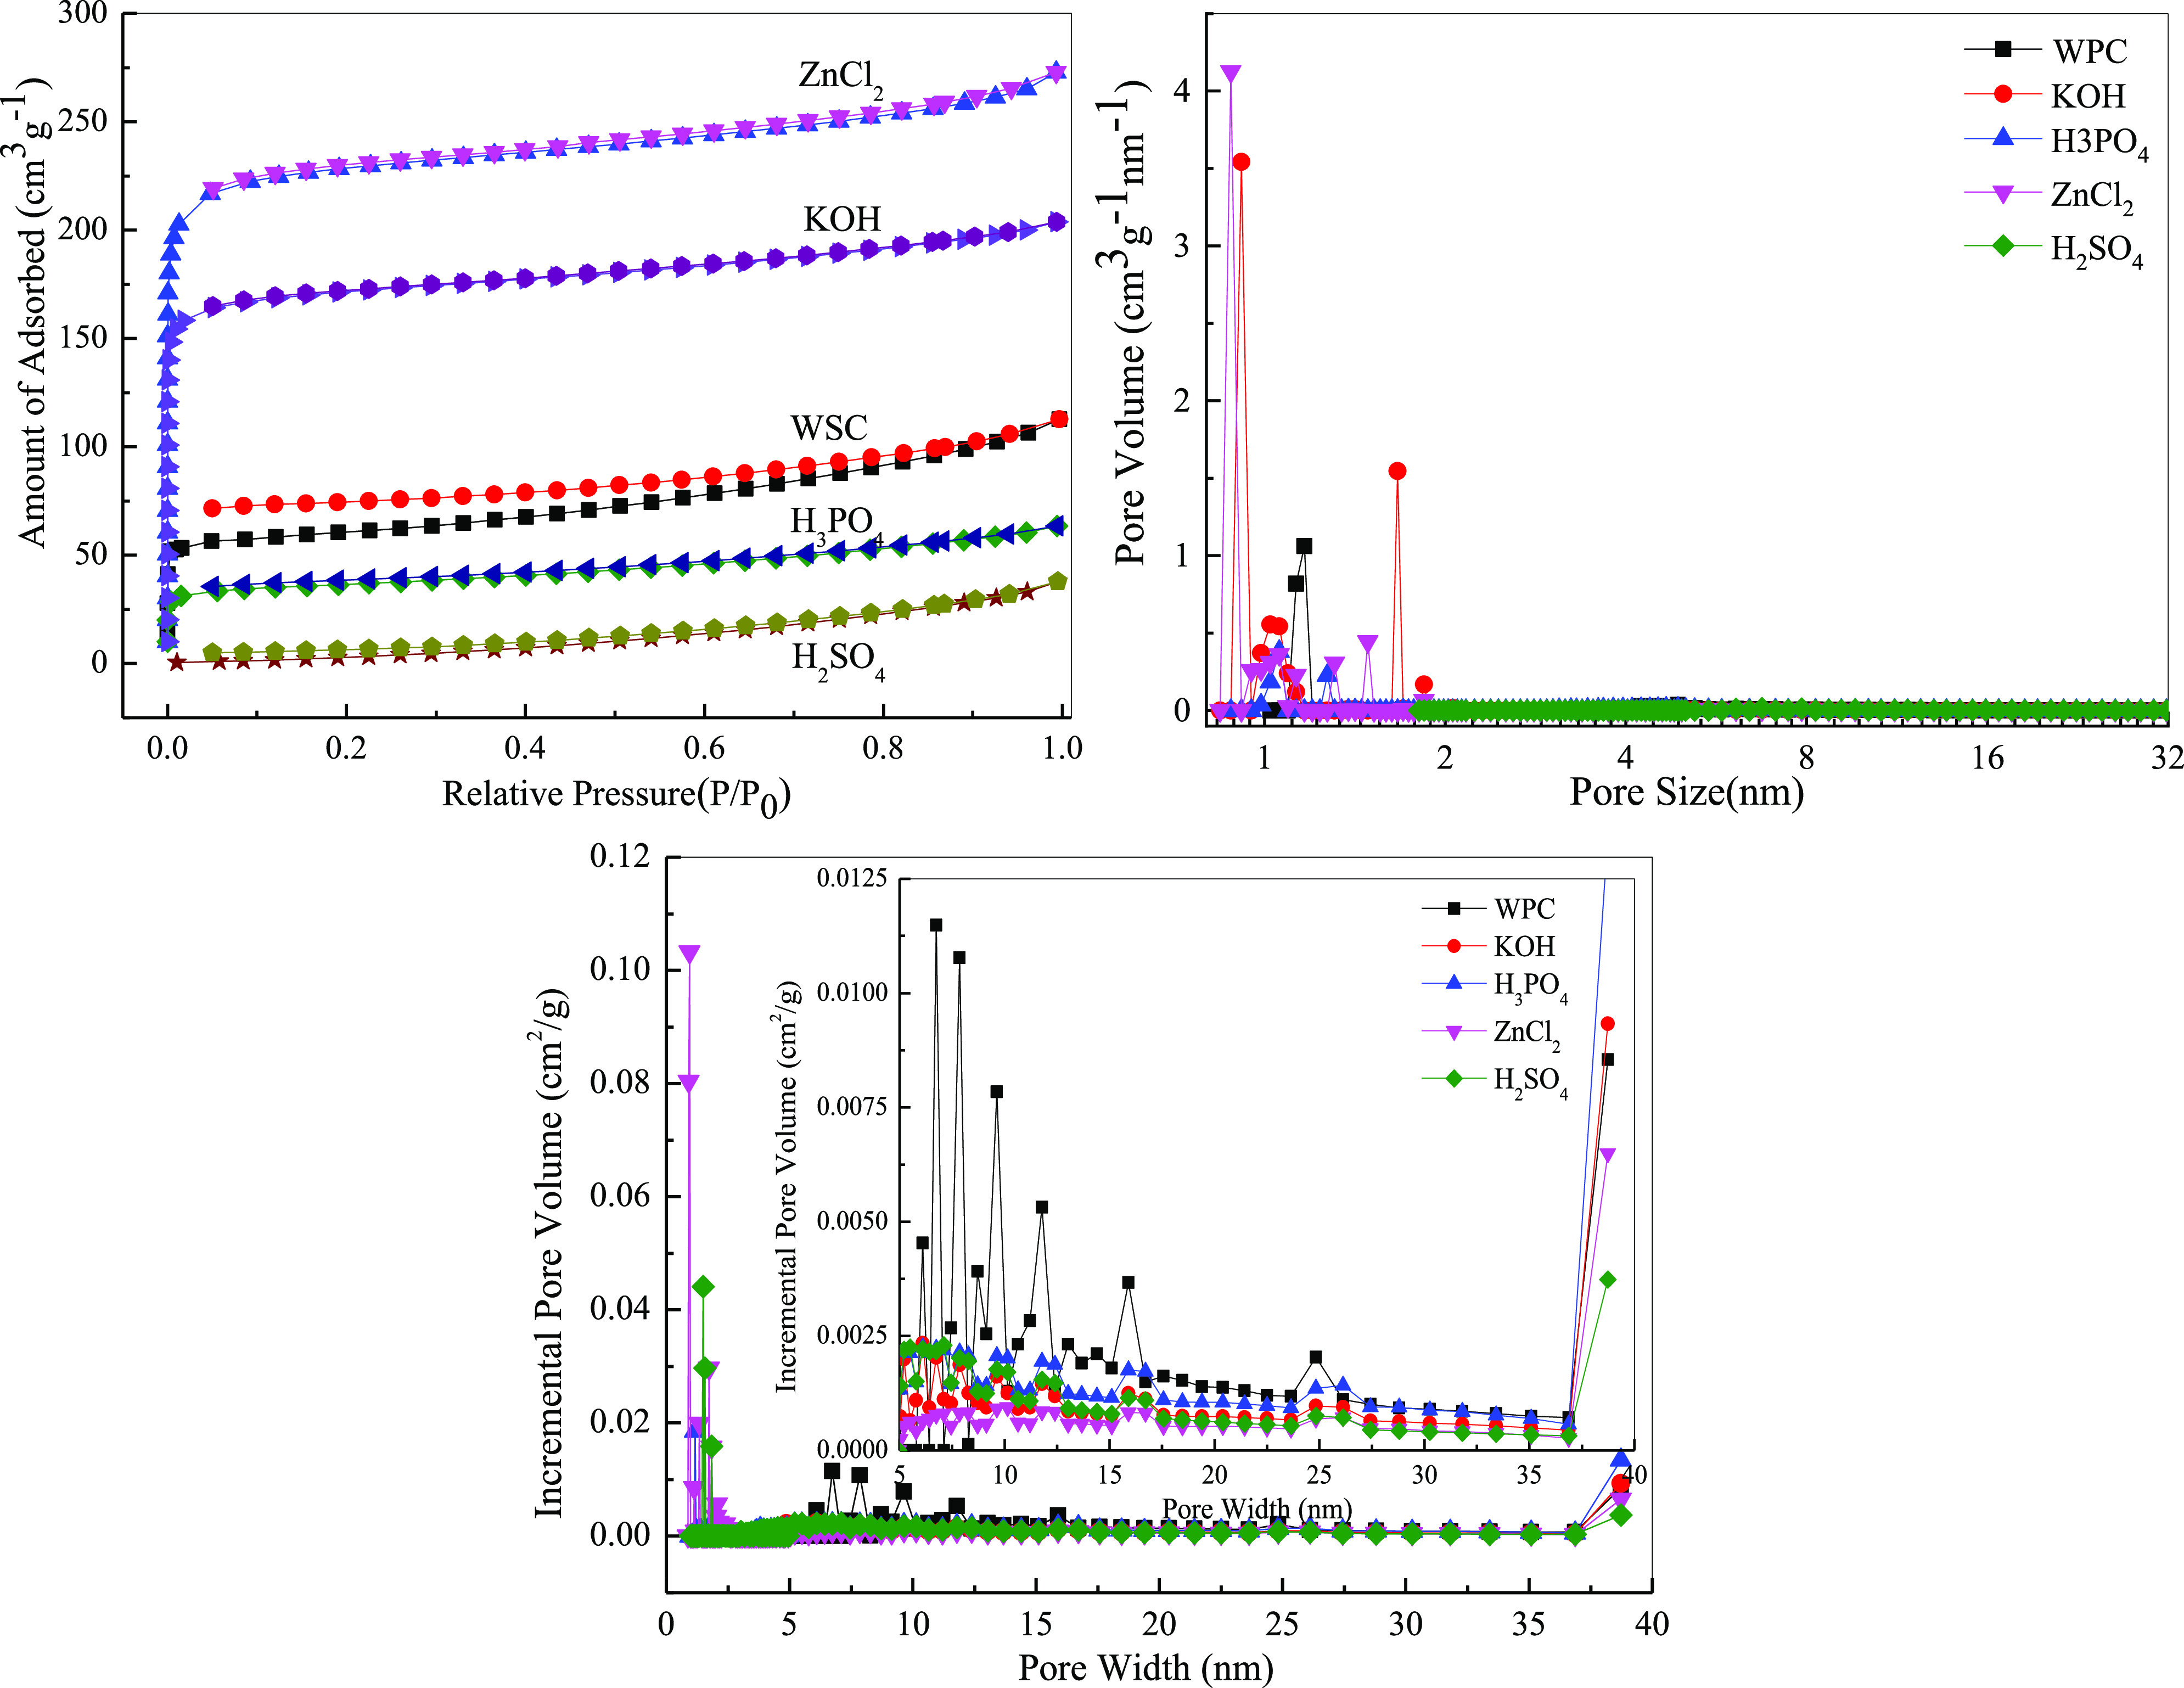
N2 adsorption-analysis isotherm and pore size distribution of different WPC biochar.
Table 3. Effect of Different Treatment Reagents on Texture Performance.
| sample | specific surface area (m2/g) | total pore volume (cm3/g) | average pore size (nm) |
|---|---|---|---|
| WPC | 194.77 | 0.1623 | 3.45 |
| KOH | 712.07 | 0.4082 | 2.41 |
| H3PO4 | 117.64 | 0.0926 | 3.19 |
| ZnCl2 | 534.40 | 0.3086 | 2.35 |
| H2SO4 | 114.38 | 0.0495 | 4.34 |
It can be seen from Figure 4 and Table 3 that the five carbon materials belonged to the type I adsorption isotherm curve, and there were no hysteresis loops caused by the capillary condensation effect, indicating that the pore diameter of the nitrogen gas adsorbed inside the material was small, and the adsorption effect was very different when adsorption and desorption were small. The pore size distribution diagram showed that the pore size of the carbon material was mostly distributed between 1 and 10 nm. The highest specific surface area was the KOH-modified biochar, with a specific surface area of 983.75 m2/g. H3PO4 modified resulted in the next highest specific surface area, while ZnCl2-and H2SO4-activated materials had lesser but similar specific surface areas. The specific surface area of unactivated WSC was at least 116.6 m2/g. At the same time, through comparison, the specific surface area of WSC was greater than that of WPC.
Figure 4.
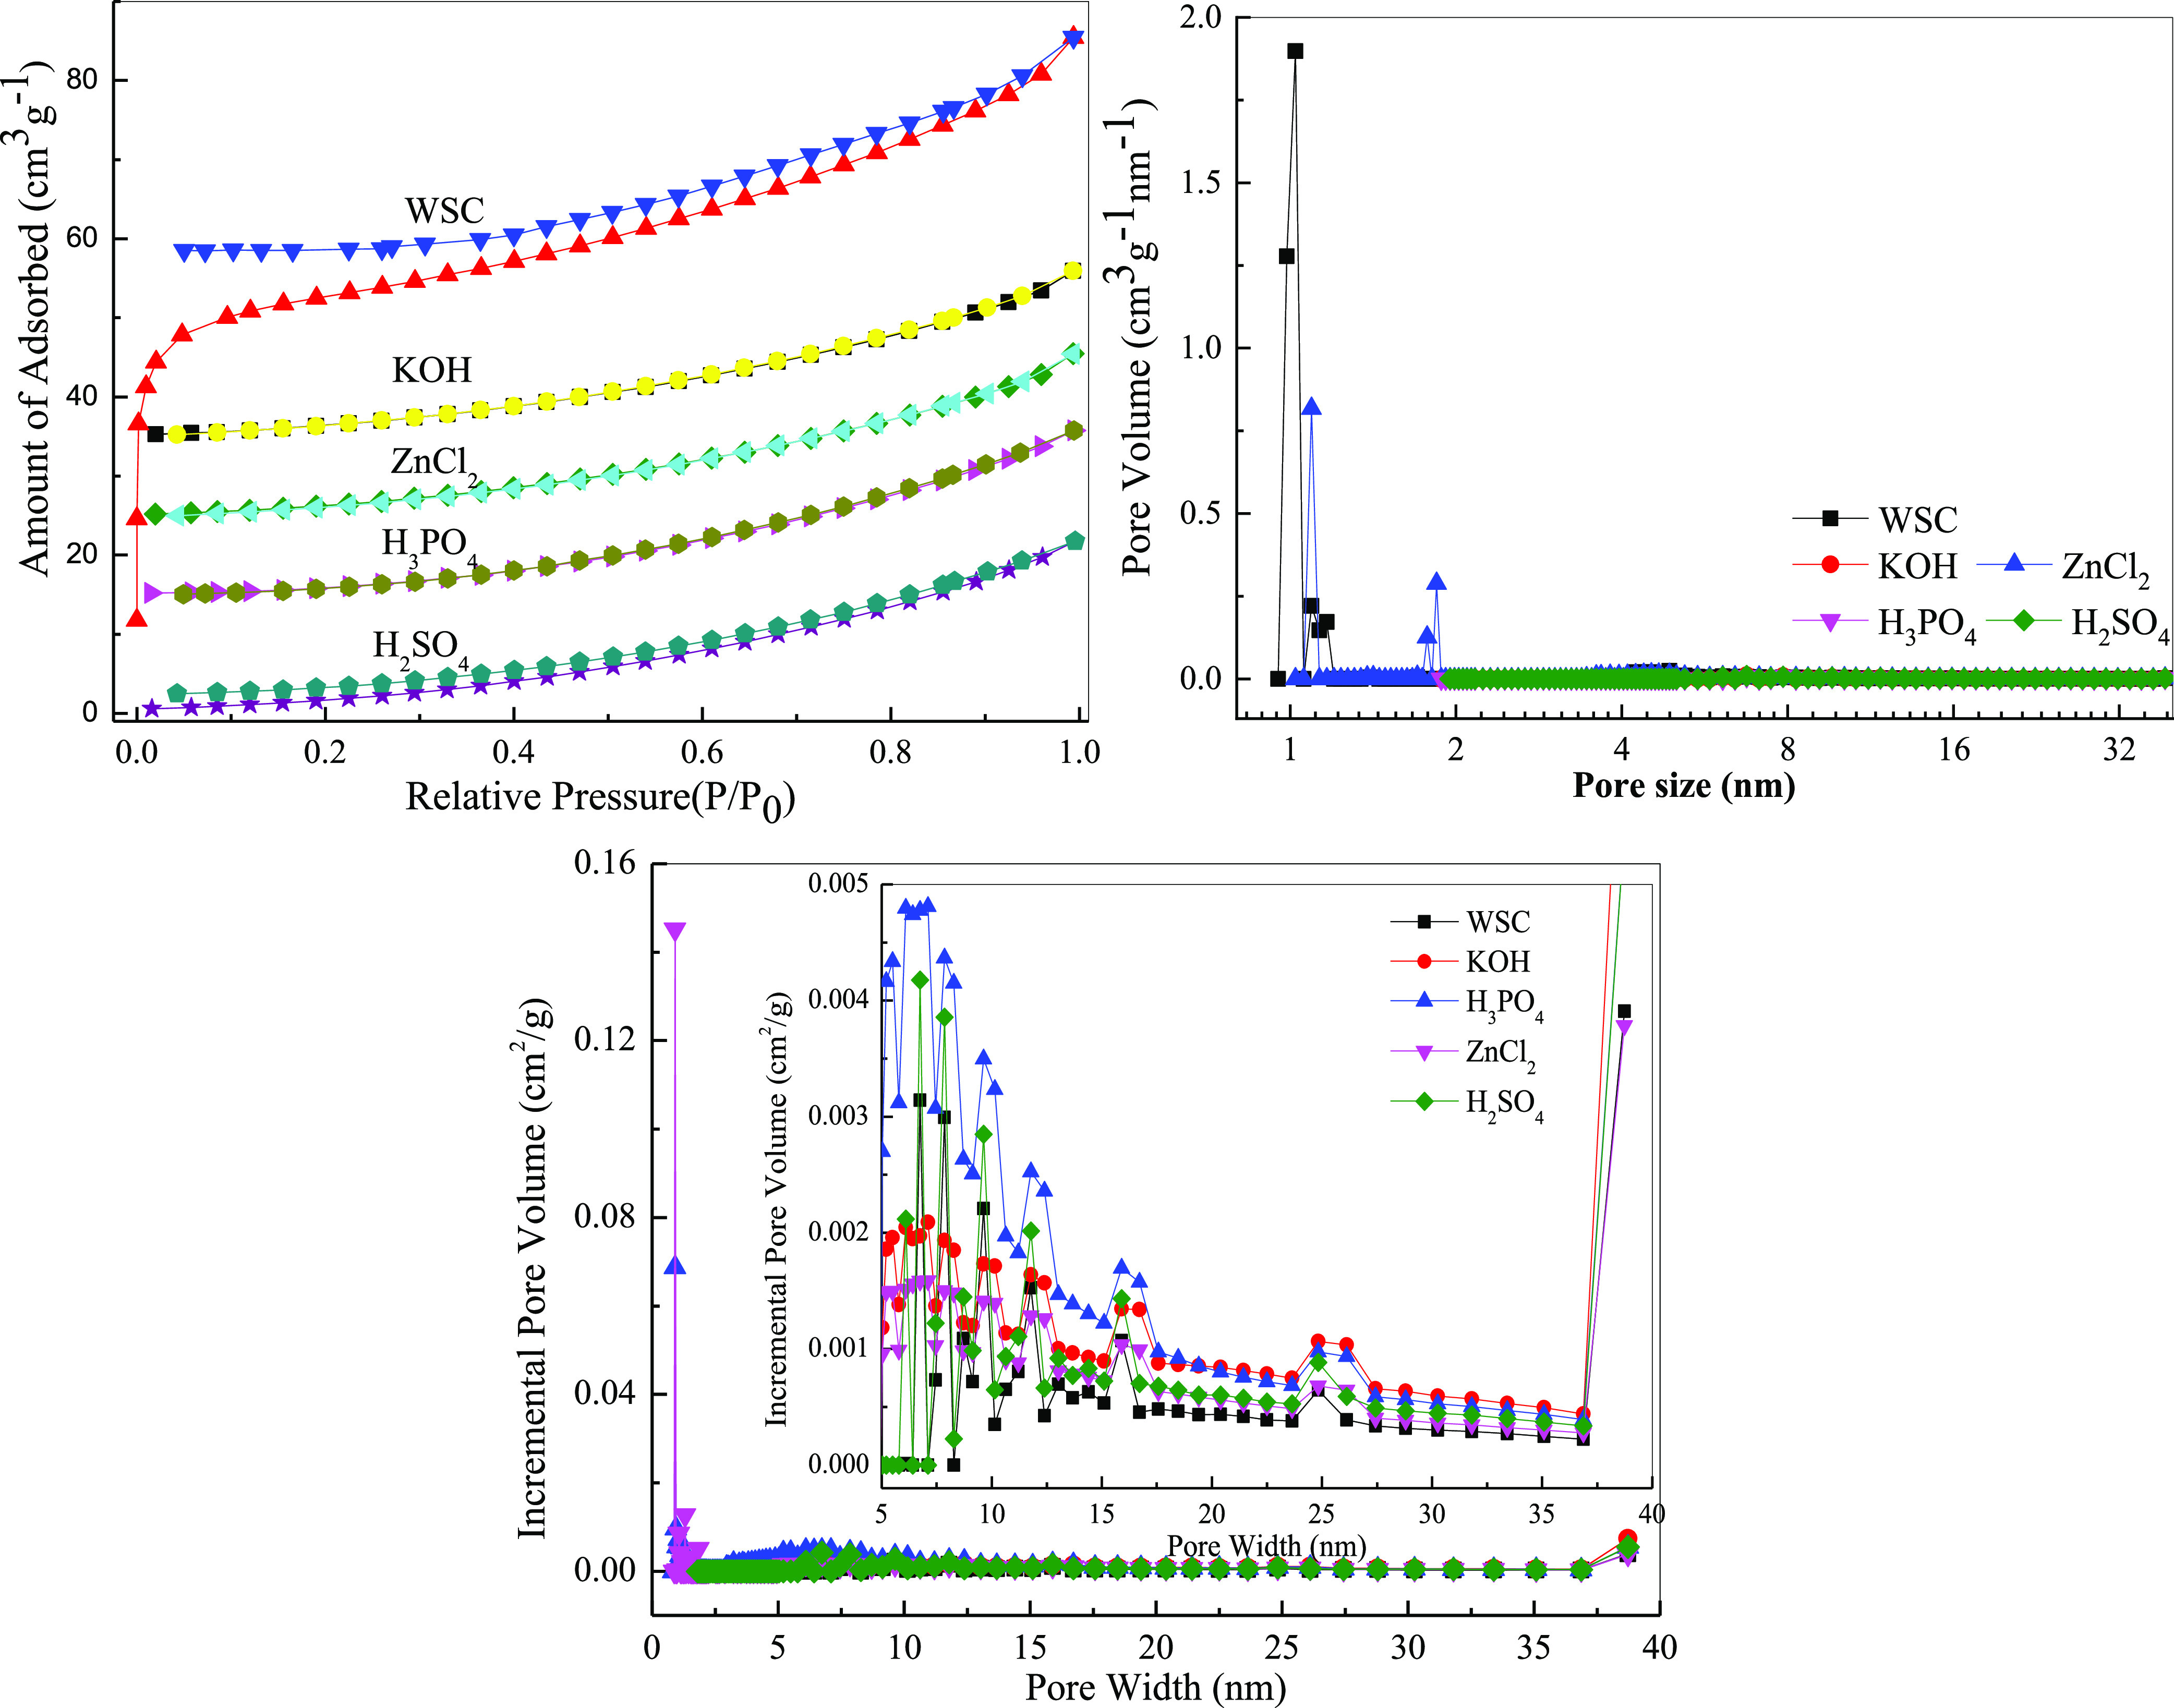
N2 adsorption-analysis isotherms and pore size distribution of different WSC biochar.
3.4. Analysis of Physical and Chemical Properties of Biochar
Figure 5a,b shows the FTIR spectra of biochar before and after adsorption. The infrared peaks of several bioactive carbons were similar while the intensities were different. The characteristic stretching vibration peak of −OH was near 3400 cm–1, the characteristic stretching vibration absorption peak of carboxyl and carbonyl groups (C=O) was near 1620 cm–1, and the characteristic stretching vibration peak of C=C was at 1420 cm–1. A large number of aromatic compounds were formed during biocharization, and the aromatic substances formed by WPC-based carbon were higher than those formed by WSC-based materials. The absorption vibration peak of Si–O–Si was near 1060 cm–1, caused by a small amount of Si material present in the biomass. From the graph analysis, the characteristic peak intensity of −OH increased after modified treatment, indicating that after acid–base modification, the oxygen-containing functional groups on the biochar surface increased. In addition, the absorption vibration peak intensity of Si–O–Si near 1060 cm–1 weakened. In general, biochar was rich in oxygen-containing groups and contained aromatic structural substances. These oxygen-containing groups provided certain active sites for the adsorption of organic matter, which could promote the adsorption of biochar.
Figure 5.
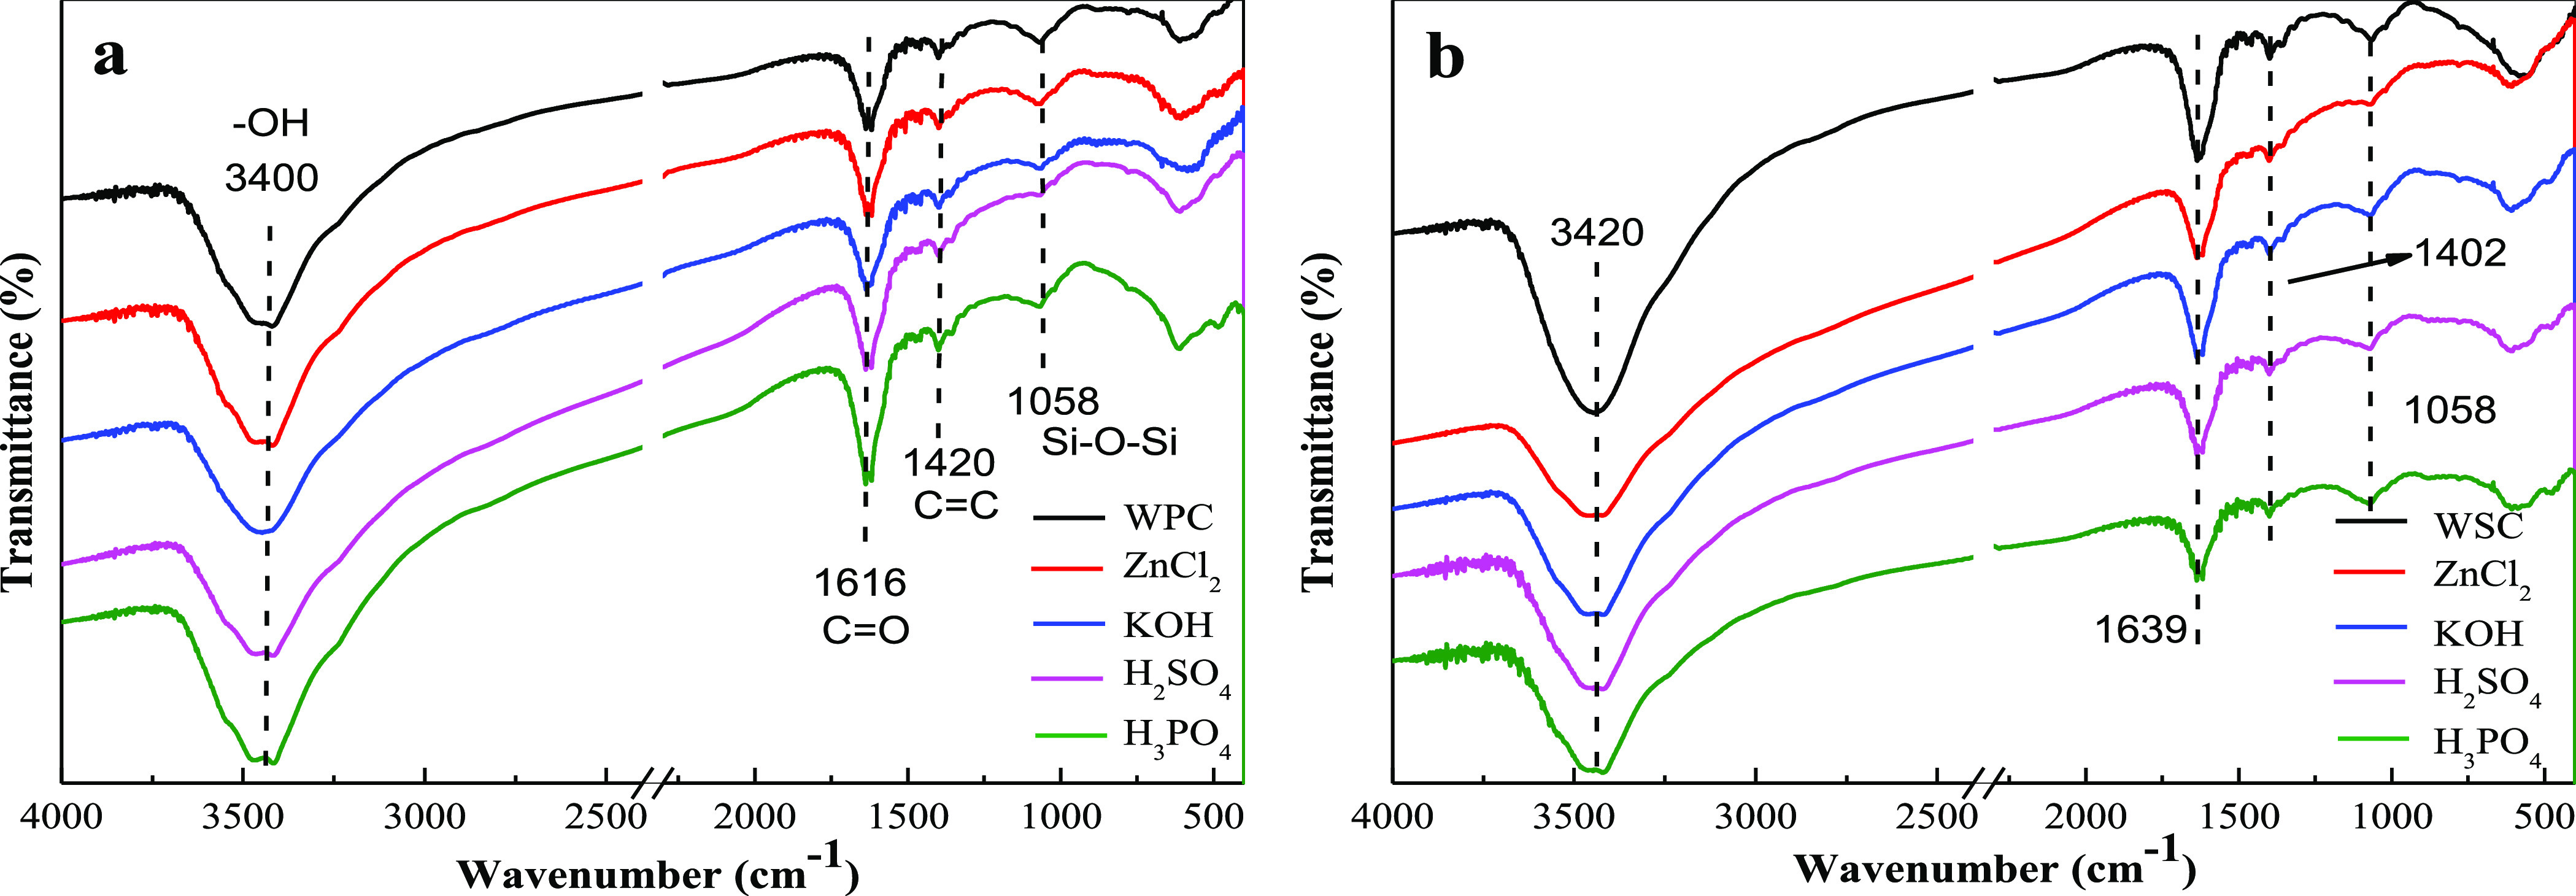
FTIR spectra of different modified biochar [(a) WPC and modified WPC; (b) WSC and modified WSC].
3.5. XPS Analysis of Biochar
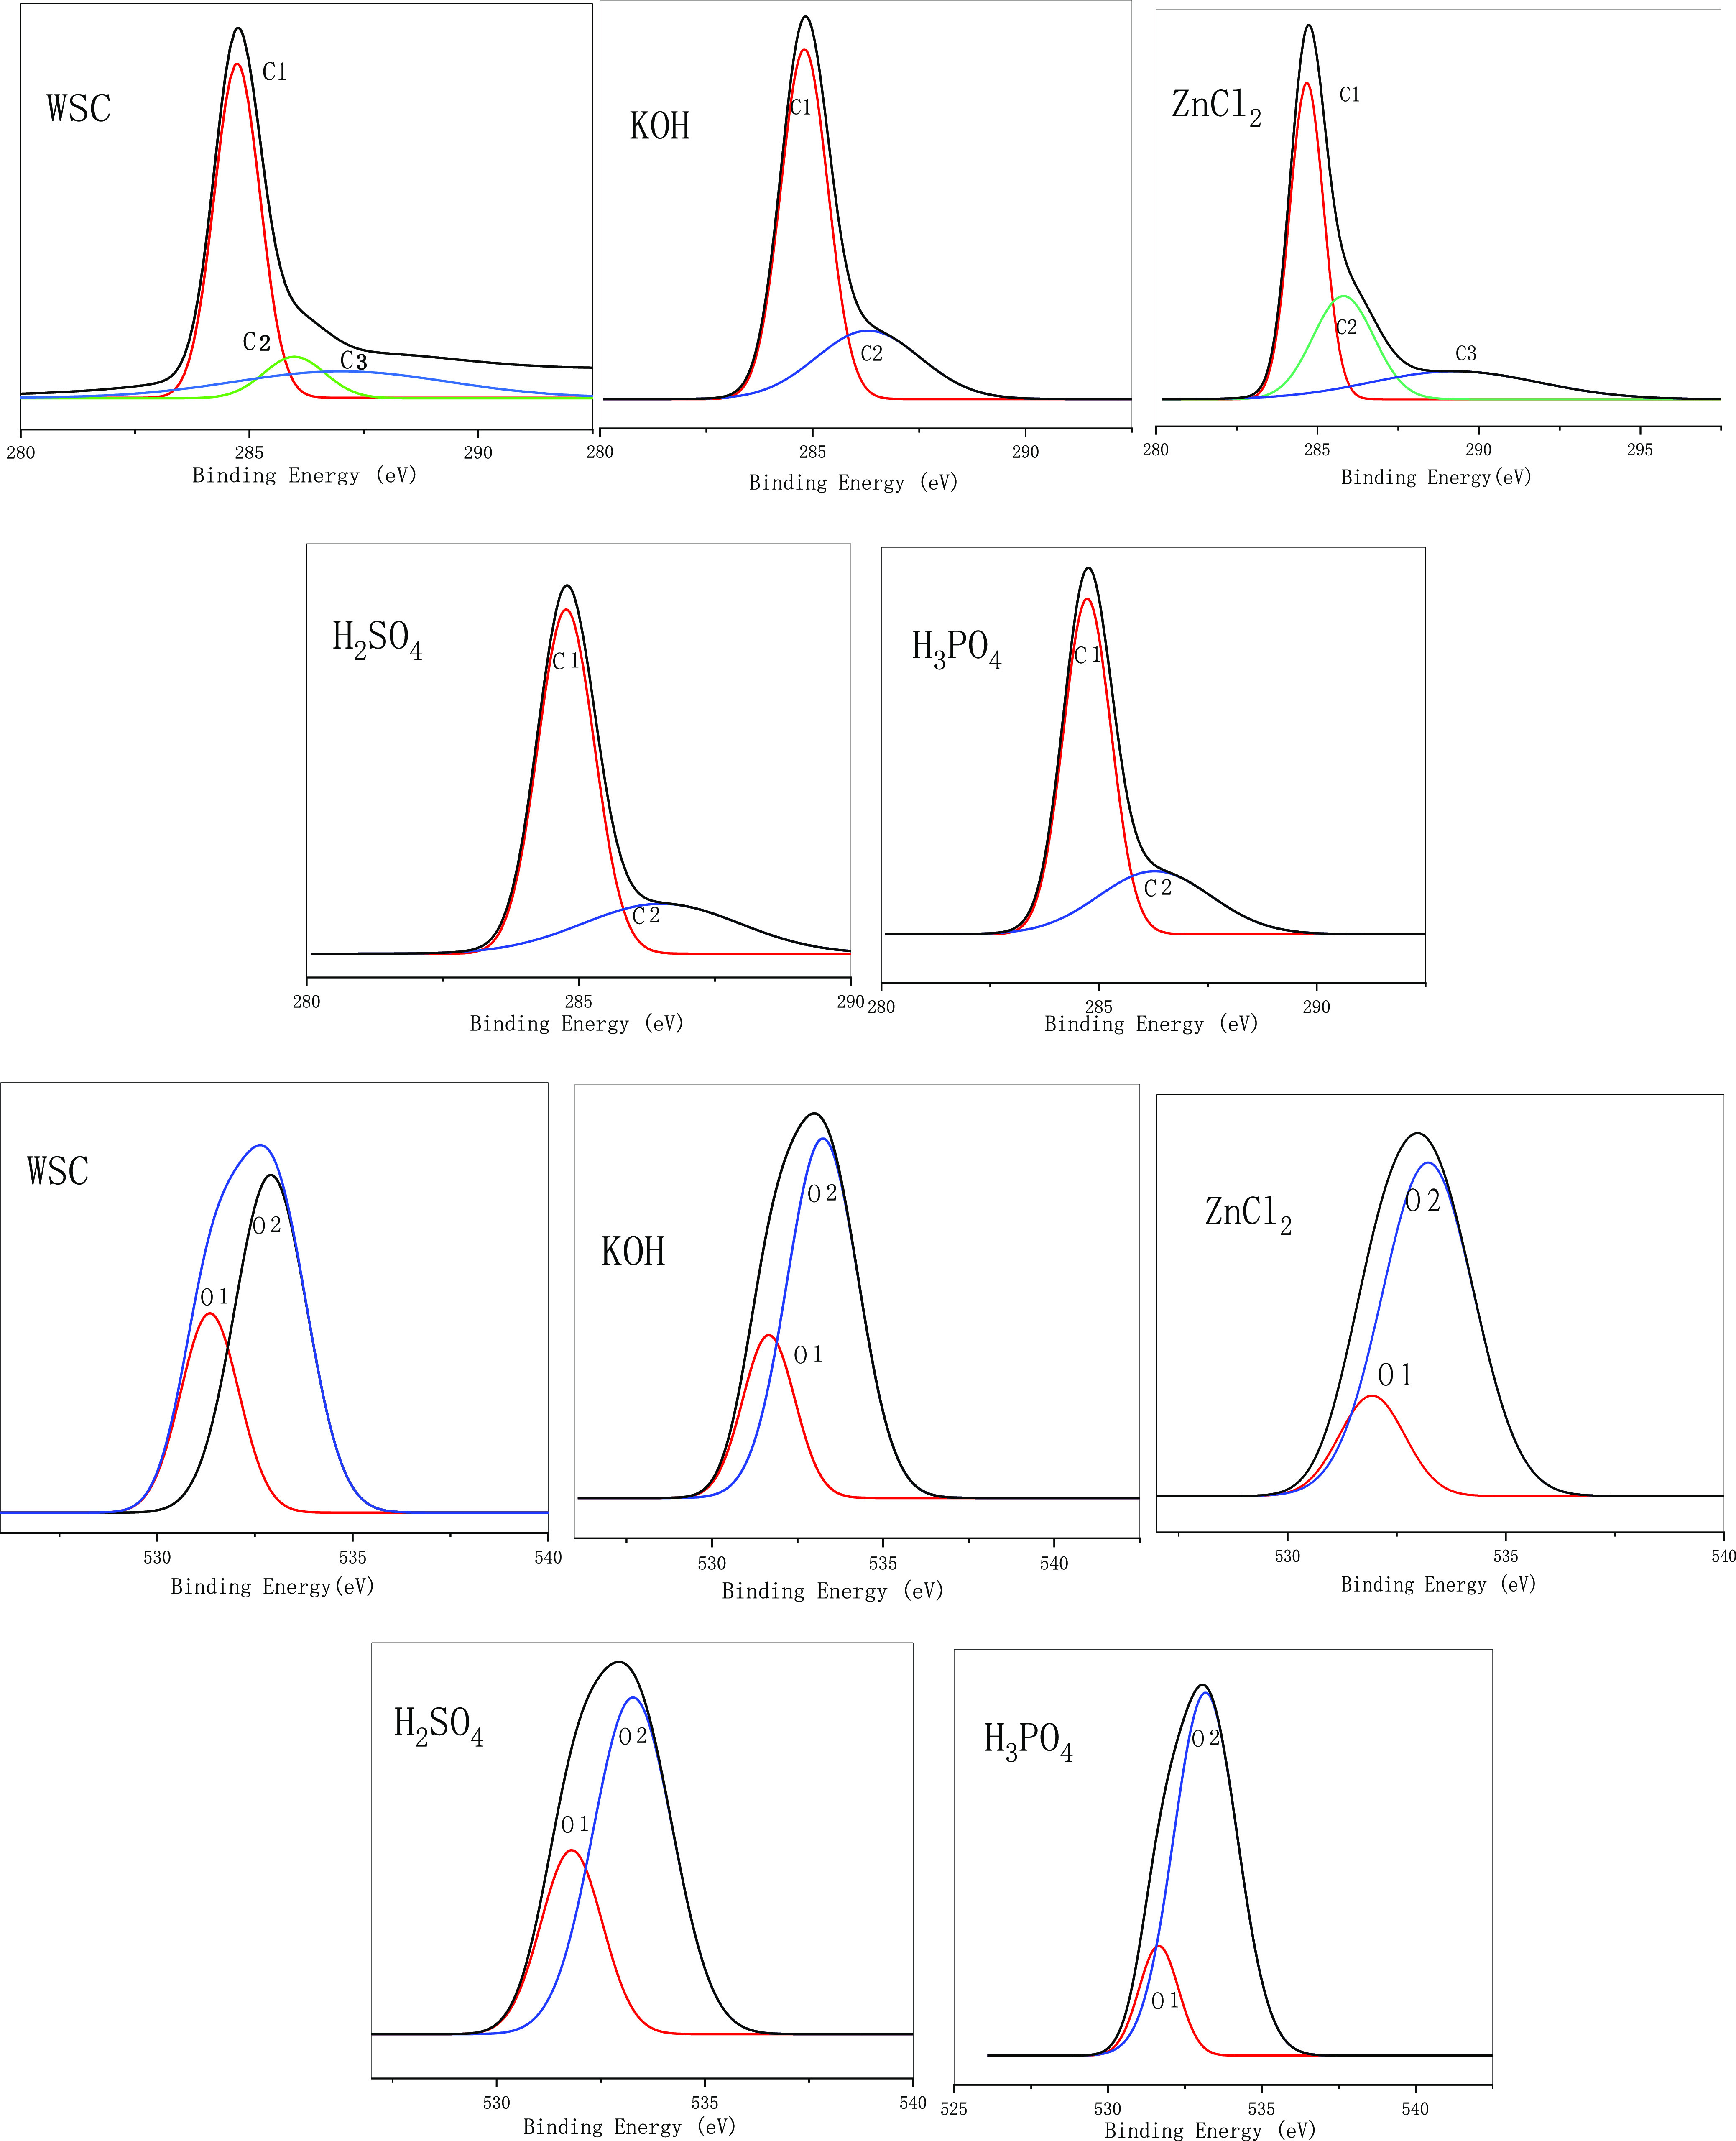
As shown in Figure 6 and Tables 5 and 6, after the WSC was activated and modified using four types of reagents, the carbon content decreased, and the O element content increased. However, the carbon content of the KOH-treated biochar was the highest, and the other phases were not much different because K ions were stored in the internal voids of the material during the modified process, thereby increasing the content. Similarly, the Zn element content was the highest for ZnCl2. Tables 5 and 6 show that after modified treatment, the combination of C and O on the surface of walnut biochar had changed, mainly based on the combination of C–C (C1) and C–O (C2). After modified treatment (except with ZnCl2), the C–C bond content of the modified biochar increased, that is, the non-carbohydrate content increases. C2 is generally considered to be the characteristic peak position of esters (C–O) generated by hydroxyl groups on cellulose and hemi-fibers. The decrease in its content indicated that the cellulose and hemicellulose contents of the material decreased. The increase in the C2 content represented the dehydration of hydroxyl groups on the material surface. Hydrogen formed an ester bond, and non-polarity was enhanced. The modified biochar prepared by ZnCl2 treatment produced a large amount of C=O (C3). The production of C3 was due to the high oxidation state of C in the C=O and HO–C–OH structures,42 which produced a large number of ketones. Therefore, as observed from the chemical structure of each component, the modified treatment caused the material surfaces to lose a large number of oxygen-containing functional groups.43
Figure 6.
XPS spectrum of different WSC biochar.
Table 5. Total Element Ratio of WSC Biochar.
| sample | C (%) | O (%) | K (%) | Zn (%) |
|---|---|---|---|---|
| WSC | 87.82 | 11.92 | 0.25 | 0.01 |
| KOH | 85.87 | 13.61 | 0.48 | 0.05 |
| ZnCl2 | 79.07 | 16.79 | 0.07 | 4.07 |
| H2SO4 | 86.84 | 12.99 | 0.16 | 0.01 |
| H3PO4 | 86.54 | 13.36 | 0.08 | 0.03 |
Table 6. WSC C 1s and O 1s XPS Data.
| peak position |
content % |
peak position |
content % |
||||||||
|---|---|---|---|---|---|---|---|---|---|---|---|
| sample | C1 | C2 | C3 | C1 | C2 | C3 | O2 | O1 | O2 | O1 | nO2/nO1 |
| WSC | 284.71 | 285.98 | 287.01 | 65.17 | 10.79 | 24.04 | 531.35 | 532.91 | 32.25 | 67.75 | 0.47 |
| KOH | 284.80 | 286.30 | 69.76 | 30.25 | 531.66 | 533.24 | 24.88 | 75.12 | 0.33 | ||
| ZnCl2 | 284.67 | 285.8 | 289.25 | 49.42 | 28.93 | 21.65 | 531.93 | 533.22 | 17.66 | 82.34 | 0.21 |
| H2SO4 | 284.76 | 286.51 | 71.29 | 28.71 | 531.80 | 533.27 | 29.66 | 70.34 | 0.42 | ||
| H3PO4 | 284.71 | 286.28 | 69.32 | 30.68 | 531.65 | 533.17 | 15.90 | 84.10 | 0.19 | ||
Table 4. Effect of Different Treatment Reagents on Texture Performance.
| sample | specific surface area (m2/g) | total pore volume (cm3/g) | average pore size (nm) |
|---|---|---|---|
| WSC | 116.63 | 0.0927 | 2.67 |
| KOH | 983.75 | 0.2653 | 2.11 |
| H3PO4 | 736.62 | 0.2895 | 2.43 |
| ZnCl2 | 209.18 | 0.1089 | 2.85 |
| H2SO4 | 198.77 | 0.0862 | 3.26 |
The O1 content (−C–O) in the raw material was large, and the O2 content (C=O) was small. The change in the O2 peak area was due to the increase in the number of carbonyl groups produced by the oxidation and condensation of lignin during the baking pretreatment process. The O1 peak area was due to the dehydration reaction of cellulose during the baking pretreatment and the degradation reaction of hemicellulose resulting in a reduction in the number of oxygen-containing functional groups in the wood. The O1 content of the activated walnut shell char increased, and the O2 content decreased. The analysis showed that the condensation reaction decreased during the modified process of the walnut shell char, and the dehydration reaction increased.
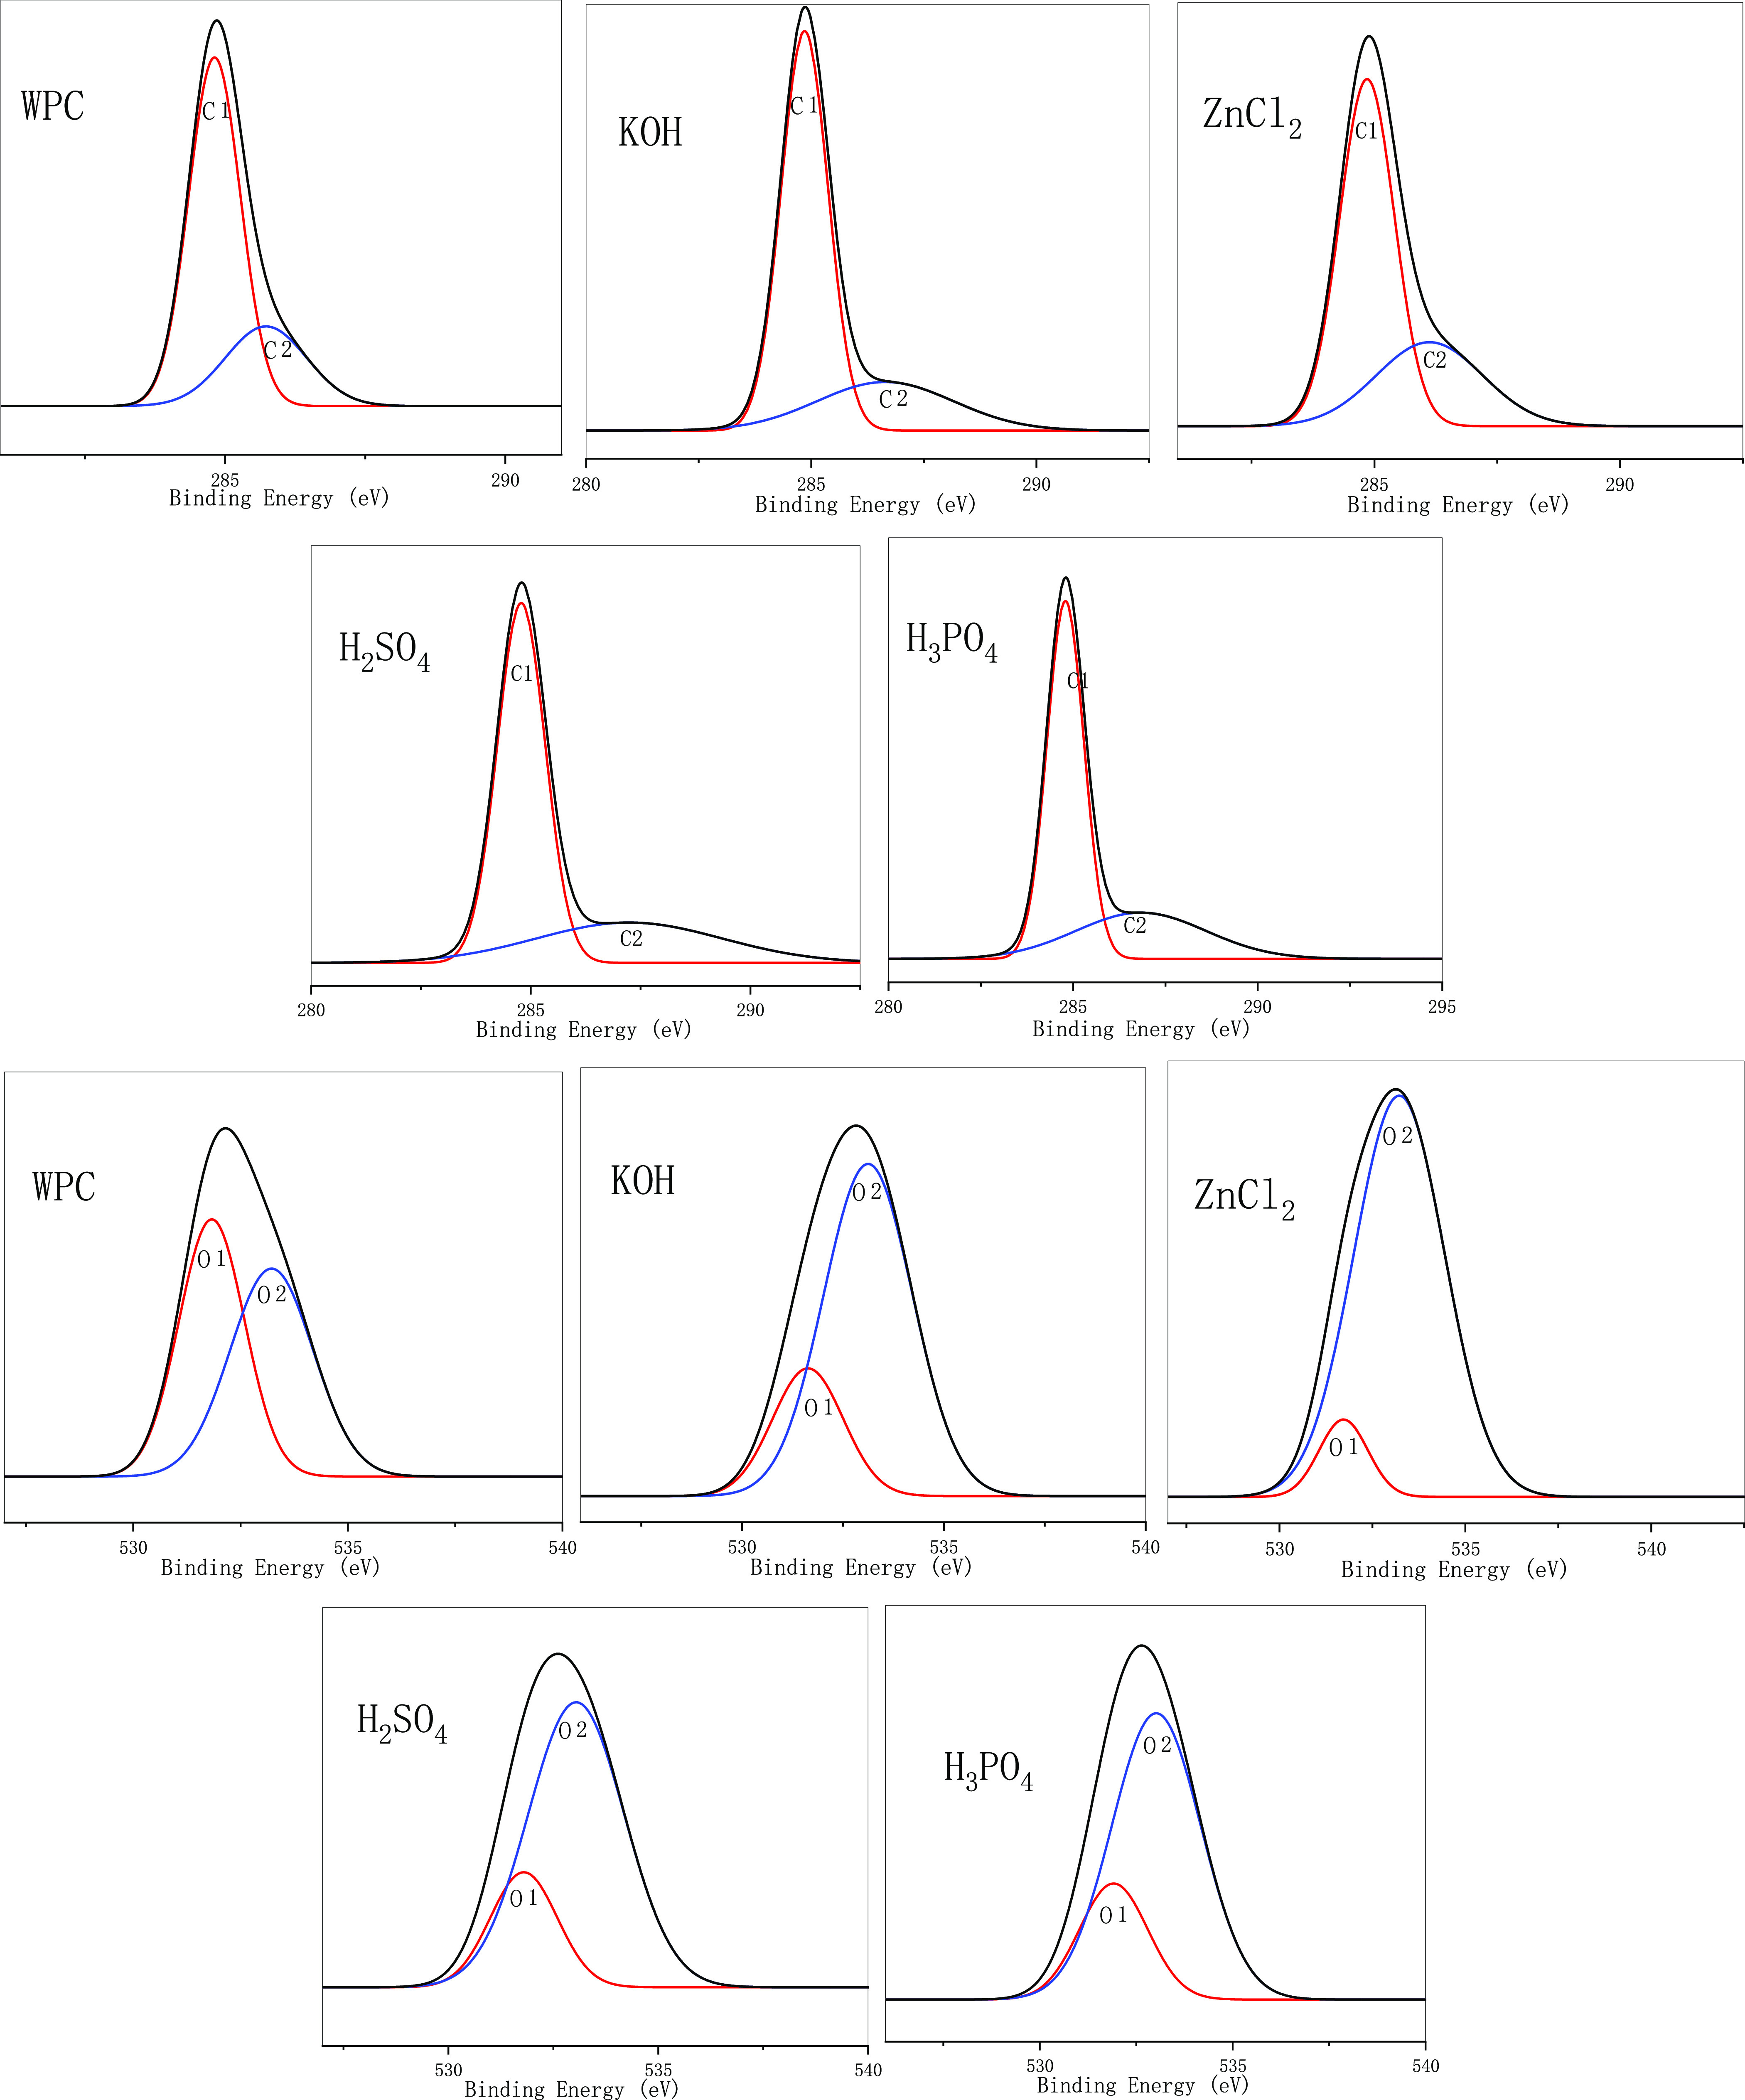
As shown in Figure 7, Tables 7 and 8, after the wood charcoal was activated and modified using four types of reagents, the C element content increased, while the O element content decreased. The K content was highest in the carbon material treated with KOH as the activator and showed few differences between other treatments. This was because K ions were stored in the internal voids of the material during the modified process, thereby increasing the content. Similarly, the Zn content was the highest for ZnCl2-modified biochar. As shown in Tables 3–6, after modified treatment, the C and O binding methods on the biochar surface had changed, mainly C–C (C1) and C–O (C2) combinations. After modified treatment, the C–C bond content of the modified biochar decreased, except for KOH treatment, while C–O increased, that is, the non-carbohydrate content increased. C2 is generally considered to be the characteristic peak position of esters (CO) generated by hydroxyl groups on cellulose and hemi-fibers. The decrease in its content indicated that the cellulose and hemicellulose contents in the material decreased. The increase in C2 content showed the dehydration of hydroxyl groups on the material surface. Hydrogen formed an ester bond, and the non-polarity was enhanced. After modified treatment, the modified biochar C2 content was increased. The modified biochar prepared by H2SO4 produced a large amount of C=O (C3). The production of C3 was due to the high oxidation state of C in the C=O and HO–C–OH structures, which produced a large amount of ketones. Analysis showed that the strong oxidation of sulfuric acid led to an increase in double bonds. In general, it can be observed from the chemical structure of each component that the modified treatment caused the material surface to lose a large number of oxygen-containing functional groups.43,44
Figure 7.
XPS spectrum of different WPC biochar.
Table 7. Proportion of Total Elements of WPC Biochar.
| sample | C (%) | O (%) | K (%) | Zn (%) |
|---|---|---|---|---|
| WPC | 79.41 | 15.81 | 4.69 | 0.09 |
| KOH | 89.80 | 9.65 | 0.51 | 0.03 |
| ZnCl2 | 86.91 | 11.91 | 0.06 | 1.13 |
| H2SO4 | 90.34 | 9.53 | 0.13 | 0.01 |
| H3PO4 | 90 | 9.74 | 0.25 |
Table 8. C 1s and O 1s XPS Data of WPC Biochar.
| C peak position |
C content % |
O peak position |
O content % |
||||||||
|---|---|---|---|---|---|---|---|---|---|---|---|
| sample | C1 | C2 | C3 | C1 | C2 | C3 | O2 | O1 | O2 | O1 | nO2/nO1 |
| WPC | 284.81 | 285.73 | 73.58 | 26.46 | 531.83 | 533.22 | 49.38 | 50.62 | 0.97 | ||
| KOH | 284.85 | 286.64 | 73.97 | 26.03 | 531.63 | 533.12 | 23.37 | 76.63 | 0.31 | ||
| ZnCl2 | 284.85 | 286.12 | 68.05 | 31.95 | 531.72 | 533.22 | 9.35 | 90.65 | 0.10 | ||
| H2SO4 | 284.78 | 287.24 | 69.79 | 30.21 | 531.80 | 533.04 | 21.92 | 78.08 | 0.28 | ||
| H3PO4 | 284.79 | 286.64 | 68.80 | 31.20 | 531.91 | 533.02 | 23.69 | 76.31 | 0.31 | ||
The O1 content (−C–O) in the raw material was large, and the O2 content (C=O) was small. The change in the O2 peak area was due to an increase in the number of carbonyl groups produced by the oxidation and condensation of lignin during the baking pretreatment process. The O1 peak area was due to the dehydration reaction of cellulose during the baking pretreatment and the degradation reaction of hemicellulose, resulting in the reduction of the number of oxygen-containing functional groups in the wood. The O1 content of the activated charcoal powder increased, while the O2 content decreased. Analysis showed that during the charcoal modified process, the condensation reaction occurred less and the dehydration reaction increased.
3.6. Effects of Adsorption Process Conditions on the Adsorption Properties of MB
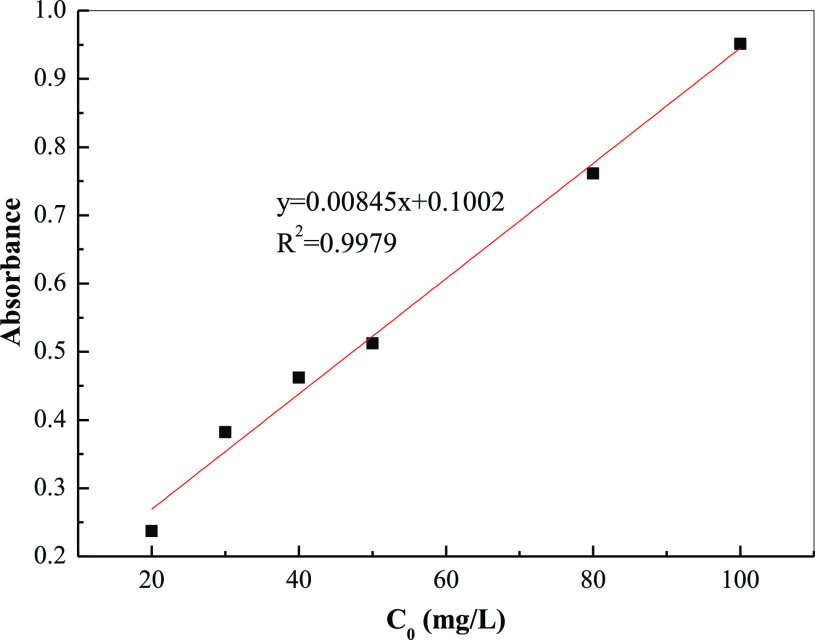
Figure 8 shows the standard curve of MB, with standard solutions with concentrations of 20, 30, 40, 50, 80, and 100 mg/L using a spectrophotometer. The absorbance test was performed at a 665 nm wavelength, and the direct relationship between absorbance and concentration was obtained. Thus, the standard curve used for this work was y = 0.00845x + 0.1002, and the fitting constant of the curve was 0.9979.
Figure 8.
Drawing of standard curve.
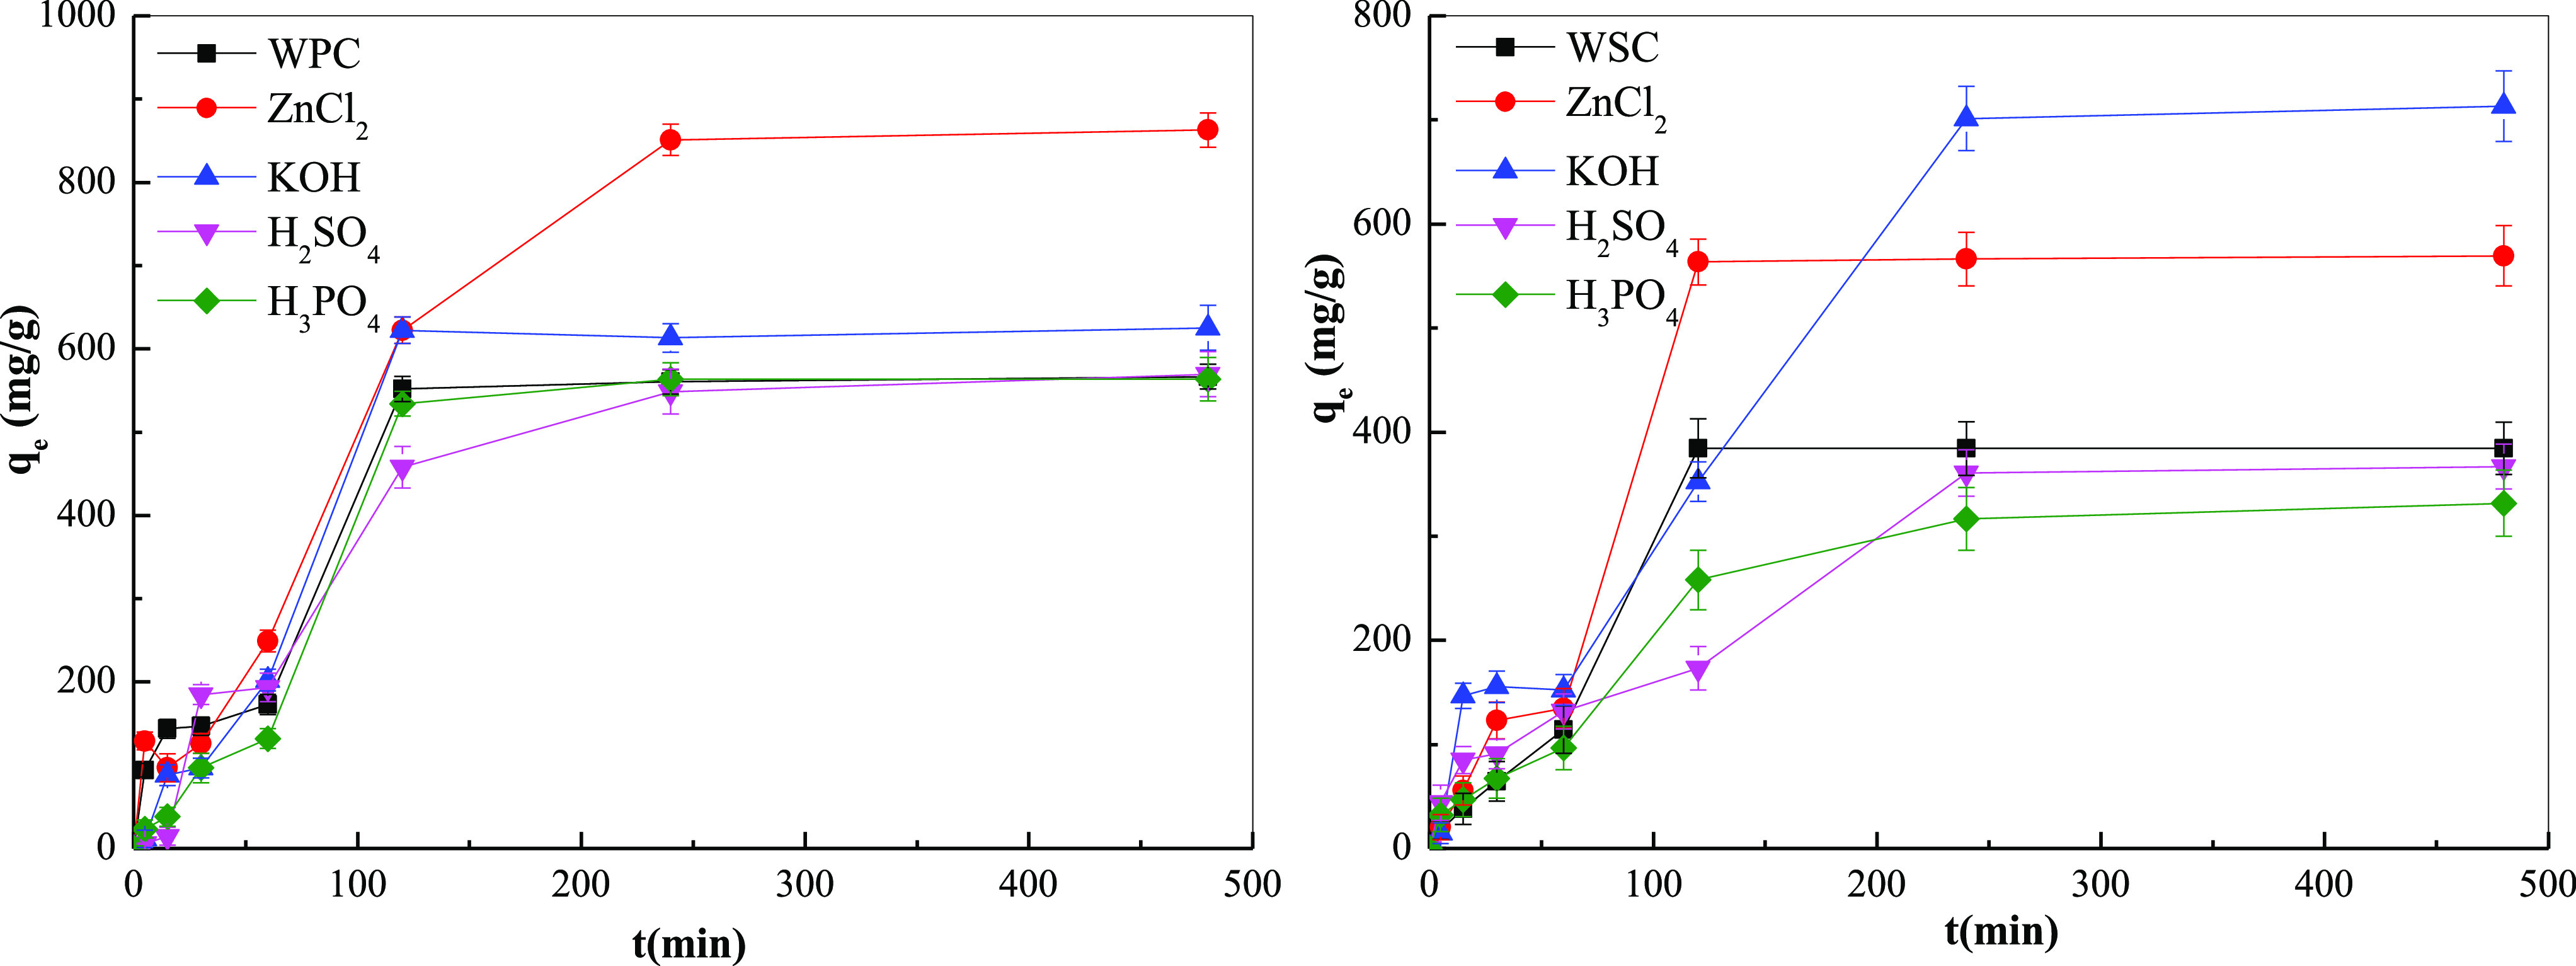
Figure 9 and Table 9 show the effects of different biochars on the adsorption of MB with different acid–base treatments for different adsorption times. With the increase in adsorption time, adsorption increased. During the first 120 min, adsorption increased significantly and the adsorption rate was faster. With longer adsorption times, the adsorption increased only slightly. After an adsorption time of 240 min, the adsorption capacity remained basically unchanged. This was because the highest concentration of the surface functional groups on the baked charcoal and the MB in the liquid phase was highest at the initial stage with the largest mass transfer driving ability, leading to the highest adsorption.
Figure 9.
Effect of adsorption time on the adsorption efficiency of different adsorbents.
Table 9. Adsorption Capacity of Biochar Treated with Different Acids and Bases.
| t/min | WPC | ZnCl2 | KOH | H2SO4 | H3PO4 | WSC | ZnCl2 | KOH | H2SO4 | H3PO4 |
|---|---|---|---|---|---|---|---|---|---|---|
| 0 | 0.00 | 0.00 | 0.00 | 0.00 | 0.00 | 0.00 | 0.00 | 0.00 | 0.00 | 0.00 |
| 5 | 93.9 | 129.1 | 11.7 | 5.8 | 23.4 | 17.6 | 20.5 | 14.6 | 44.0 | 32.2 |
| 15 | 143.8 | 96.8 | 88.0 | 14.6 | 38.1 | 38.1 | 55.7 | 146.7 | 85.1 | 46.9 |
| 30 | 146.6 | 126.1 | 96.7 | 184.8 | 96.7 | 64.4 | 123.1 | 155.4 | 90.8 | 67.4 |
| 60 | 172.9 | 249.2 | 202.3 | 193.5 | 131.8 | 114.2 | 134.8 | 152.4 | 131.8 | 96.6 |
| 120 | 551.8 | 622.3 | 622.3 | 457.9 | 534.2 | 384.6 | 563.6 | 352.3 | 173.3 | 457.9 |
| 240 | 560.4 | 850.9 | 613.2 | 548.7 | 563.3 | 384.3 | 566.3 | 701.3 | 360.8 | 316.8 |
| 480 | 566.5 | 862.9 | 625.2 | 569.5 | 563.6 | 384.6 | 569.5 | 713.3 | 367.0 | 331.7 |
At 5–480 min, the increase in adsorption was gentle. This was because the concentration of MB gradually decreased during the adsorption process and the driving force decreased, thereby decreasing the adsorption rate. When the adsorption time exceeded 240 min, the adsorption no longer occurred. The change tends to the adsorption-analysis dynamic equilibrium, so 240 min was selected as the reaction condition. For different adsorption biochar, WPC with ZnCl2 treatment had the highest saturation adsorption capacity, followed by KOH and H3PO4, while the saturation adsorption capacity of H2SO4 treatment was the lowest, indicating that ZnCl2 can effectively improve the adsorption capacity of WPC. For WSC, KOH modified had the highest saturation adsorption capacity because KOH had a high hole expansion ability.45,46 During the pretreatment process, KOH removed a large amount of ash inside the pores and had an ablation effect that made the micropores thinner or burned through, which increased the pore size to facilitate the adsorption. The saturation adsorption capacity after H3PO4 treatment was the lowest, which may have been due to the higher lignin content in the walnut shell, which facilitated the formation of biochar carbonization. During the processes of acid and alkali treatments, due to its high carbonization, the pore size was relatively large. Small, not conducive to solution adsorption. In short, different adsorbents had different adsorption effects, and ZnCl2 and KOH had the highest modified effects, and H2SO4 had the worst modified effect.
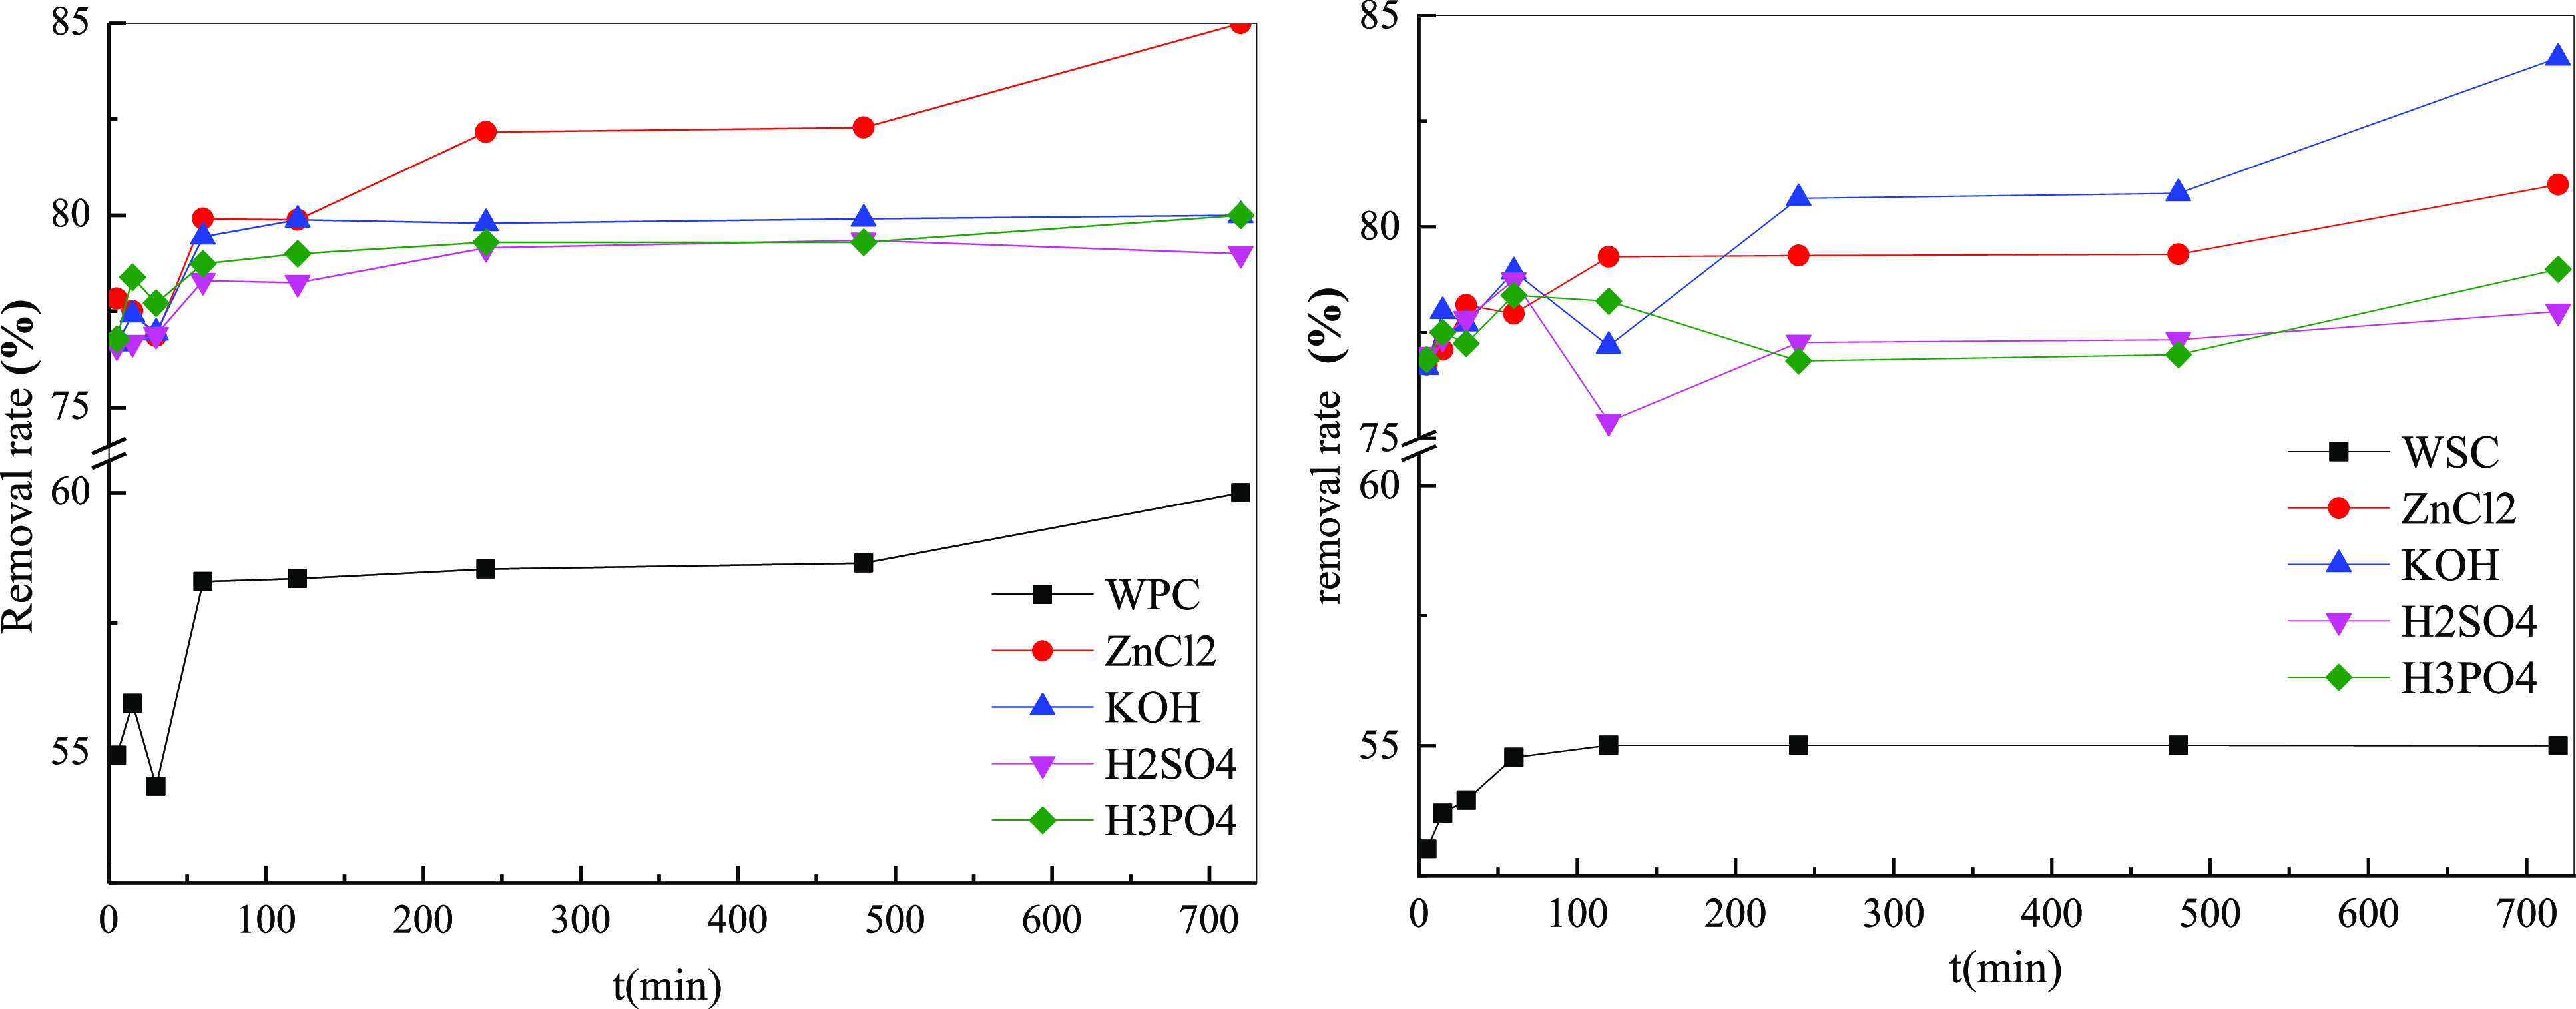
Figure 10 shows the effect of different adsorbents on the removal rate of MB. Before being modified, the removal rate was low (∼50%); after modified treatment, the removal rate increased significantly, and the effective removal rate was ∼80%, an increase of 30%. After the modification of different raw materials, the removal rate was different; the removal rate of WPC was the highest, and the removal rate of WSC was relatively low. However, with different treatment agents, the removal rates were different. For woody biomass, ZnCl2 treatment resulted in the highest removal rate, followed by KOH. The effect from H2SO4 treatment was the worst. For shell biomass, KOH modified had the greatest effect, while the effect of H2SO4 modified was the worst. In short, considering the overall removal rate and saturation adsorption capacity, the adsorption effects of the different treatment agents on MB adsorption was in the order ZnCl2 > KOH > H3PO4 > H2SO4.
Figure 10.
Effect of adsorption time on the removal rate of different adsorbents.
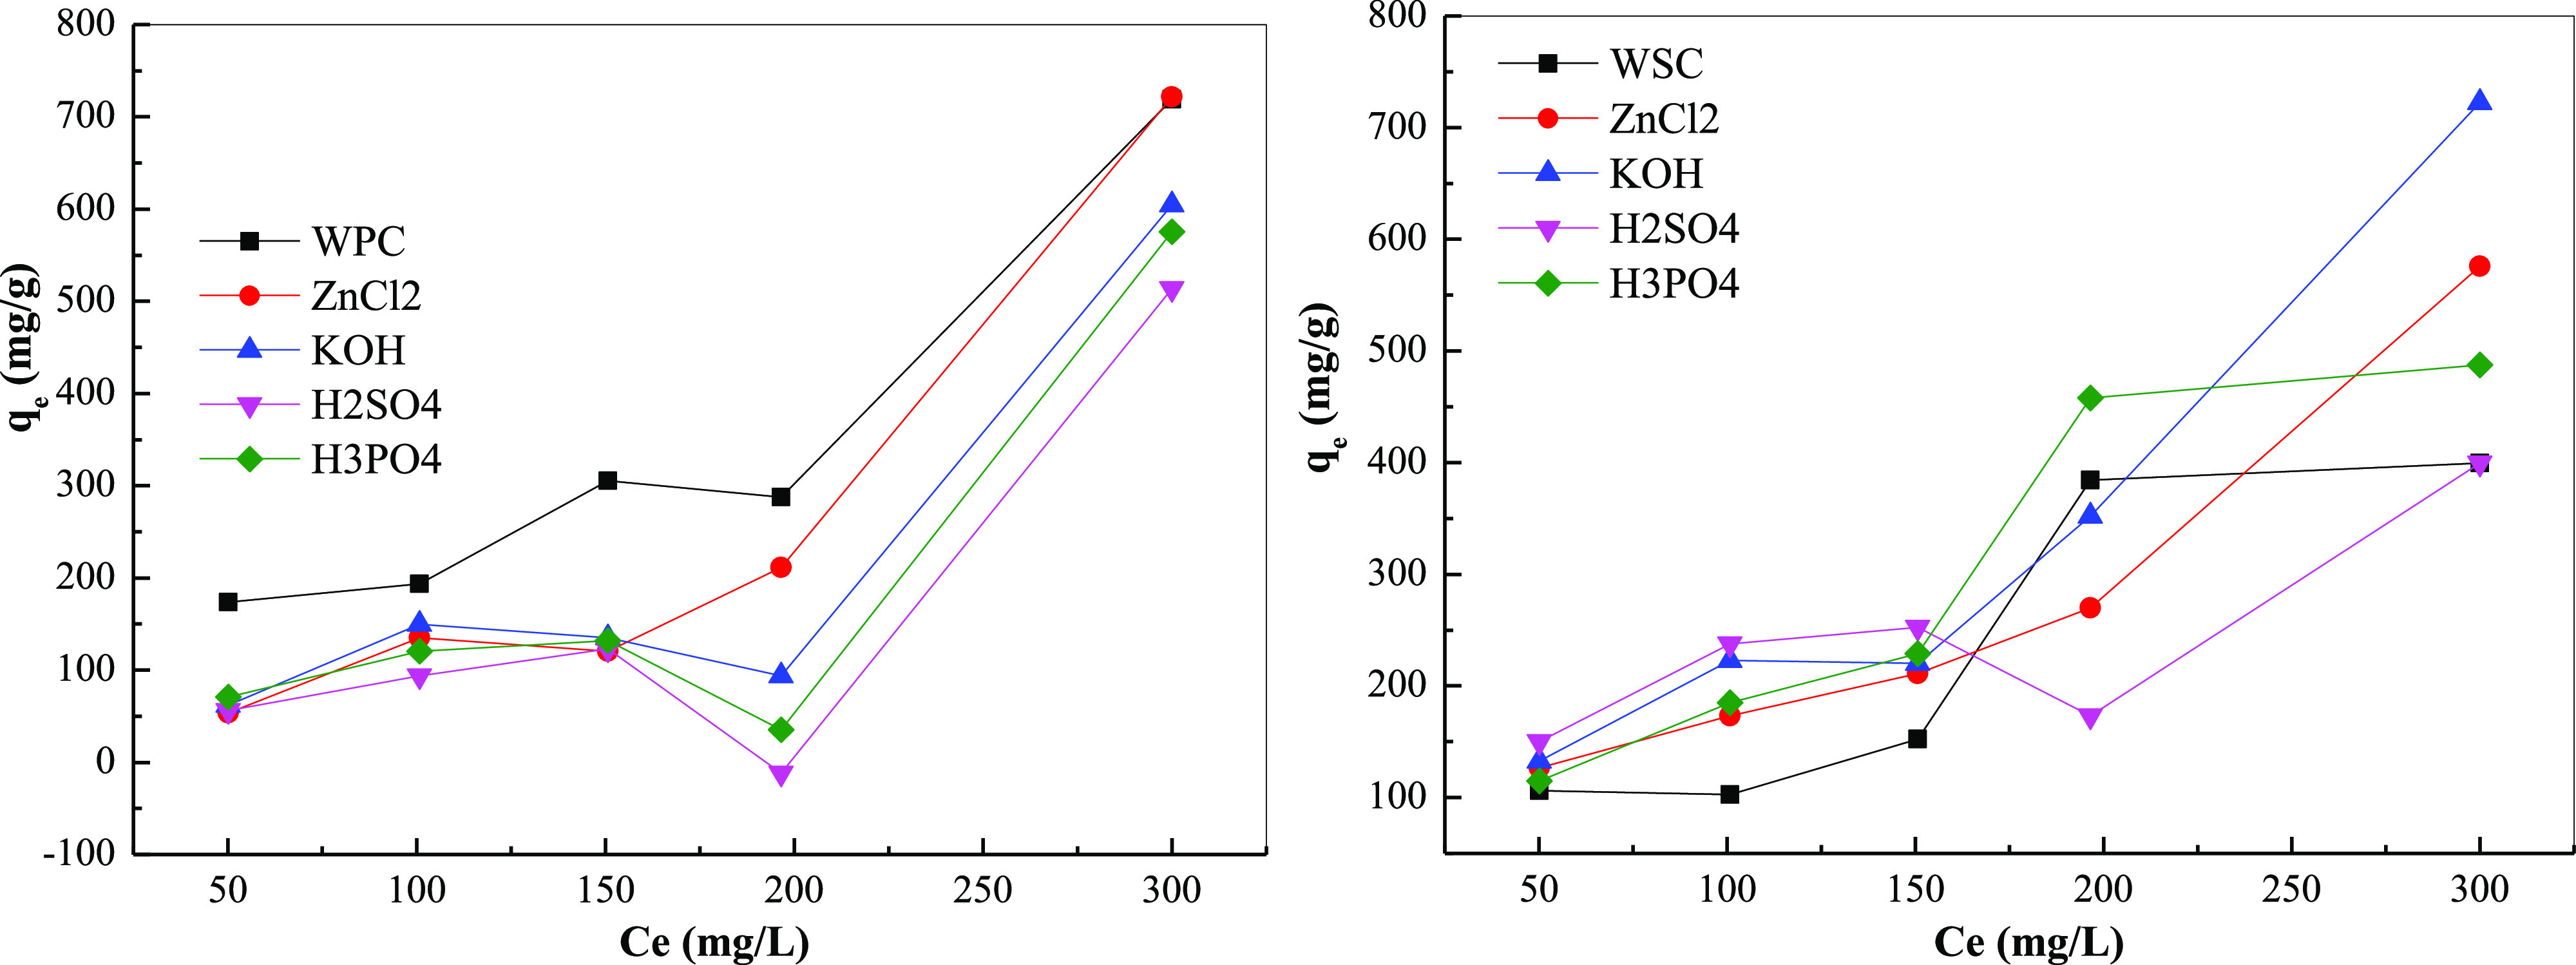
As shown in Figure 11, with an increase in the initial adsorption concentration, the saturated adsorption amount increased significantly, which was due to the increase in the concentration of the adsorbate. As other conditions were unchanged, the concentration difference between the surface of the adsorbent and the solution body increases the adsorption. As the driving force increased, the adsorption capacity increased; thus, the adsorption capacity and removal rate also increased. Moreover, the removal effects of baking charcoal from different raw materials were different. The adsorption effect of WPC was better than the adsorption effect of shell biochar. The removal effects of different acid–base treatment agents were also different and could effectively increase the adsorption capacity; however, the effect of different treatment agents was not much different in terms of concentration, and the trend was the same.
Figure 11.
Effect of initial concentration on the adsorption effect.
3.7. Adsorption Isotherm
To study the relationship between the adsorption amount and MB in the solution at equilibrium, the Langmuir and Freundlich isotherms were used to fit the adsorption data of the biomass baking charcoal adsorbent for MB47,48
| 1 |
| 2 |
where qm is the saturated adsorption amount of monolayer (mg/g), b is the Langmuir constant (L/mg) related to the heat of adsorption, KF is the Freundlich constant (mg/g) (mg/L) related to the adsorption)1/n, and n is the Freundlich constant related to adsorbate and adsorption.
Figures 12 and 13 and Table 10 show the adsorption isotherm parameters. The fitting using Langmuir and Freundlich equations found that the correlation of Langmuir fitting results was far lower than the correlation of Freundlich equations, indicating that the Freundlich equations could well describe the adsorption isotherm effect, and the adsorption was mainly multi-molecular layer adsorption. From the Langmuir equation, the order of saturation adsorption was ZnCl2 > KOH > H3PO4 > H2SO4 > biochar. The product of qm and b in the Langmuir equation reflected the maximum buffer capacity of biomass pyrolysis carbon for MB and still had a similar effect. Moreover, higher KF values indicate stronger adsorption effects. According to its statistical effect, the order of adsorption capacity was KOH > ZnCl2 ≈ H3PO4 > H2SO4 > biochar. Furthermore, from 1/n and adsorption strength because 1/n > 1, the system belonged to an S-type adsorption; the adsorption strength of ZnCl2 was the largest, and WPC > WSC.
Figure 12.
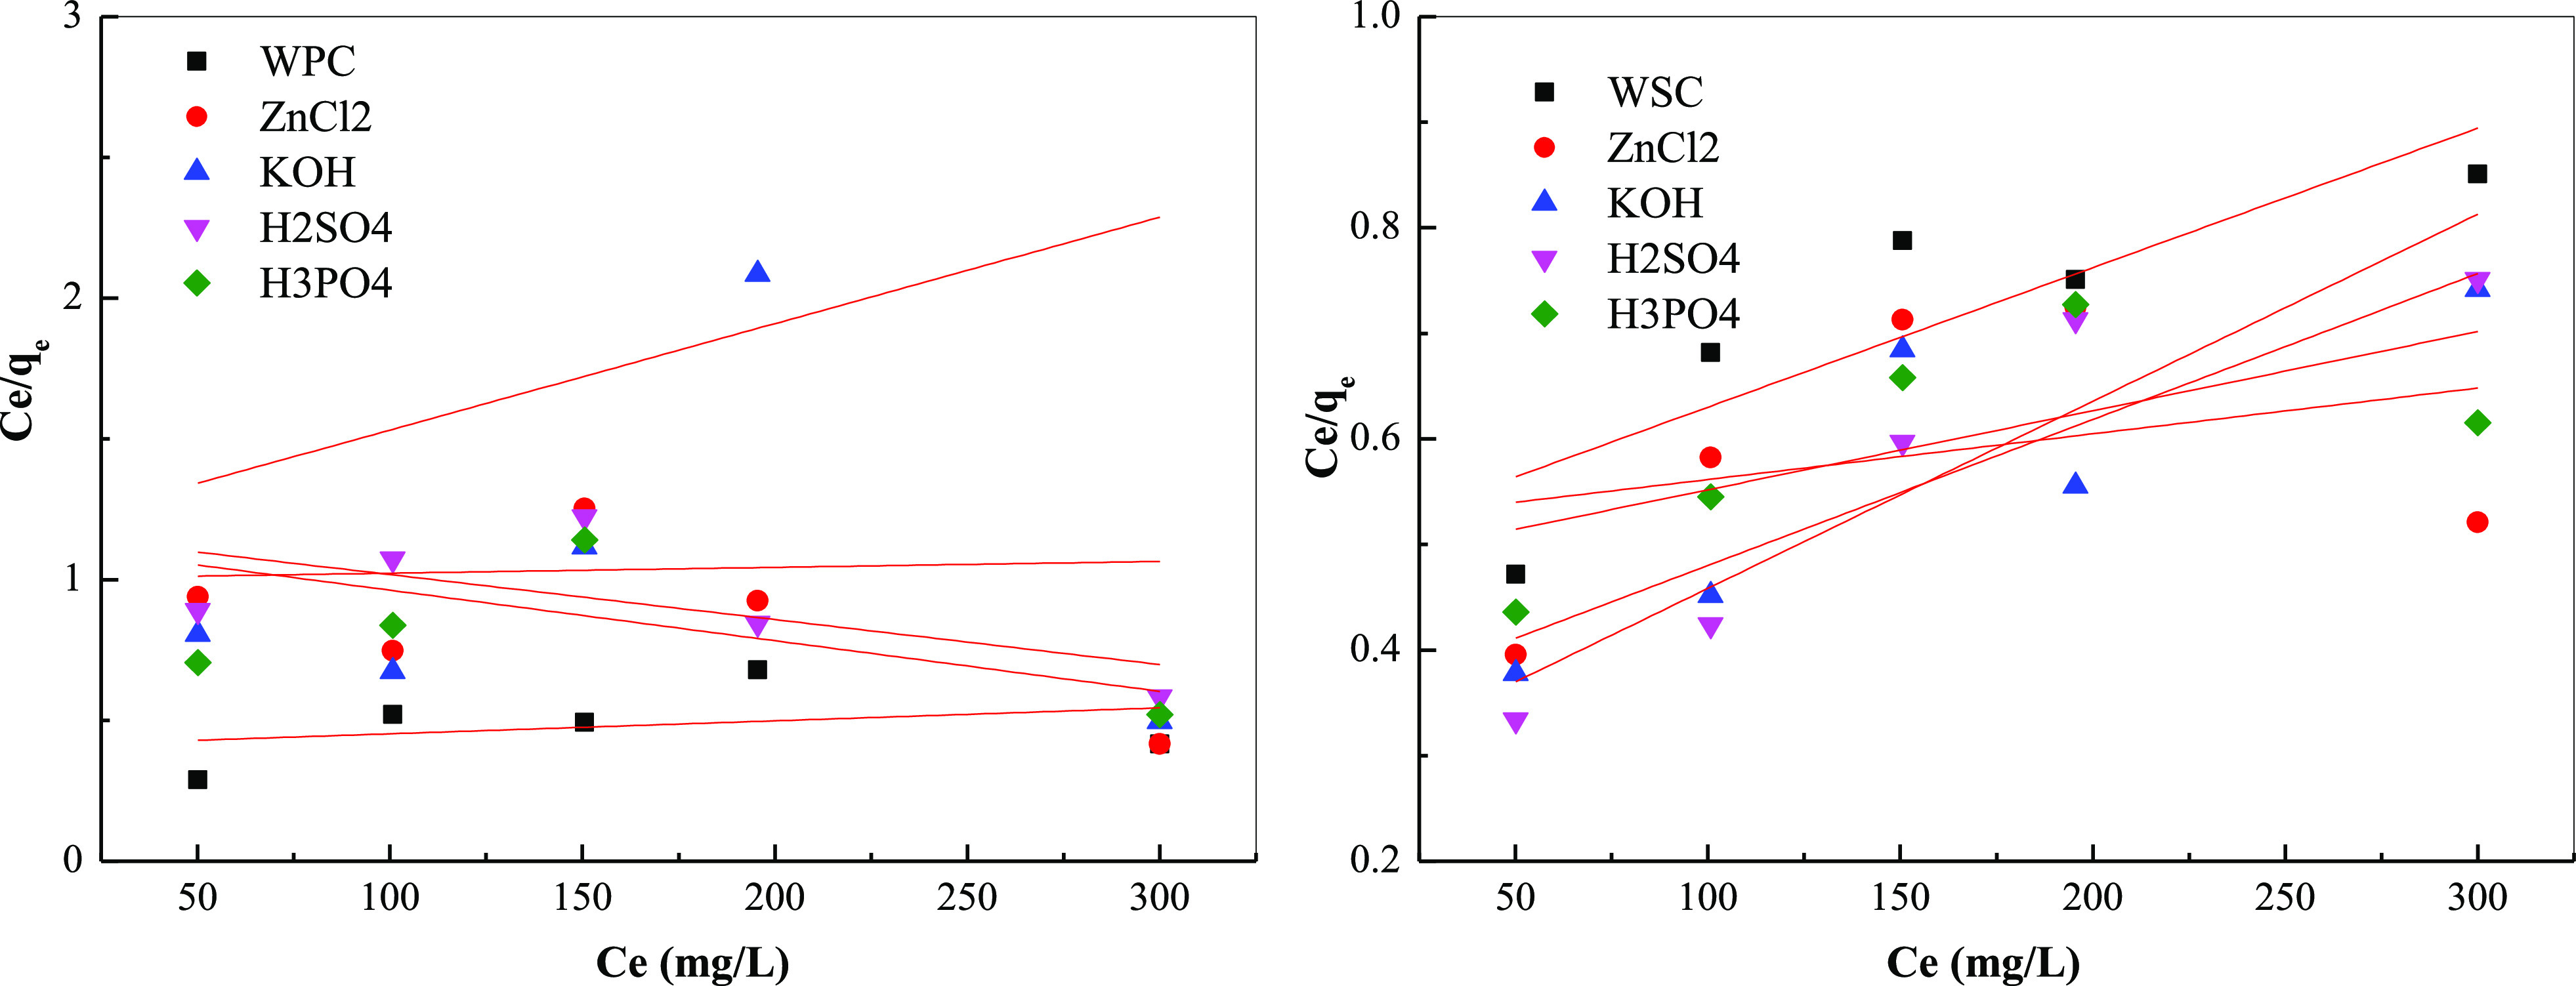
Isothermal fitting adsorption curve of different raw materials biochar: Langmuir isothermal fitting curve.
Figure 13.
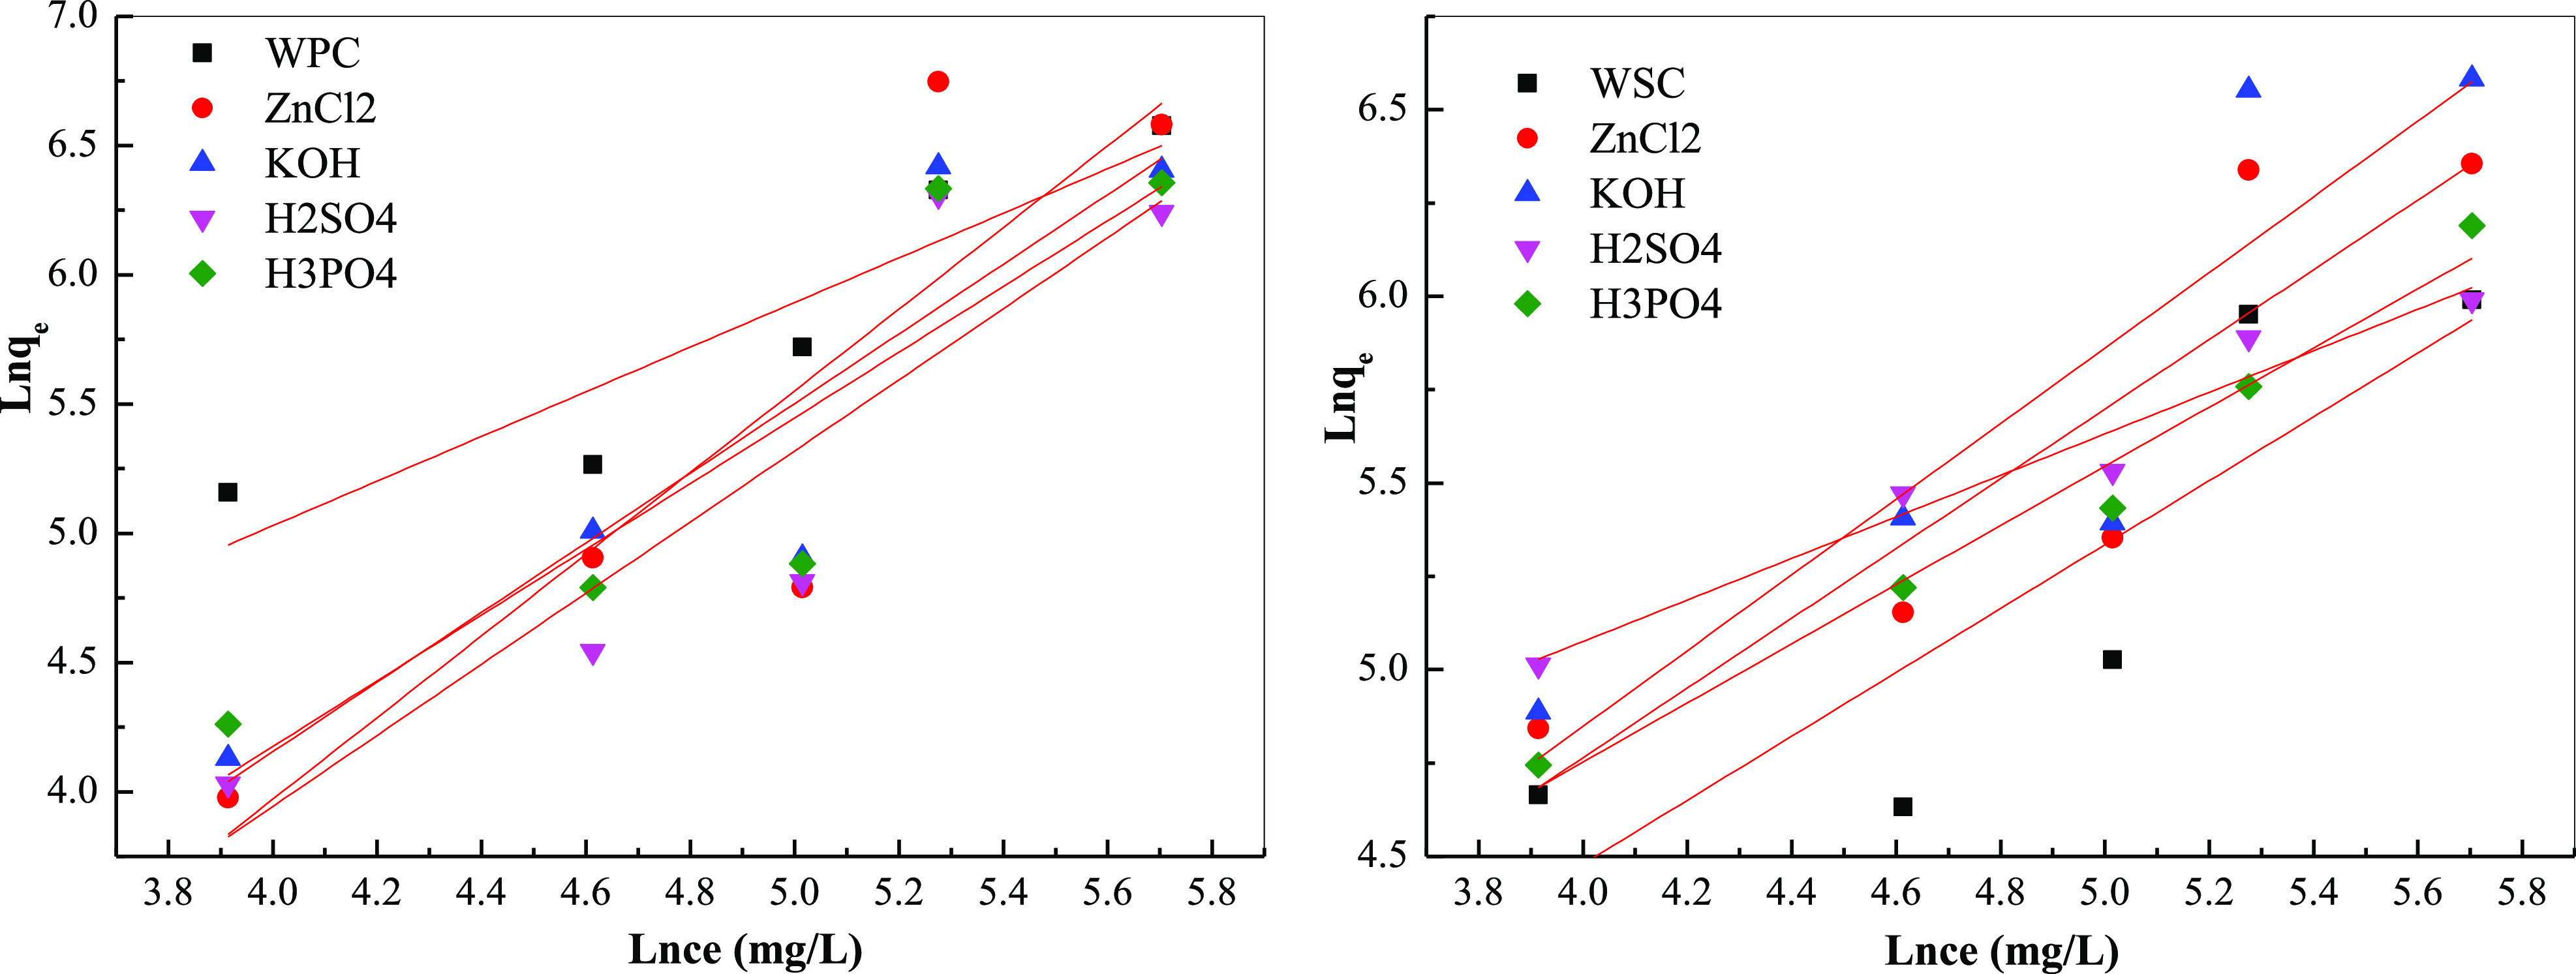
Isothermal fitting adsorption curve of different raw materials biochar: Freundlich isothermal fitting curve.
Table 10. Parameters of Adsorption Isotherm Model for Different Treatments of Biochar.
| Langmuir |
Freundlich |
|||||
|---|---|---|---|---|---|---|
| sample | qm | b | R2 | Kf | n | R2 |
| WPC | 2173.913 | 0.0011 | 0.3065 | 1.1628 | 4.8059 | 0.933 |
| ZnCl2 | 1555.556 | 0.0016 | 0.5605 | 1.6329 | 0.0954 | 0.8896 |
| KOH | 4761.905 | 0.0002 | 0.0315 | 0.7407 | 0.2894 | 0.9111 |
| H2SO4 | 625.00 | 0.0014 | 0.6306 | 0.6299 | 0.2102 | 0.9075 |
| H3PO4 | 264.5503 | 0.0033 | 0.1684 | 0.7874 | 0.4026 | 0.9012 |
| WSC | 757.5758 | 0.0026 | 0.8662 | 1.0638 | 2.8573 | 0.8652 |
| ZnCl2 | 2314.815 | 0.0008 | 0.3003 | 0.9091 | 2.8008 | 0.9103 |
| KOH | 724.6377 | 0.0041 | 0.865 | 1.7857 | 2.2254 | 0.9046 |
| H2SO4 | 564.9718 | 0.0063 | 0.9664 | 0.7857 | 17.2827 | 0.9773 |
| H3PO4 | 1335.114 | 0.0016 | 0.6427 | 1.2658 | 4.8542 | 0.9887 |
3.8. Adsorption Kinetic Analysis
To study the adsorption characteristics and adsorption rates of different biochar, quasi-first-order kinetic, quasi-second-order kinetic, and intra-particle diffusion models were used to analyze them49,50
| 3 |
| 4 |
where qt is the adsorption capacity (mg/g) at time t, k1 is the quasi-first-order adsorption rate constant (min–1), qe is the adsorption capacity at the adsorption equilibrium (mg/g), and k2 is the quasi-second-order adsorption rate constant [g/(mg·min)].
Figures 14 and 15 and Table 11 show the fitting results of the adsorption kinetics and the fitting kinetic parameters. The fitting degree of quasi-first-order kinetics was high, reaching the level of P < 0.05, and the fitting degree of quasi-second-order kinetics was less than 0.90, indicating that the adsorption of MB by the system biochar had both physical and chemical adsorption, mainly, physical adsorption. Moreover, the calculated equilibrium adsorption amount was very close to the experimental result; thus, the entire adsorption process conformed to the quasi-first-order kinetic model, and intragranular diffusion was not the only adsorption rate-controlling step.
Figure 14.
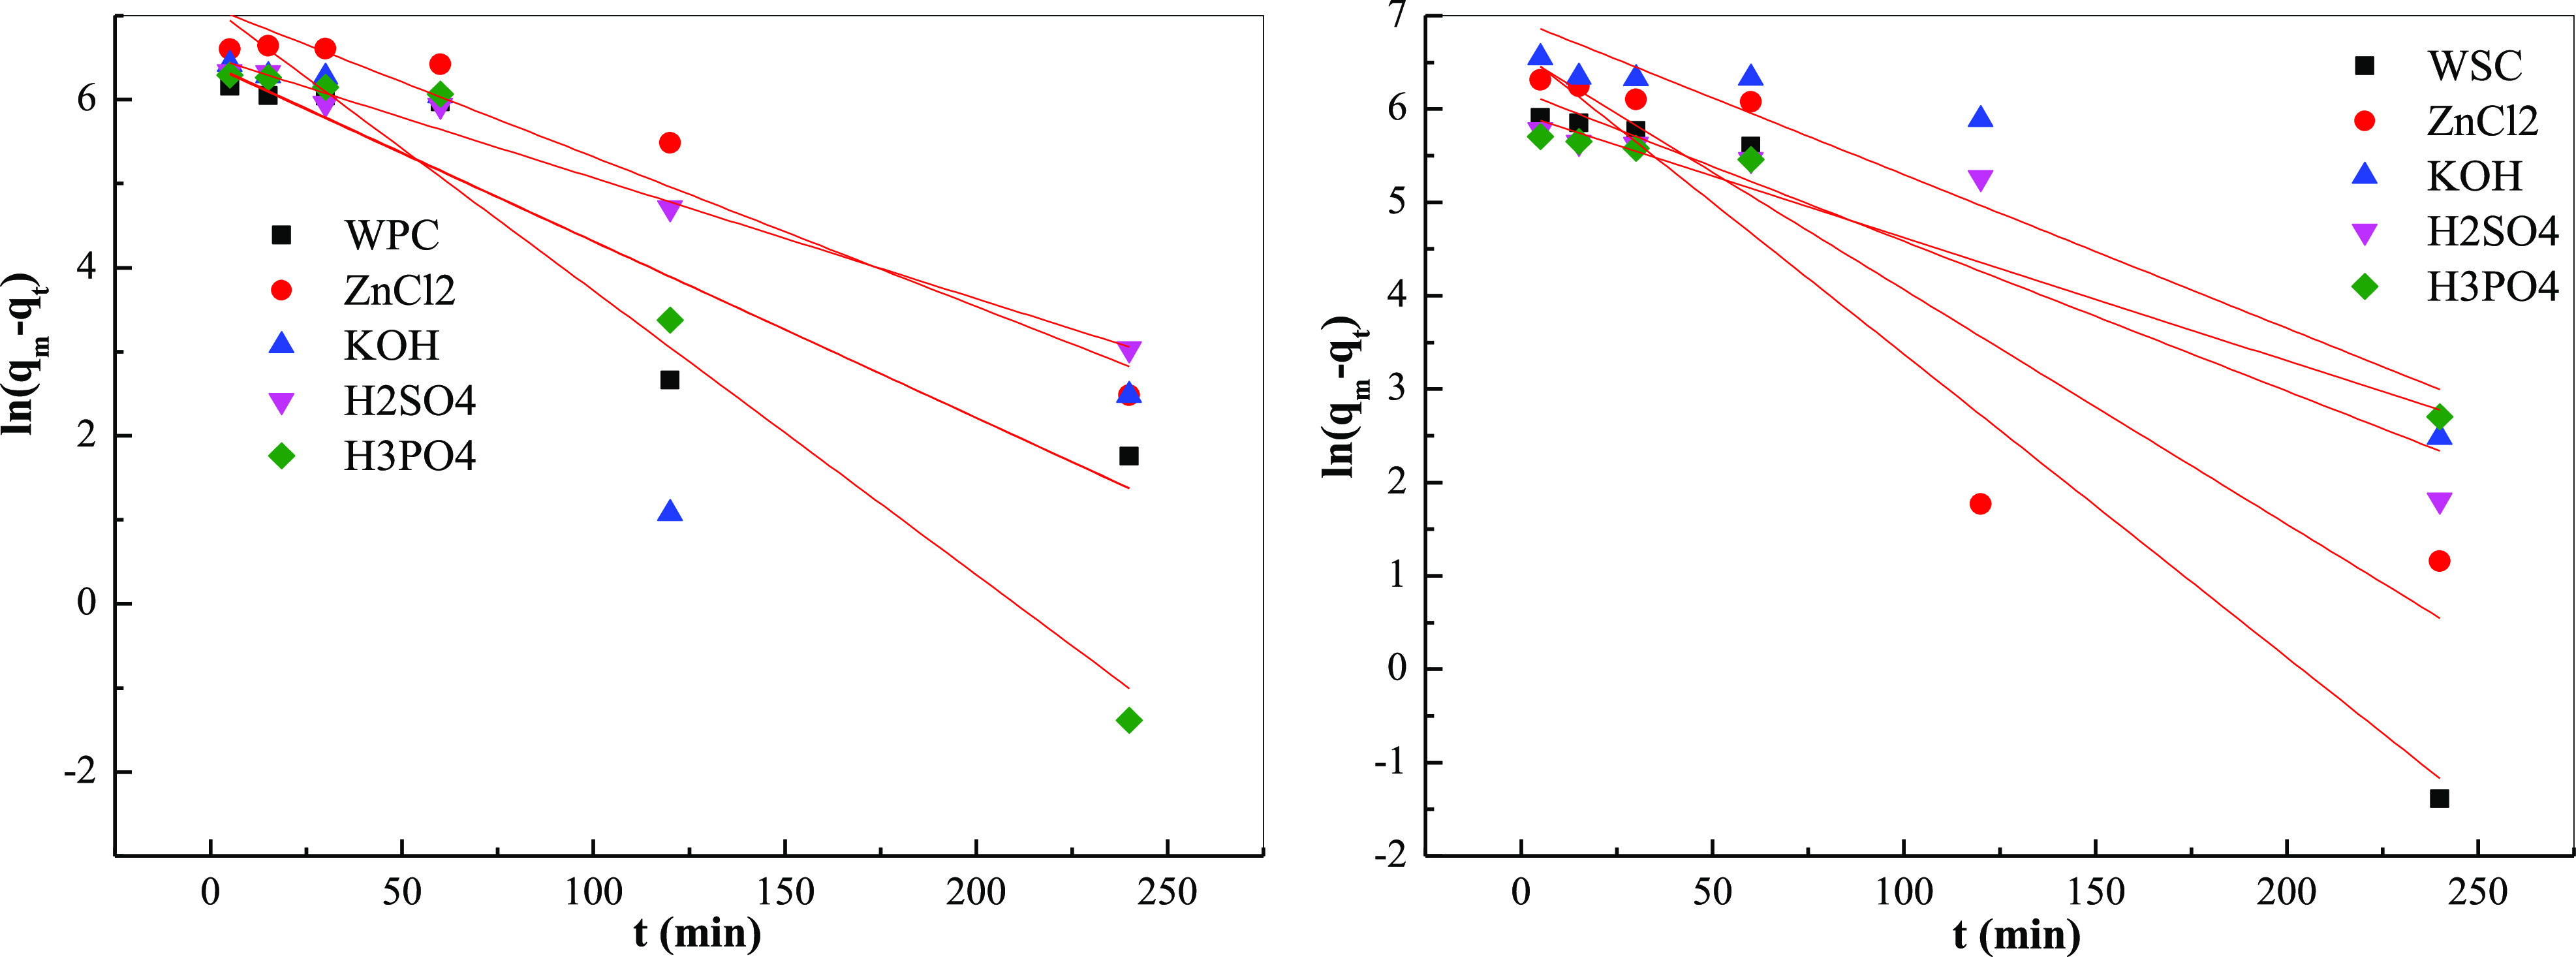
Fitting curve of biochar adsorption kinetics of different raw materials: quasi-first-order kinetic model.
Figure 15.
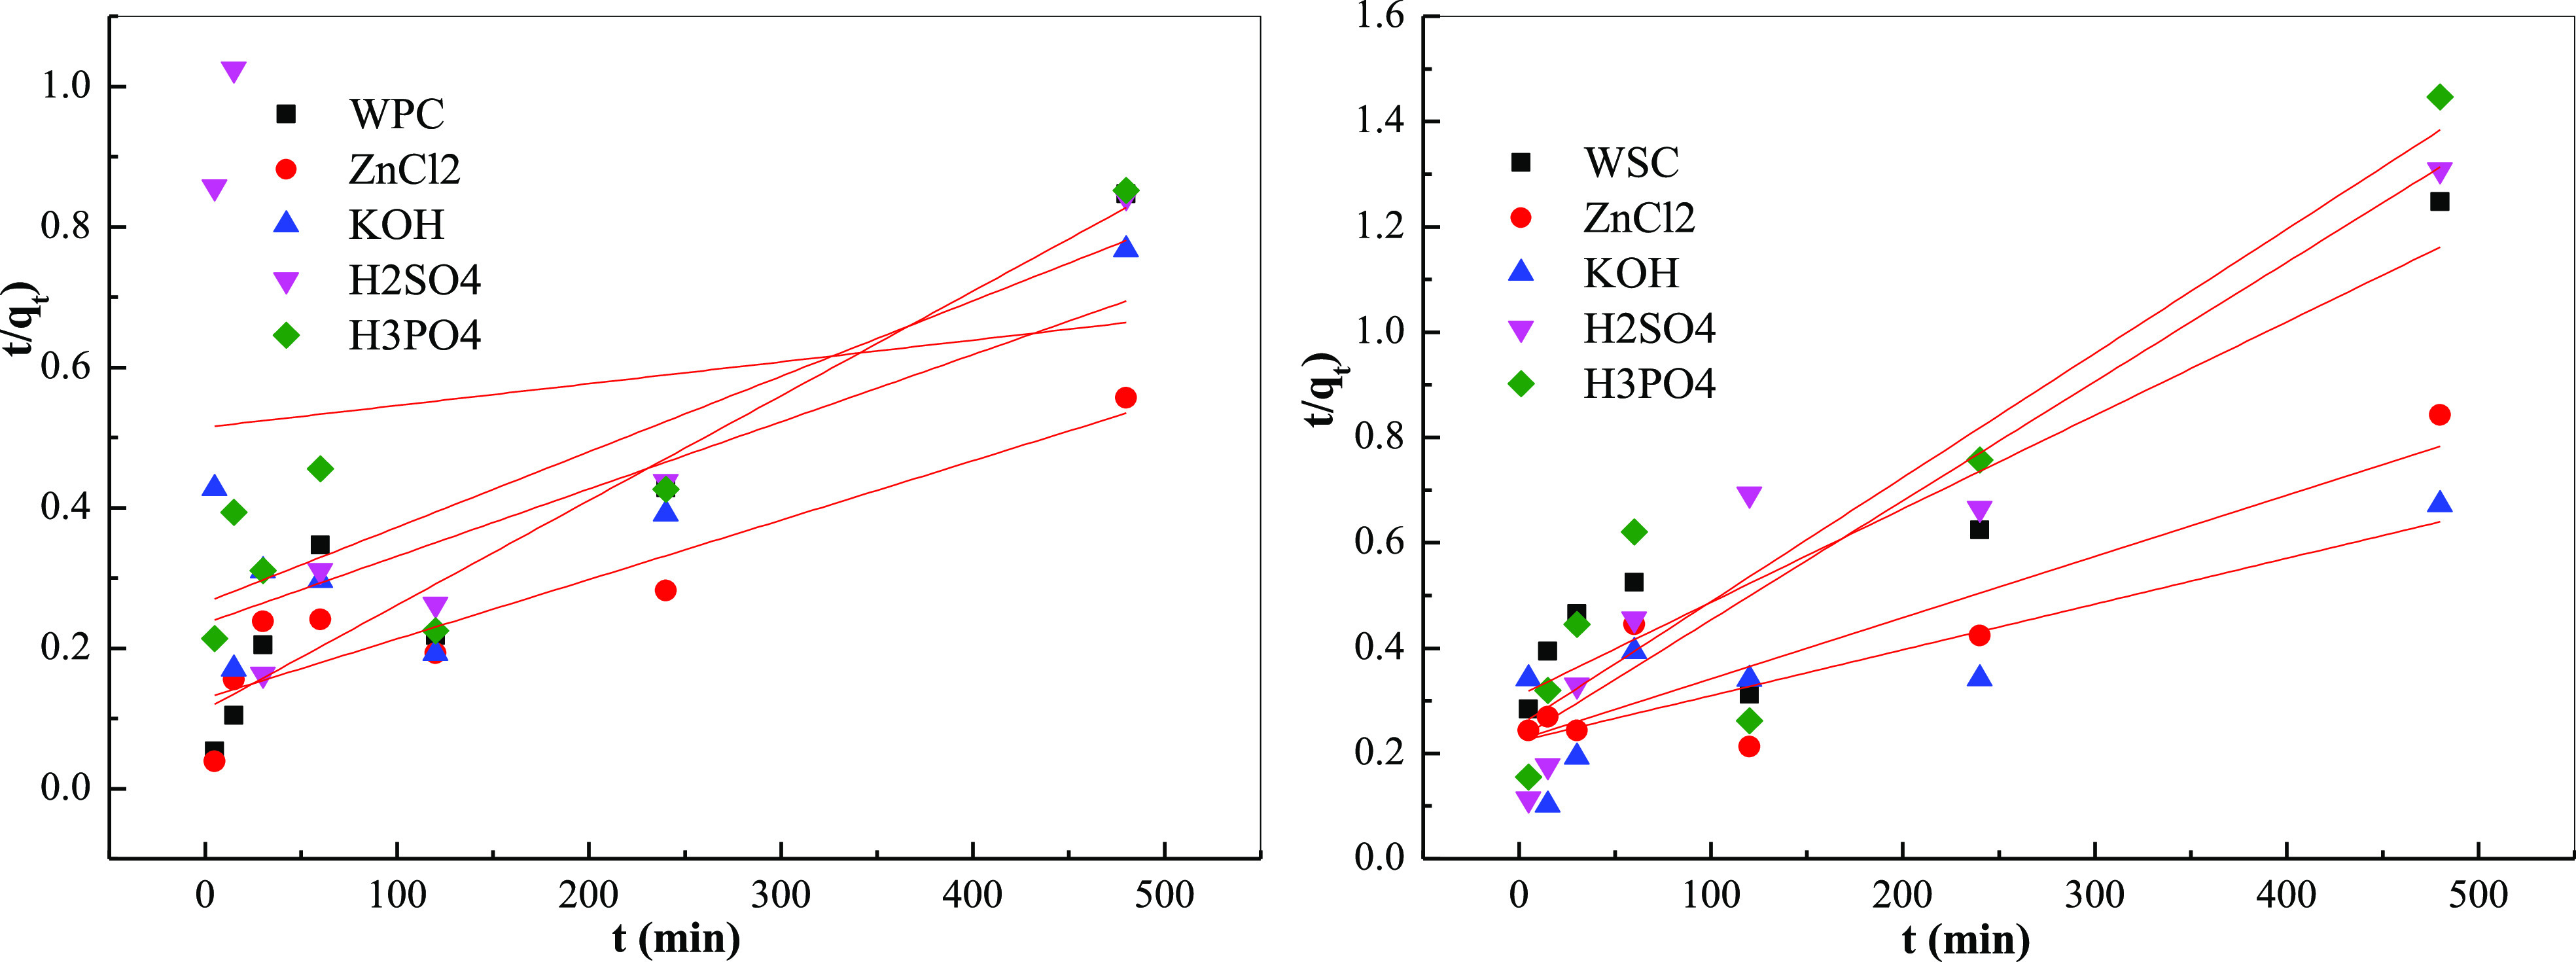
Fitting curve of biochar adsorption kinetics of different raw materials: quasi-second-order kinetic model.
Table 11. Kinetic Parameters of Quasi-First-Order and Quasi-Second-Order Adsorption Equations of Different Original Biochars.
| pseudo-first-order kinetic model |
pseudo-second-order kinetic
model |
|||||
|---|---|---|---|---|---|---|
| sample | k1 (min–1) | qe (mg/g) | R2 | k2 (g/(mg·min)) | qe (mg/g) | R2 |
| WPC | 0.021 | 613.59 | –0.9378 | 2.02 × 10⁻⁵ | 671.14 | 0.9571 |
| ZnCl2 | 0.0178 | 1211.08 | –0.9718 | 5.56 × 10⁻⁶ | 1176.47 | 0.9618 |
| KOH | 0.0209 | 601.45 | –0.7943 | 3.84 × 10⁻⁶ | 1041.67 | 0.8208 |
| H2SO4 | 0.0144 | 671.37 | –0.9933 | 1.88 × 10⁻⁷ | 3225.81 | 0.1556 |
| H3PO4 | 0.0338 | 1223.25 | –0.9812 | 4.40 × 10⁻⁶ | 934.58 | 0.8562 |
| WSC | 0.0325 | 749.43 | –0.984 | 1.01 × 10⁻⁴ | 564.97 | 0.9257 |
| ZnCl2 | 0.0251 | 720.05 | –0.9181 | 5.85 × 10⁻⁶ | 862.07 | 0.8996 |
| KOH | 0.0164 | 1032.03 | –0.9375 | 3.44 × 10⁻⁶ | 1149.43 | 0.8372 |
| H2SO4 | 0.016 | 487.53 | –0.9322 | 2.22 × 10⁻⁵ | 442.48 | 0.9583 |
| H3PO4 | 0.0132 | 379.7 | –0.9895 | 2.23 × 10⁻⁵ | 423.73 | 0.9271 |
3.9. Analysis of Biochar before and after Adsorption
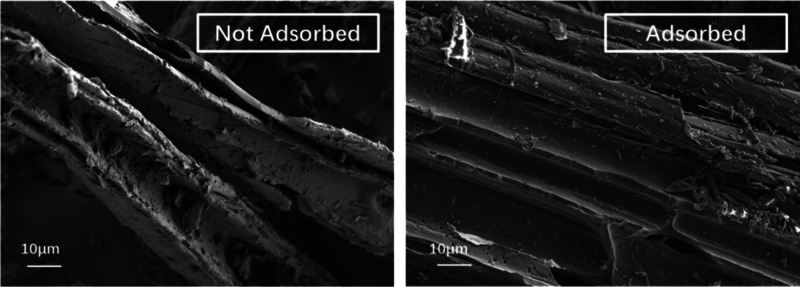
According to the above analysis, ZnCl2-modified wood powder charcoal had the best adsorption effect. SEM characterization was carried out before and after adsorption. It can be seen from Figure 16 that the pore diameter of the adsorbed carbon material did not change much, and a small amount of material appeared on the surface of the adsorbed material, resulting in the decrease of its finish. Analysis showed that a small amount of material might be adsorbed on the surface. At the same time, we conducted XPS analysis of the materials before and after adsorption, and the data were fitted to Figure 17. According to the XPS data in Table 12, the C–C and C–H (C1) bonds of the adsorbed materials decreased, while the C–O (C2) bonds increased and the O element changed little. Analysis showed that there was also a chemical link between MB and biochar, which led to the increase of the C–O bond.
Figure 16.
SEM images of biochar before and after adsorption.
Figure 17.
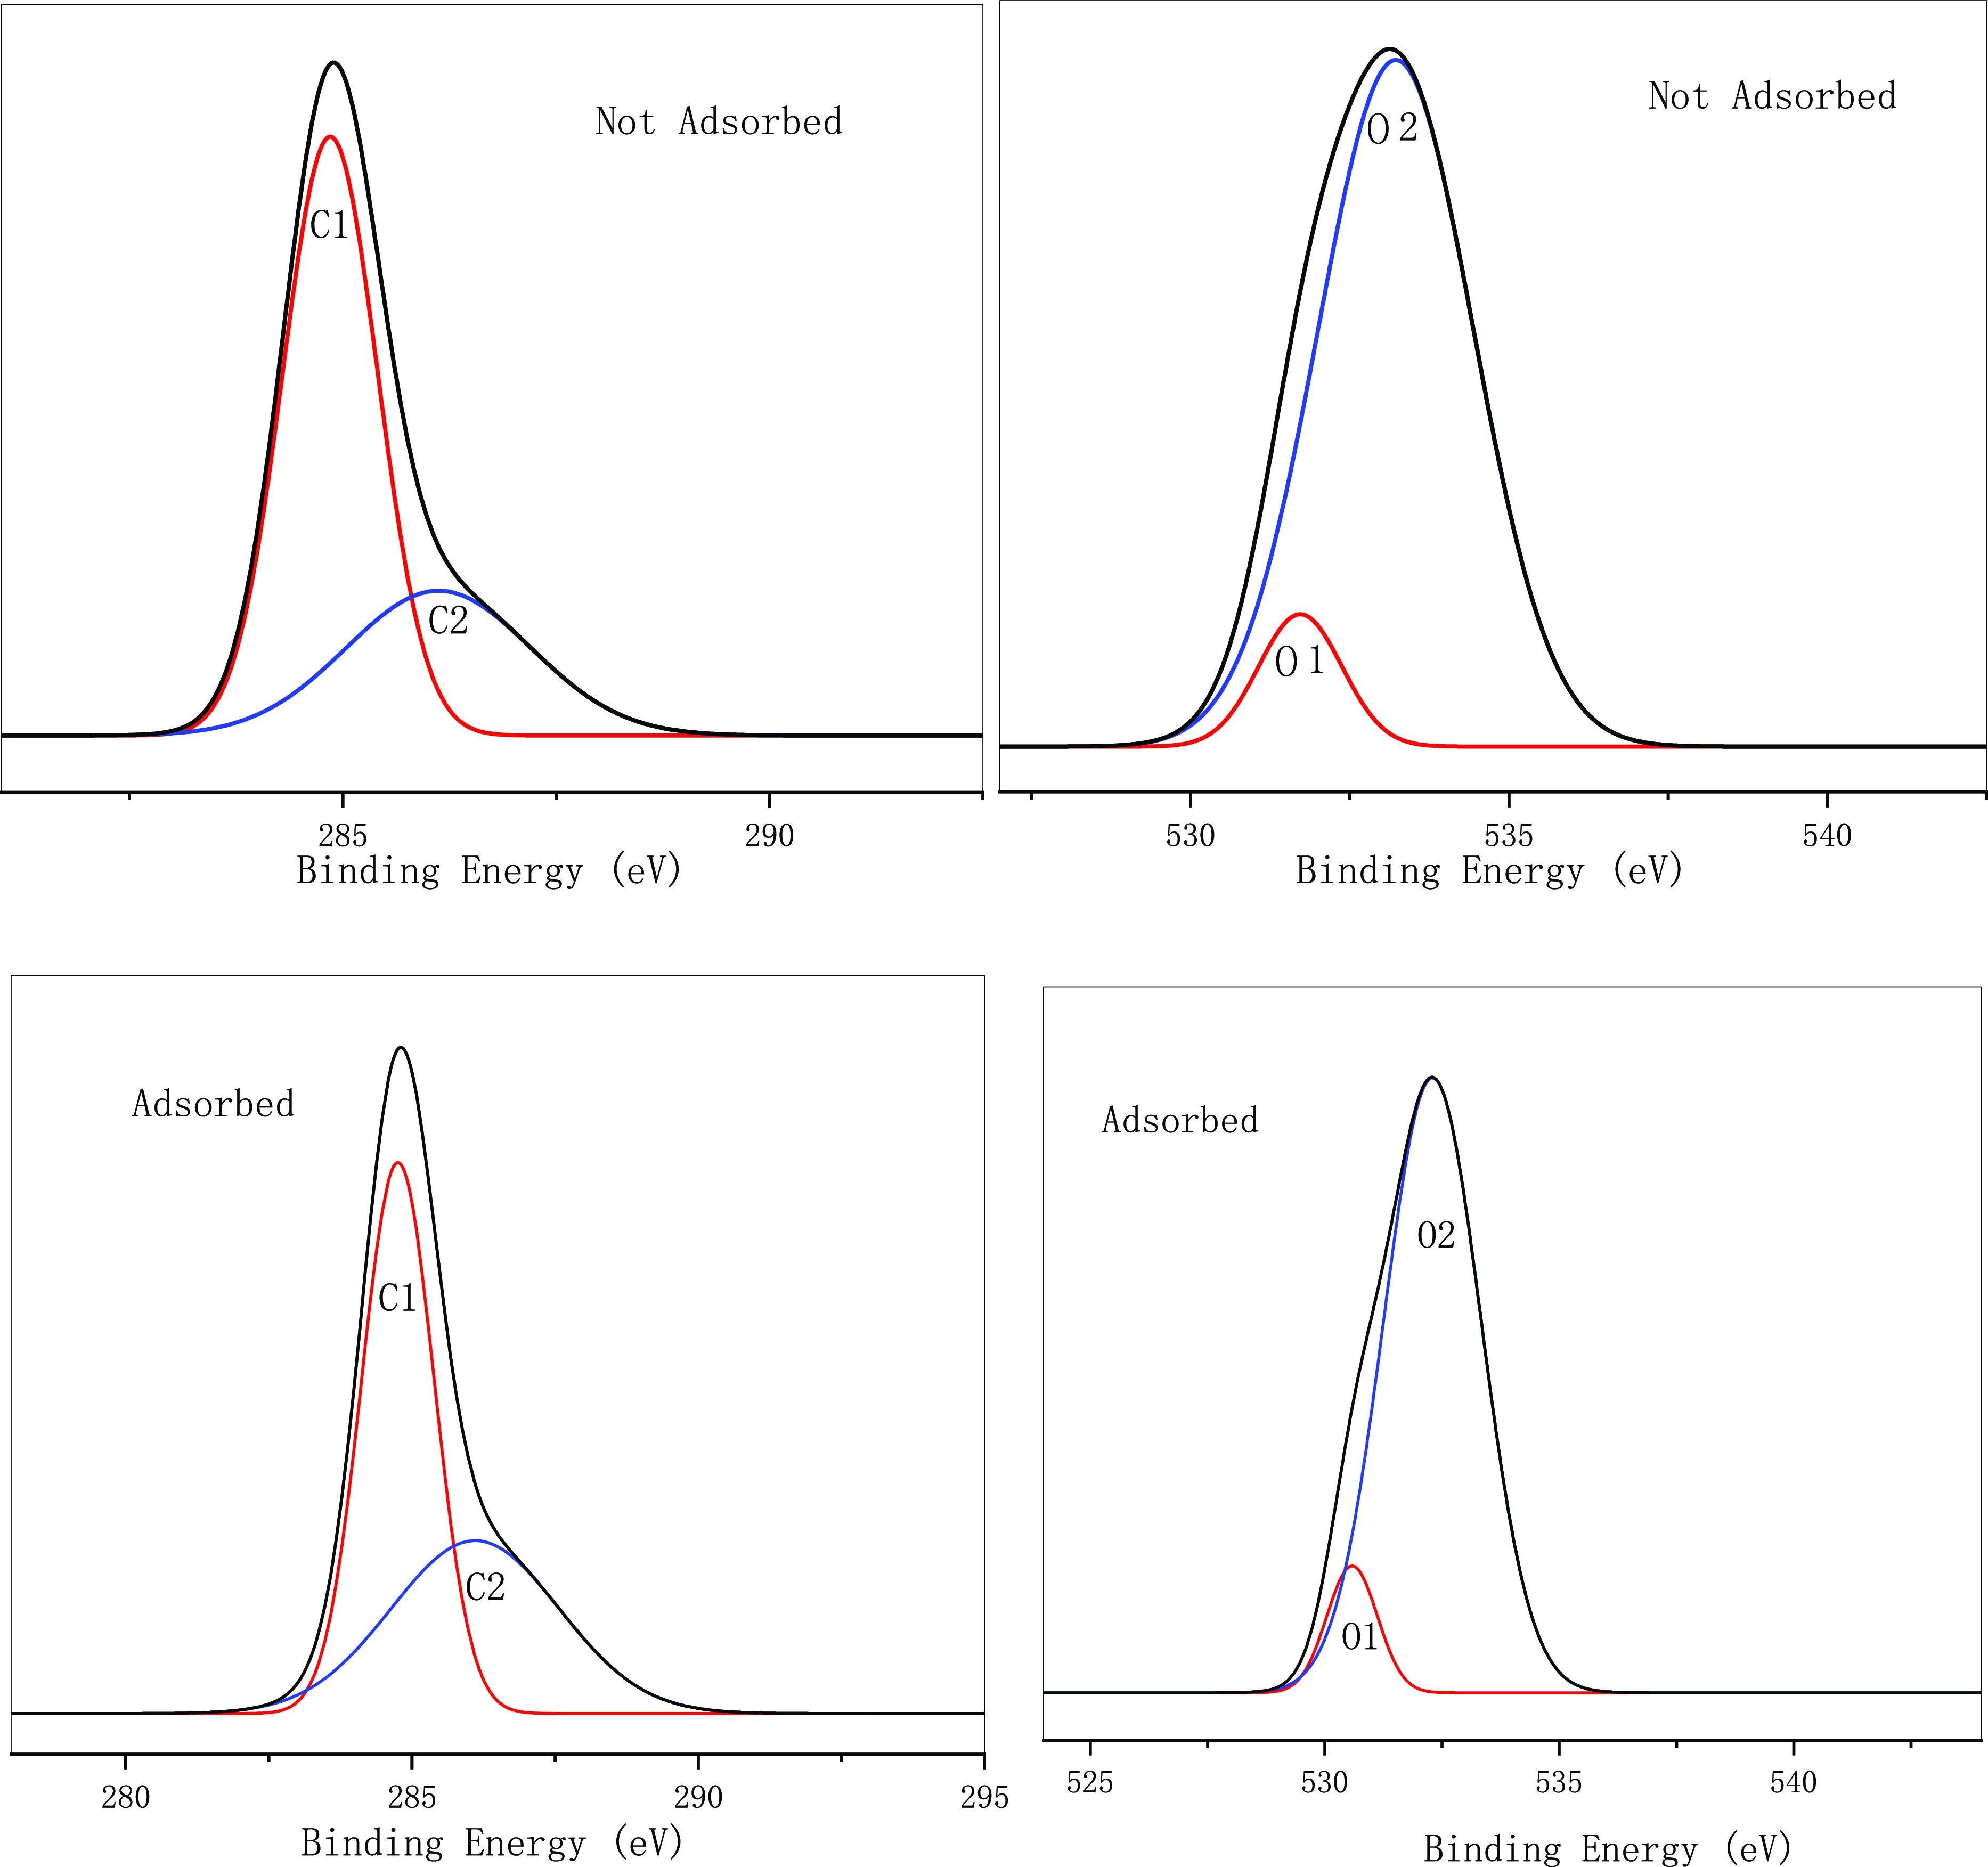
XPS analysis of biochar before and after adsorption.
Table 12. XPS Analysis of Biochar before and after Adsorption.
| C peak position |
C content % | O peak position |
O content % |
|||||
|---|---|---|---|---|---|---|---|---|
| sample | C1 | C2 | C1 | C2 | O2 | O1 | O2 | O1 |
| not adsorbed | 284.85 | 286.12 | 68.05 | 31.95 | 531.72 | 533.22 | 9.35 | 90.65 |
| adsorbed | 284.76 | 286.10 | 57.86 | 42.13 | 530.98 | 533.29 | 9.63 | 90.36 |
4. Conclusions
According to these analyses, KOH effectively made holes in wood powder and walnut shells. The use of activating reagents effectively expanded the specific surface area and increased the amount of adsorption. After modified treatment, the specific surface area of the two modified biochars increased, both of which had mesoporous distribution, the pore size formed by WSC was larger, and the specific surface area of WSC was smaller than that of WPC. The increase in specific surface area was beneficial for increased binding of compounds and modified biochar, thereby leading to physical and chemical adsorption. A large number of non-polar C–O bonds and part of C=O were formed during the dehydration processes of carbon, and an electronegativity difference was formed on the surface, thereby forming an intermolecular force (van der Waals force) with MB so that organic compounds were adsorbed on the modified biochar. The specific surface area of charcoal activated by ZnCl2 was not high. According to the adsorption analysis, it could absorb a large amount of organic compounds (up to 129.1 mg/g at 5 min), which was 2–4 times the adsorption capacity of other adsorbents. It had a typical multilayer physical adsorption phenomenon, and therefore, the adsorption capacity was greater. The adsorption capacity of other WPC and WSC carbons was caused by chemical adsorption before 60 min, and the multilayer physical adsorption characteristics began to form after 240 min. The adsorption capacity order of the two raw materials’ pyrolysis carbon was WPC > WSC. The adsorption of different treatment reagents on MB were in the order ZnCl2 > KOH > H3PO4 > H2SO4. The maximum adsorption capacities of the two types of biomass after treatment were 850.9 mg/g (WPC–ZnCl2) and 701.3 mg/g (WSC–KOH). The adsorption process of MB conformed to the quasi-second-order kinetic equation, that is, physical adsorption was dominant.
Acknowledgments
This work was partially supported by the National Key Research and Development Program of China (no. 2019YFD1002404); the Applied Basic Research Programs of Science and Technology Department of Yunnan Province (award no. 2018ZG004, 2017FG001-072, 2017FG001-001, and 202002AA10007). The study was also supported by the Key Laboratory of State Forestry Administration for Highly-Efficient Utilization of Forestry Biomass Resources in Southwest China (Southwest Forestry University) (no. 2019-KF05) and the National Natural Science Foundation (no. 31960296).
The authors declare no competing financial interest.
References
- Chen S.; Wu T.; Xiao L. Genetic diversity and distribution characteristic of Juglans sigillata resources along Jinsha River in Three Parallel Rivers Belt of Yunnan. J. South Agric. 2019, 50, 2656–2664. 10.3969/j.issn.2095-1191.2019.12.05. [DOI] [Google Scholar]
- Wu T.; Chen S. Y.; Xiao L. J.; Ning D. L.; Pan L.; He N.; Zhu Y. F. Genetic Diversity Analysis and Core Collection Construction of Walnut Germplasm in Yunnan Province. J. Plant Genet. Resour. 2020, 21, 767–774. [Google Scholar]
- Ning P.; Liu S.; Wang C.; Li K.; Sun X.; Tang L.; Liu G. Adsorption-oxidation of hydrogen sulfide on Fe/walnut-shell activated carbon surface modified by NH_3-plasma. J. Environ. Sci. 2018, 64, 216–226. 10.1016/j.jes.2017.06.017. [DOI] [PubMed] [Google Scholar]
- Yu Q.; Li M.; Ning P.; Yi H.; Tang X. Characterization of Metal Oxide-modified Walnut-shell Activated Carbon and Its Application for Phosphine Adsorption: Equilibrium, Regeneration, and Mechanism Studies. J. Wuhan Univ. Technol. 2019, 34, 487–495. 10.1007/s11595-019-2078-y. [DOI] [Google Scholar]
- Abedi E.; Amiri M. J.; Sahari M. A. Kinetic, isotherm and thermodynamic investigations on adsorption of trace elements and pigments from soybean oil using high voltage electric field-assisted bleaching: A comparative study. Process Biochem. 2020, 91, 208–222. 10.1016/j.procbio.2019.12.013. [DOI] [Google Scholar]
- Pohndorf R. S.; Cadaval T. R. S.; Pinto L. A. A. Kinetics and thermodynamics adsorption of carotenoids and chlorophylls in rice bran oil bleaching. J. Food Eng. 2016, 185, 9–16. 10.1016/j.jfoodeng.2016.03.028. [DOI] [Google Scholar]
- Teixeira S.; Delerue-Matos C.; Santos L. Application of experimental design methodology to optimize antibiotics removal by walnut shell based activated carbon. Sci. Total Environ. 2018, 646, 168–176. 10.1016/j.scitotenv.2018.07.204. [DOI] [PubMed] [Google Scholar]
- Saber-Samandari S.; Heydaripour J. Onion membrane: an efficient adsorbent for decoloring of wastewater. J. Environ. Health Sci. 2015, 13, 16. 10.1186/s40201-015-0170-6. [DOI] [PMC free article] [PubMed] [Google Scholar]
- Wu L.; Shang Z.; Wang H.; Wan W.; Gao X.; Li Z.; Kobayashi N. Production of activated carbon from walnut shell by CO2 activation in a fluidized bed reactor and its adsorption performance of copper ion. J. Mater. Cycles Waste Manage. 2018, 20, 1676–1688. 10.1007/s10163-018-0730-9. [DOI] [Google Scholar]
- Thomas S. P.; Mansoor H. H. A.; Kullappan M.; Sethumathavan V.; Natesan B. Effect of Zeta Potential on Chitosan Doped Cerium Oxide in the Decolorization of Cationic Dye under Visible Light Irradiation. Fibers Polym. 2019, 20, 1418–1423. 10.1007/s12221-019-8629-1. [DOI] [Google Scholar]
- Xie R.; Jin Y.; Chen Y.; Jiang W. The importance of surface functional groups in the adsorption of copper onto walnut shell derived activated carbon. Water Sci. Technol. 2017, 76, 3022–3034. 10.2166/wst.2017.471. [DOI] [PubMed] [Google Scholar]
- Zhou X.-J.; Guo W.-Q.; Yang S.-S.; Ren N.-Q. A rapid and low energy consumption method to decolorize the high concentration triphenylmethane dye wastewater: operational parameters optimization for the ultrasonic-assisted ozone oxidation process. Bioresour. Technol. 2012, 105, 40–47. 10.1016/j.biortech.2011.11.089. [DOI] [PubMed] [Google Scholar]
- Zhou X.-J.; Guo W.-Q.; Yang S.-S.; Zheng H.-S.; Ren N.-Q. Ultrasonic-assisted ozone oxidation process of triphenylmethane dye degradation: evidence for the promotion effects of ultrasonic on malachite green decolorization and degradation mechanism. Bioresour. Technol. 2013, 128, 827–830. 10.1016/j.biortech.2012.10.086. [DOI] [PubMed] [Google Scholar]
- Meerbergen K.; Crauwels S.; Willems K. A.; Dewil R.; Van Impe J.; Appels L.; Lievens B. Decolorization of reactive azo dyes using a sequential chemical and activated sludge treatment. J. Biosci. Bioeng. 2017, 124, 668–673. 10.1016/j.jbiosc.2017.07.005. [DOI] [PubMed] [Google Scholar]
- Yang Q.; Zhang M.; Zhang M.; Wang C.; Liu Y.; Fan X.; Li H. Characterization of a Novel, Cold-Adapted, and Thermostable Laccase-Like Enzyme With High Tolerance for Organic Solvents and Salt and Potent Dye Decolorization Ability, Derived From a Marine Metagenomic Library. Front. Microbiol. 2018, 9, 2998. 10.3389/fmicb.2018.02998. [DOI] [PMC free article] [PubMed] [Google Scholar]
- Su D.; Xiao T.; Gu D.; Cao Y.; Jin Y.; Zhang W.; Wu T. Ultrasonic bleaching of rapeseed oil: Effects of bleaching conditions and underlying mechanisms. J. Food Eng. 2013, 117, 8–13. 10.1016/j.jfoodeng.2013.01.039. [DOI] [Google Scholar]
- Reynel-Avila H. E.; Mendoza-Castillo D. I.; Bonilla-Petriciolet A. Relevance of anionic dye properties on water decolorization performance using bone char: Adsorption kinetics, isotherms and breakthrough curves. J. Mol. Liq. 2016, 219, 425–434. 10.1016/j.molliq.2016.03.051. [DOI] [Google Scholar]
- Konsowa A. H.; Ossman M. E.; Chen Y.; Crittenden J. C. Decolorization of industrial wastewater by ozonation followed by adsorption on activated carbon. J. Hazard. Mater. 2010, 176, 181–185. 10.1016/j.jhazmat.2009.11.010. [DOI] [PubMed] [Google Scholar]
- Wang Y.; Wang J.; Ma C.; Qiao W.; Ling L. Fabrication of hierarchical carbon nanosheet-based networks for physical and chemical adsorption of CO2. J. Colloid Interface Sci. 2019, 534, 72–80. 10.1016/j.jcis.2018.08.063. [DOI] [PubMed] [Google Scholar]
- Xie R.; Jin Y.; Chen Y.; Jiang W. The importance of surface functional groups in the adsorption of copper onto walnut shell derived activated carbon. Water Sci. Technol. 2017, 76, 3022–3034. 10.2166/wst.2017.471. [DOI] [PubMed] [Google Scholar]
- Mahdavi A. R.; Ghoresyhi A. A.; Rahimpour A.; Younesi H.; Pirzadeh K. COD removal from landfill leachate using a high-performance and low-cost activated carbon synthesized from walnut shell. Chem. Eng. Commun. 2018, 205, 1193–1206. 10.1080/00986445.2018.1441831. [DOI] [Google Scholar]
- Singh K.; Bharose R.; Verma S. K.; Singh V. K. Potential of powdered activated mustard cake for decolorising raw sugar. J. Sci. Food Agric. 2013, 93, 157–165. 10.1002/jsfa.5744. [DOI] [PubMed] [Google Scholar]
- Chadwick H.; Beck R. D. Quantum State-Resolved Studies of Chemisorption Reactions. Annu. Rev. Phys. Chem. 2017, 68, 39–61. 10.1146/annurev-physchem-052516-044910. [DOI] [PubMed] [Google Scholar]
- Łaska-Zieja B.; Golimowski W.; Marcinkowski D.; Niedbala G.; Wojciechowska E. Low-Cost Investment with High Quality Performance. Bleaching Earths for Phosphorus Reduction in the Low-Temperature Bleaching Process of Rapeseed Oil. Foods 2020, 9, 603. 10.3390/foods9050603. [DOI] [PMC free article] [PubMed] [Google Scholar]
- Worasith N.; Goodman B. A. Activated Kaolin Minerals as Bleaching Clays for Prolonging the Useful Life of Palm Oil in Industrial Frying Operations. J. Am. Oil Chem. Soc. 2020, 97, 389–396. 10.1002/aocs.12327. [DOI] [Google Scholar]
- Strieder M. M.; Pinheiro C. P.; Borba V. S.; Pohndorf R. S.; Cadaval T. R. S.; Pinto L. A. A. Bleaching optimization and winterization step evaluation in the refinement of rice bran oil. Sep. Purif. Technol. 2017, 175, 72–78. 10.1016/j.seppur.2016.11.026. [DOI] [Google Scholar]
- Kumar R. D.; Kadirvelu K.; Kannan G. K. Walnut shells: food processing waste from western Himalayan state of Himachal Pradesh as an excellent source for production of activated carbon with highly acidic surface. Integr. Waste Manage. 2019, 23, 274–299. 10.1504/ijewm.2019.10019833. [DOI] [Google Scholar]
- Zhao H.; Yu Q.; Li M.; Sun S. Preparation and water vapor adsorption of “green” walnut-shell activated carbon by CO2 physical activation. Adsorpt. Sci. Technol. 2020, 38, 60–76. 10.1177/0263617419900849. [DOI] [Google Scholar]
- Danish M.; Hashim R.; Mohamad Ibrahim M. N.; Sulaiman O. Characterization of physically activated acacia mangium wood-based carbon for the removal of methyl orange dye. Bioresources 2013, 8, 4323–4339. 10.15376/biores.8.3.4323-4339. [DOI] [Google Scholar]
- Chen W.; He F.; Zhang S.; Xv H.; Xv Z. Development of porosity and surface chemistry of textile waste jute-based activated carbon by physical activation. Environ. Sci. Pollut. Res. Int. 2018, 25, 9840–9848. 10.1007/s11356-018-1335-5. [DOI] [PubMed] [Google Scholar]
- Danish M.; Hashim R.; Ibrahim M. N. M.; Sulaiman O. Optimization study for preparation of activated carbon from Acacia mangium wood using phosphoric acid. Wood Sci. Technol. 2014, 48, 1069–1083. 10.1007/s00226-014-0647-y. [DOI] [Google Scholar]
- Nayak A.; Bhushan B.; Gupta V.; Sharma P. Chemically activated carbon from lignocellulosic wastes for heavy metal wastewater remediation: Effect of activation conditions. J. Colloid Interface Sci. 2017, 493, 228–240. 10.1016/j.jcis.2017.01.031. [DOI] [PubMed] [Google Scholar]
- Liew R. K.; Chong M. Y.; Osazuwa O. U.; Nam W. L.; Phang X. Y.; Su M. H.; Cheng C. K.; Chong C. T.; Lam S. S. Production of activated carbon as catalyst support by microwave pyrolysis of palm kernel shell: a comparative study of chemical versus physical activation. Res. Chem. Intermed. 2018, 44, 3849–3865. 10.1007/s11164-018-3388-y. [DOI] [Google Scholar]
- Li B.; Hu J.; Xiong H.; Xiao Y. Application and Properties of Microporous Carbons Activated by ZnCl2: Adsorption Behavior and Activation Mechanism. ACS Omega 2020, 5, 9398–9407. 10.1021/acsomega.0c00461. [DOI] [PMC free article] [PubMed] [Google Scholar]
- Martínez M. L.; Torres M. M.; Guzmán C. A.; Maestri D. M. Preparation and characteristics of activated carbon from olive stones and walnut shells. Ind. Crops Prod. 2006, 23, 23–28. 10.1016/j.indcrop.2005.03.001. [DOI] [Google Scholar]
- Kim J.; Sohn M. H.; Kim D. S.; Sohn S. M.; Kwon Y. S. Production of granular activated carbon from waste walnut shell and its adsorption characteristics for Cu 2+ ion. J. Hazard. Mater. 2001, 85, 301–315. 10.1016/s0304-3894(01)00239-4. [DOI] [PubMed] [Google Scholar]
- Thompson K. A.; Shimabuku K. K.; Kearns J. P.; Knappe D. R. U.; Summers R. S.; Cook S. M. Environmental Comparison of Biochar and Activated Carbon for Tertiary Wastewater Treatment. Environ. Sci. Technol. 2016, 50, 11253–11262. 10.1021/acs.est.6b03239. [DOI] [PubMed] [Google Scholar]
- Liu P.; Ptacek C. J.; Blowes D. W.; Finfrock Y. Z.; Liu Y. Characterization of chromium species and distribution during Cr (VI) removal by biochar using confocal micro-X-ray fluorescence redox mapping and X-ray absorption spectroscopy. Environ. Int. 2020, 134, 105216. 10.1016/j.envint.2019.105216. [DOI] [PubMed] [Google Scholar]
- Shan R.; Shi Y.; Gu J.; Bi J.; Yuan H.; Luo B.; Chen Y. Aqueous Cr(VI) removal by biochar derived from waste mangosteen shells: Role of pyrolysis and modification on its absorption process. J. Environ. Chem. Eng. 2020, 8, 103885. 10.1016/j.jece.2020.103885. [DOI] [Google Scholar]
- Zhu K.; Wang X.; Chen D.; Ren W.; Lin H.; Zhang H. Wood-based biochar as an excellent activator of peroxydisulfate for Acid Orange 7 decolorization. Chemosphere 2019, 231, 32–40. 10.1016/j.chemosphere.2019.05.087. [DOI] [PubMed] [Google Scholar]
- Cuthbertson D.; Berardi U.; Briens C.; Berruti F. Biochar from residual biomass as a concrete filler for improved thermal and acoustic properties. Biomass Bioenergy 2019, 120, 77–83. 10.1016/j.biombioe.2018.11.007. [DOI] [Google Scholar]
- Zhang M.; Meng J.; Liu Q.; Gu S.; Zhao L.; Dong M.; Zhang J.; Hou H.; Guo Z. Corn stover-derived biochar for efficient adsorption of oxytetracycline from wastewater. J. Mater. Res. 2019, 34, 3050–3060. 10.1557/jmr.2019.198. [DOI] [Google Scholar]
- Gupta S.; Kua H. W.; Pang S. D. Effect of biochar on mechanical and permeability properties of concrete exposed to elevated temperature. Constr. Build. Mater. 2020, 234, 117338. 10.1016/j.conbuildmat.2019.117338. [DOI] [Google Scholar]
- Wang X.; Xu J.; Liu J.; Liu J.; Xia F.; Wang C.; Dahlgren R. A.; Liu W. Mechanism of Cr(VI) removal by magnetic greigite/biochar composites. Sci. Total Environ. 2020, 700, 134414. 10.1016/j.scitotenv.2019.134414. [DOI] [PubMed] [Google Scholar]
- Hoang L. P.; Van H. T.; Nguyen L. H.; Mac D. H.; Vu T. T.; Ha L. T.; Nguyen X. C. Removal of Cr (vi) from aqueous solution using magnetic modified biochar derived from raw corncob. New J. Chem. 2019, 43, 18663–18672. 10.1039/C9NJ02661D. [DOI] [Google Scholar]
- Nazari S.; Rahimi G.; Khademi Jolgeh Nezhad A. Effectiveness of native and citric acid-enriched biochar of Chickpea straw in Cd and Pb sorption in an acidic soil. J. Environ. Chem. Eng. 2019, 7, 103064. 10.1016/j.jece.2019.103064. [DOI] [Google Scholar]
- Lam Y. Y.; Lau S. S. S.; Wong J. W. C. Removal of Cd (II) from aqueous solutions using plant-derived biochar: Kinetics, isotherm and characterization. Bioresour. Technol. 2019, 8, 100323. 10.1016/j.biteb.2019.100323. [DOI] [Google Scholar]
- Ahmad A.; Khan N.; Giri B. S.; Chowdhary P.; Chaturvedi P. Removal of methylene blue dye using rice husk, cow dung and sludge biochar: Characterization, application, and kinetic studies. Bioresour. Technol. 2020, 306, 123202. 10.1016/j.biortech.2020.123202. [DOI] [PubMed] [Google Scholar]
- Dou G.; Jiang Z. Preparation of sodium humate-modified biochar absorbents for water treatment. ACS Omega 2019, 4, 16536–16542. 10.1021/acsomega.9b02227. [DOI] [PMC free article] [PubMed] [Google Scholar]
- Villota S. M.; Lei H.; Villota E.; Qian M.; Lavarias J.; Taylan V.; Agulto I.; Mateo W.; Valentin M.; Denson M. Microwave-assisted activation of waste cocoa pod husk by H3PO4 and KOH—comparative insight into textural properties and pore development. ACS Omega 2019, 4, 7088–7095. 10.1021/acsomega.8b03514. [DOI] [Google Scholar]


