

Abstract
Zika virus (ZIKV) is an emerging flavivirus, which when passed through vertical transmission from mother to developing fetus can lead to developmental abnormalities, including microcephaly. While there is mounting evidence that suggests a causal relationship between ZIKV infection and microcephaly, the mechanisms by which ZIKV induces these changes remain to be elucidated. Here, we demonstrate that ZIKV infection of neural stems cells, both in vitro and in vivo, induces macroautophagy to enhance viral replication. At the same time, ZIKV downregulates a number of essential selective autophagy genes, including the Fanconi anemia (FA) pathway genes. Bioinformatics analyses indicate that the transcription factor E2F4 promotes FANCC expression and is downregulated upon ZIKV infection. Gain and loss of function assays indicate that FANCC is essential for selective autophagy and acts as a negative regulator of ZIKV replication. Finally, we show that Fancc KO mice have increased ZIKV infection and autophagy protein levels in various brain regions. Taken together, ZIKV downregulates FANCC to modulate the host antiviral response and simultaneously attenuate neuronal growth.
Keywords: Fanconi anemia protein C, neural stem cells, selective autophagy, transcription factor E2F4, ZIKA virus replication
Subject Categories: Autophagy & Cell Death; Microbiology, Virology & Host Pathogen Interaction; Neuroscience
ZIKV hijacks the host machinery to induce macroautophagy and enhance viral replication. It also downregulates the Fanconi anemia gene FANCC that promotes antiviral selective autophagy and neurogenesis.

Introduction
Zika virus (ZIKV) is an arbovirus belonging to the Flaviviridae family, which includes dengue, West Nile (WNV), and yellow fever viruses (Lazear & Diamond, 2016). As illustrated by the recent outbreak, ZIKV infection is associated with severe fetal abnormalities, including microcephaly, hydranencephaly, and intrauterine fetal growth restriction (Brasil et al, 2016a,b; Noronha et al, 2016; Sarno et al, 2016; Ventura et al, 2016). In adults, ZIKV infection can cause a self‐limiting febrile illness, arthralgia, rash, and conjunctivitis; however, an estimated 80% of cases are asymptomatic (Duffy et al, 2009; Hayes, 2009; Brasil et al, 2016a,b). Genome‐wide RNA‐seq analysis of various cell types infected with ZIKV revealed the reprogramming of gene expression and RNA modification by the virus (Lichinchi et al, 2016; Tiwari et al, 2017). Integration of the miRNA and mRNA expression data into regulatory interaction networks showed that ZIKV infection of neuronal stem cells regulated miRNA‐mediated repression of genes involved in the cell cycle, stem cell maintenance, and neurogenesis (Dang et al, 2019). The molecular mechanisms by which ZIKV causes microcephaly are not fully understood.
Autophagy is a highly conserved cellular recycling process by which intracellular material is encapsulated in double‐membrane vesicles, known as autophagosomes, and delivered to lysosomes for degradation (Zhang et al, 2016). Selective forms of autophagy play key roles in the host defense against invading pathogens, including many viruses. Virophagy is a form of autophagy that protects against viral infection by linking viral components to the growing autophagosomes and thus complements the activity of “non‐specific” macroautophagy, which promotes the survival or death of infected cells by activating innate immunity and inflammatory responses (Kudchodkar & Levine, 2009; Levine et al, 2011). Although the host cell benefits from the antiviral activity of autophagy, some viruses are able to hijack the host autophagy machinery to facilitate their own replication. For example, hepatitis C virus (HCV) and the flaviviruses dengue and Japanese encephalitis (JEV) exploit autophagy for replication and survival (Lee et al, 2008; Dreux et al, 2009; Heaton & Randall, 2010; Heaton et al, 2010; Mizui et al, 2010; McLean et al, 2011; Li et al, 2012). Recent reports have shown that ZIKV induces autophagy in fetal NSCs to enhance viral replication through its nonstructural proteins NS4A and NS4B, which inhibit AKT–mTOR signaling. However, the mechanisms by which ZIKV exploits the autophagic machinery to promote efficient replication remain incompletely understood (Hamel et al, 2015; Liang et al, 2016).
The FA pathway is also involved in the survival and long‐term maintenance of neural stem/progenitor cells during brain development (Frappart et al, 2007; Sii‐Felice et al, 2008a,b). Accordingly, loss‐of‐function mutations in any of the 19 genes of the FA pathway lead to a wide array of clinical disorders, including congenital birth defects such as microphthalmia, microcephaly, and cognitive impairments (Faivre et al, 2000; Tischkowitz & Hodgson, 2003; Kalb et al, 2007; Neveling et al, 2009; Bogliolo & Surralles, 2015). A recent study uncovered a novel role for FA pathway proteins in regulation of both virophagy and mitophagy, a mitochondria‐selective form of autophagy (Orvedahl et al, 2011; Sumpter et al, 2016). FA proteins suppress intracellular reactive oxygen species levels, control inflammasome activity, maintain mitochondrial respiratory function, and protect cells from proinflammatory cytokine‐induced cell death (Haneline et al, 1998; Garbati et al, 2013; Pagano et al, 2013; Sumpter et al, 2016).
Given the major roles of autophagy in immune defense and NSC biology and the finding that ZIKV exploits autophagy to enhance viral replication, we hypothesized that ZIKV evades virophagy by targeting FANCC. Here, we report that ZIKV infection of NSCs and induction of autophagy elevates viral replication in vitro and in a mouse model of ZIKV infection. ZIKV evades clearance by selectively suppressing the transcription of virophagy‐specific genes via downregulation of the transcription factor E2F4, which may further contribute to ZIKV‐associated microcephaly.
Results
ZIKV Infection induces autophagy in neural stem cells
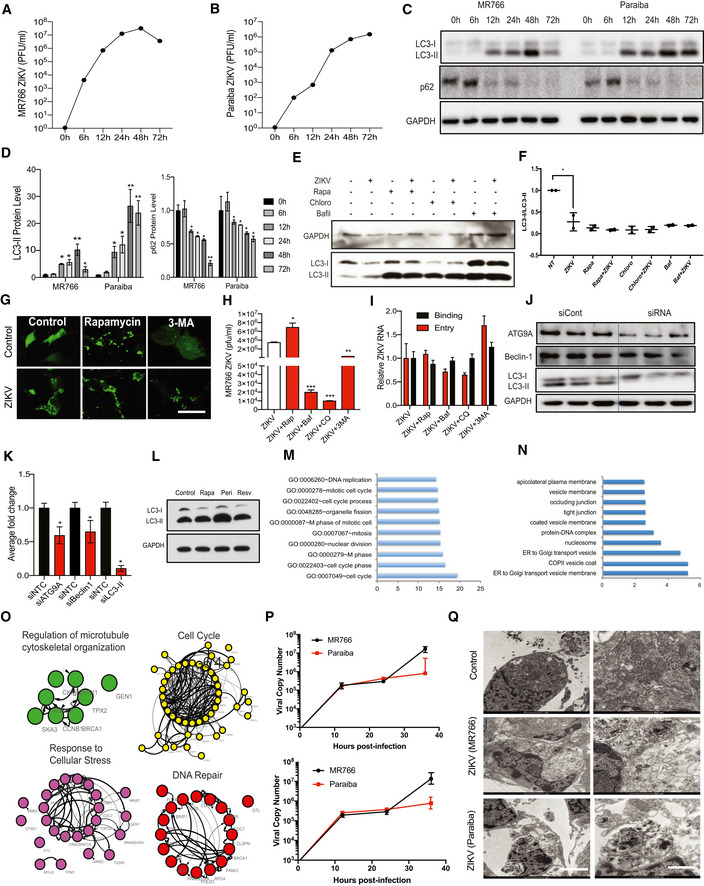
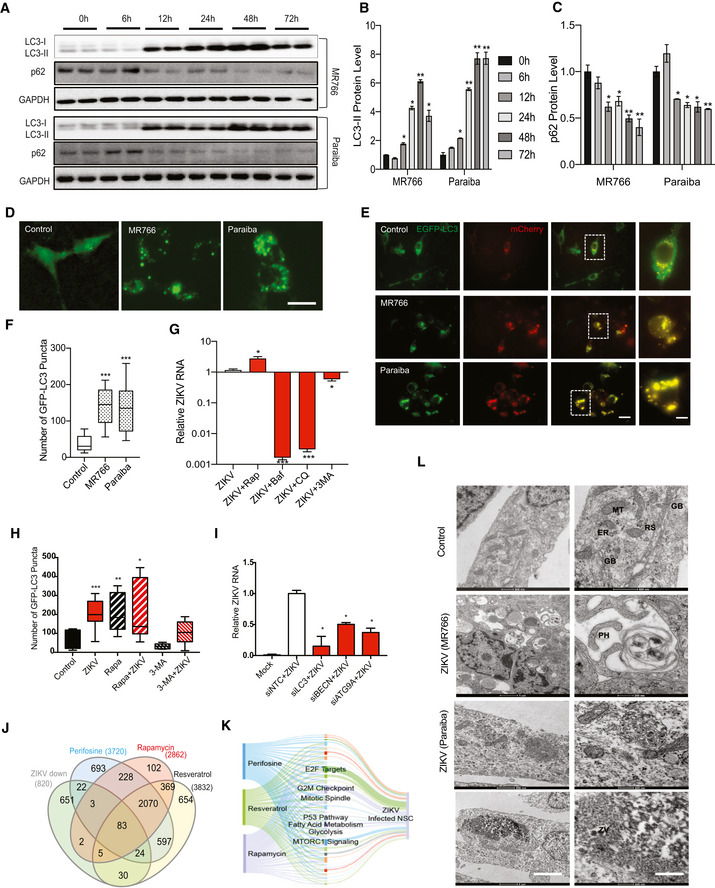
To assess autophagy induction after ZIKV infection of NSCs, we monitored expression of autophagy‐associated proteins by immunoblot analysis. During autophagy, cytosolic LC3‐I is lipidated to form LC3‐II, which associates with autophagosome membranes and facilitates recruitment of cargo into the pathway; thus, an increase in the LC3‐II levels is indicative of autophagy induction. The relative rate of autophagy (flux) was assessed by measuring levels of SQSTM1/p62, a cargo receptor that is itself degraded during autophagy. Infection of human NSCs (hNSCs) and primary mouse NSCs (mNSCs) with ZIKV MR766 or with the patient‐derived strain from Paraiba, Brazil (Fig EV1A and B, respectively) caused a marked increase in the LC3‐II levels (Figs 1A–C and, EV1C and D). Moreover, a decrease in p62 was observed between 12 and 72 h post‐infection, indicating induction of autophagy by ZIKV (Figs 1A–C, and EV1C and D). We also found an increase in the number of discrete GFP‐LC3‐positive puncta, representing autophagosomes 24 h after ZIKV infection of hNSCs expressing GFP‐LC3 (Fig 1D and E), which is consistent with enhanced LC3‐II level observed by immunoblotting. Next to further confirm the induction of autophagic flux by ZIKV infection, we transfected hNSC with an improved tandem fluorescent‐tagged mCherry‐EGFP‐LC3 reporter plasmid (Kimura et al, 2007; Zhou et al, 2012). We found that ZIKV infection enhanced the tandem autophagosome (EGFP) fusion to lysosome or late endosome (mCherry) as compared to control (Fig 1E). Overall these results showed an enhanced number of discrete GFP‐LC3‐positive puncta in ZIKV‐infected NSC cells (Fig 1F). These findings demonstrate that ZIKV infection induces an autophagic response in hNSCs and mNSCs as previously shown in fetal human NSCs (Liang et al, 2016).
Figure EV1. ZIKV infection of NSCs and induction of autophagy.
-
A, BInfection of human NSCs and plaque‐forming units for both ZIKV strain (MR766 and Paraiba) at different time points during infection.
-
CWestern blot of autophagy proteins LC3 and P62 at various times after infection of primary mouse NSCs with strains MR766 or Paraiba.
-
CDensitometric quantification of the blot shown in Fig 1C expressed as the ratio of LC3‐II/Gapdh and p62/Gapdh, mean ± SEM of n = 3 biological replicates, *P < 0.05, **P < 0.005, by Student's t test.
-
DWestern blot of LC3‐I/LC3‐II expression in control or ZIKV‐infected NSC treated with or without 100 nM rapamycin, 10 nM bafilomycin A1, or 20 μM chloroquine for 24 h.
-
EQuantification of the LC3-I/LC3-II ratio from the Western blot shown in (E). Data are presented as the mean ± SEM of two biological replicates. *P < 0.05 by Student's t test
-
FFluorescence images of GFP‐LC3 in NSCs 24 h after mock or ZIKV infection (MR766, MOI 0.2). Cells were incubated with or without 100 nM rapamycin or 5 mM 3‐methyladenine. Scale bar = 50 μm.
-
GInfection of hNSCs and plaque‐forming units for ZIKV treated with autophagy activator (rapamycin) and inhibitors (Baf, CQ and 3‐MA). Mean ± SEM of three biological triplicates. *P < 0.05, **P < 0.01, ***P < 0.001 by Student's t test.
-
HRT‐qPCR showing binding and entry of ZIKV in the presence of rapamycin, baf, CQ, and 3‐MA. Mean ± SEM of n = 3 biological replicates, ns by Student's t test.
-
IWestern blot analysis showing siRNA‐mediated knockdown of autophagy proteins ATG9A, Beclin, and LC3‐II.
-
JDensitometric analysis of KD proteins, mean ± SEM of n = 3 biological replicates. *P < 0.05 by Student's t test.
-
KWestern blot analysis of LC3‐I and LC3‐II expression in HeLa cells treated for 4 h with the autophagy inducers perifosine (50 μM), rapamycin (50 nM), and resveratrol (100 μM).
-
M, NGO analysis of biological processes (M) and cellular localization (N) enriched among the 83 genes commonly downregulated by all three autophagy activators (HeLa cells) and ZIKV infection (hNSCs). Bars represent −log10 P values.
-
OString analysis of enriched pathways common to both autophagy‐induced HeLa cells and ZIKV‐infected hNSCs. Edge (line) thickness is proportional to the combined network score, with thicker edges representing stronger evidence for protein interaction.
-
NRT–qPCR analysis of ZIKV copy number in mNSCs (upper graph) and hNSC (lower graph) at 12, 24, and 36 h post‐infection with MR766 (MOI 0.2) and Paraiba (MOI 2) ZIKV. Data are presented as the mean ± SEM of n = 3.
-
OMock‐infected mNSCs (top row) showing normal morphology of mitochondria, ER, and other cellular organelles. MR766 strain ZIKV‐infected mNSCs (middle row) showing many vacuole‐like structures, disrupted ER membrane (ER), and localization of viral particles (ZV) to membrane‐bound organelles. Paraiba strain ZIKV‐infected mNSCs (bottom row) showing many double‐membrane‐bound autophagosome‐like structures and aberrant mitochondria and ER. Scale bars 1 μm (left) and 500 nm (middle and right).
Figure 1. Activation of autophagy by ZIKV infection of NSCs.
-
AWestern blot of autophagy proteins LC3 and p62 at various time points after infection of human NSCs with strains MR766 or Paraiba.
-
B, CQuantitative representation of LC3‐II and p62 protein levels during ZIKV infection at indicated time points. Mean ± SEM, n = 3 biological replicates.
-
DGFP‐LC3 puncta of mock‐ and ZIKV‐infected hNSCs. Scale bar = 100 μm.
-
DTandem EGFP‐LC3 and mCherry punctae co‐localization in control and ZIKV‐infected hNSC. Scale bar = 100 μm, boxed magnified images with scale bar = 50 μm.
-
ENumber of GFP‐LC3 puncta in MR766 and Paraiba‐infected hNSCs, n = > 50 cells. Box plots show the mean and the smallest; largest values in whiskers represent the 10th and 90th percentiles in 50 randomly selected cells per group; and solid horizontal line indicates median. ***P < 0.001 by Student's t test.
-
FRT–qPCR of ZIKV RNA in hNSCs incubated with vehicle or 100 nM rapamycin, 20 μM chloroquine, 10 nM bafilomycin A1, or 5 mM 3‐methyladenine for 24 h. Mean ± SEM of three biological replicates. *P < 0.05, ***P < 0.001 by Student's t test.
-
GGFP‐LC3 puncta in ZIKV with or without rapamycin and 3‐MA treated hNSC cells. Cells were treated with or without rapamycin (100 nM) or 3‐methyladenine (5 μM). Box plots show the mean and the smallest; largest values in whiskers represent the 10th and 90th percentiles in 50 randomly selected cells per group; and solid horizontal line indicates median. *P < 0.05, **P < 0.01, ***P < 0.001 by Student's t test.
-
HRT–qPCR of ZIKV RNA in infected hNSCs transfected with siRNAs targeting LC3, BECN or ATG9A 48 h post‐infection. Mean ± SEM of three biological replicates. *P < 0.05 by Student's t test.
-
IVenn diagram of genes significantly downregulated in HeLa cells treated for 4 h with perifosine (50 μM), rapamycin (50 nM), and resveratrol (100 μM), compared with ZIKV‐infected hNSCs (ZIKV data from Tang et al, 2016).
-
JSankey diagram of pathways associated with genes commonly enriched in ZIKV‐infected hNSCs and perifosine‐, resveratrol‐, and rapamycin‐treated HeLa cells. The width of each band is proportional to the number of genes in the group/pathway.
-
KTransmission electron microscopy of hNSCs infected by ZIKV MR766 and Paraiba strains. Mitochondria (MT), endoplasmic reticulum (ER), Golgi bodies (GB), ribosomes (RS), phagophores (PH), and lipid droplet (LD). Scale bars, first row, 1 μm (left), 500 nm (control right); 200 nm (right).
Since autophagy can be beneficial to the host (viral clearance) or to the virus (enhanced replication), we next asked whether the autophagic response induced by ZIKV infection limits, facilitates, or has no effect on viral replication in NSCs. For this, cells were treated with the autophagy activator rapamycin, which inhibits the master autophagy regulator mTOR, or with three inhibitors of autophagy; chloroquine, bafilomycin A1, and 3‐methyladenine (3‐MA), which act at the lysosomal acidification, autolysosomal fusion, and autophagosome formation steps, respectively. ZIKV replication in hNSCs was increased by rapamycin and decreased by treatment with all three autophagy inhibitors (Fig 1G). Further, we also found an increase in the number of discrete GFP‐LC3‐positive puncta and LC3‐II protein level, similar to viral replication in rapamycin treated group while 3‐MA led to significant reduction in the GFP‐LC3 puncta, representing autophagosomes formation after ZIKV infection of hNSCs expressing GFP‐LC3 (Figs 1H and EV1E–H). Further, we evaluated effects of these pharmacological agents on binding and entry of ZIKV. We observed that these drugs did not significantly interfere with viral binding and entry steps at selected concentrations, with only mild reduction on entry by Baf and CQ (Fig EV1I). These results are consistent with earlier studies showing that inhibition of autophagy influenced vertical transmission of ZIKV in mice (Cao et al, 2017). In addition, RNAi‐mediated knockdown of core autophagic machinery LC3, BECLIN1, and ATG9A decreased ZIKV replication (Figs 1I and, EV1J and K). Collectively, these data indicate that ZIKV utilizes the autophagic machinery of NSCs to enhance viral replication.
Autophagy modulates the NSC transcriptomic response to ZIKV
To determine how induction of autophagy might be beneficial for ZIKV replication, we compared the transcriptomes of HeLa cells treated separately with three distinct autophagy inducers. HeLa is a human epithelial cell line frequently used to study autophagy, including virophagy and mitophagy. To increase the robustness of the analysis of differentially expressed genes, we treated cells with rapamycin, resveratrol, and perifosine, which activate autophagy through different mechanisms (Fig EV1L). Rapamycin directly inhibits mTOR, resveratrol inhibits mTOR through competitive inhibition of ATP binding, and perifosine inhibits the mTOR activator AKT. Total RNA from the treated cells was then analyzed by RNA‐seq to identify differentially expressed genes. A total of 3,720, 2,862, and 3,832 genes were differentially expressed in perifosine‐, rapamycin‐, and resveratrol‐treated HeLa cells, respectively, compared with untreated cells, of which, 2,153 were common to the three treatments.
The 2,153 autophagy‐associated geneset was compared with previously published transcriptomic data from hNSCs infected with ZIKV (Tang et al, 2016) to identify the potential contribution of autophagy genes to the ZIKV host response. Of the 820 genes significantly downregulated in hNSCs by ZIKV infection, 147 were differentially expressed by treatment with at least one inducer of autophagy, and 83 were common to all three (Fig 1J and Table EV1).
GO analysis of the 147 genes modulated by ZIKV and at least one autophagy inducer showed enrichment of genes involved in cell cycle, mitosis, and DNA replication (Fig EV1M), while analysis of the cellular component category showed enrichment of genes associated with endoplasmic reticulum (ER) to Golgi transport, vesicle transport, and nucleosomes (Fig EV1N). Gene set enrichment analysis (GSEA) identified shared hallmark gene sets, including E2F transcription factor targets, G2M checkpoint, mitotic spindle, P53 pathways, fatty acid metabolism, glycolysis, cellular metabolism, and MTORC1 signaling (Fig 1K) (Mootha et al, 2003; Subramanian et al, 2005). Finally, String analysis showed that the 147 common genes were enriched in highly networked modules relating to regulation of microtubule cytoskeletal organization, cell cycle, response to cellular stress, and DNA repair (Fig EV1O). Taken together, these data suggest that the induction of autophagy by ZIKV may downregulate several key pathways relevant to the microcephaly phenotype, including DNA repair, axon guidance, cellular metabolism, fatty acid metabolism, and cell cycle dysregulation.
To confirm the transcriptomic analyses and investigate ultrastructural changes in the cellular response to ZIKV infection, we performed transmission electron microscopy (TEM) of hNSCs and mNSCs at 36 h after ZIKV infection. In both hNSCs (Fig 1L) and mNSCs (Fig EV1P and Q), ZIKV infection induced an accretion of large vacuolar structures (lysosomes) and the formation of convoluted membranous structures that likely aid in the viral replication process, as previously indicated in pseudorabies virus (Xu et al, 2018), dengue and other flaviviruses infections (Lee et al, 2008; Heaton & Randall, 2010; Cao et al, 2017). C‐shaped phagophore formation, envelopment of organelles, and irregular mitochondrial morphology in the ZIKV‐infected NSCs are consistent with increased levels of autophagy and reprogramming of cellular metabolism. These findings highlight the rearrangement of the host cellular architecture for efficient ZIKV replication in NSCs. We also observed large assemblies of ZIKV particles near the ER (Fig 1L, lower panel), which is known to provide a platform for replication of other flaviviruses (Gillespie et al, 2010).
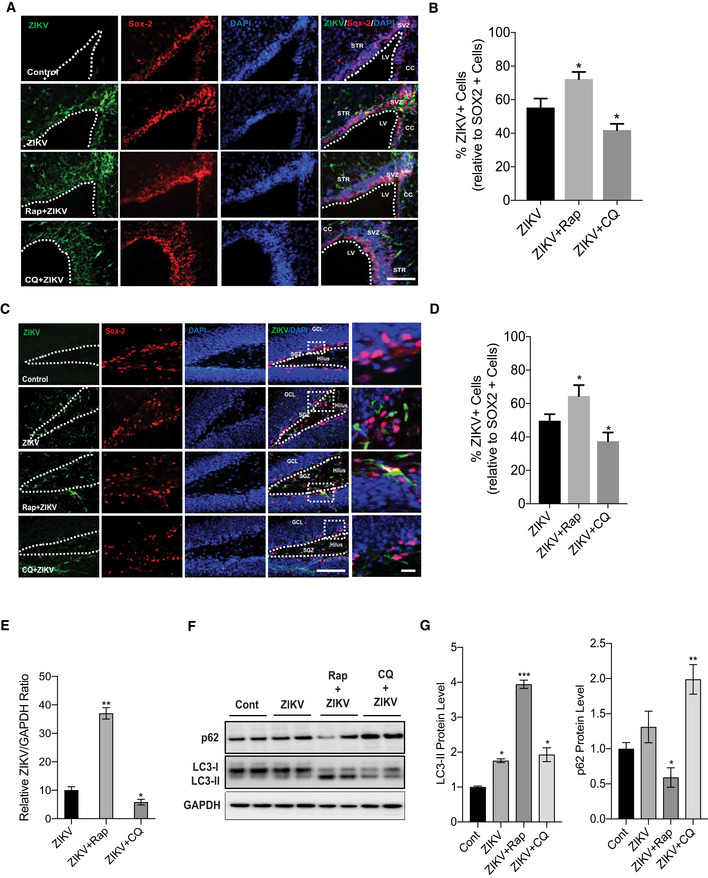
Next, we examined the role of autophagy in ZIKV infection and effects on replication in vivo. We used a murine model of ZIKV pathogenesis in which mice are pre‐injected with an anti‐Ifnar1 monoclonal antibody, which suppresses the endogenous antiviral response by blocking IFNα/β signaling (Cugola et al, 2016; Lazear et al, 2016; Zhao et al, 2016). Wild‐type C57BL/6J mice were injected with anti‐Ifnar1, infected with ZIKV, and then administered vehicle, rapamycin, or chloroquine. Animals were sacrificed 6 days later, and brain sections were immunostained for ZIKV envelope protein (ZIKVE) and the NSC marker protein Sox2. Notably, ZIKVE and Sox2 were clearly co‐localized in the neurogenic regions of the subventricular zone (SVZ; Fig 2A and B) and dentate gyrus of the hippocampus (Fig 2C and D) in ZIKV‐infected mice. Moreover, ZIKVE staining was increased when autophagy was enhanced by rapamycin as confirmed by increase in Sox2+ and ZIKVE+ co‐labeled cells and, conversely, these co‐labeled cells reduced by chloroquine treatment (Fig 2B and D) in both hippocampus and SVZ of mice brain. Further, we analyzed ZIKV RNA expression in brain after drug treatment and found that rapamycin enhanced while CQ reduced ZIKV RNA expression as compared to ZIKV control group (Fig 2E). Finally, we evaluated LC3‐II and p62 changes in vivo by ZIKV infection in the presence and absence of rapamycin and CQ. LC3‐II levels were increased by ZIKV infection by rapamycin, and p62 was decreased. Interestingly, CQ with ZIKV infection reduced the LC3‐II level with a marked increase in p62 level (Fig 2F and G). Altogether, these results demonstrate that ZIKV infection enhances autophagy in vivo.
Figure 2. Autophagy enhances viral replication in vivo .
-
A–DImmunostaining and quantification of neural progenitor marker SOX2 (red) and ZIKV envelope flavivirus group antigen (ZIKVE, green) in the SVZ (A, B) and hippocampus (C, D) of uninfected or ZIKV Paraiba‐infected wild‐type mice treated with vehicle, rapamycin, or chloroquine at 6 days post‐infection. n = 10 sections/group, mean ± SEM, *P < 0.05, **P < 0.001. Nuclei were stained with DAPI (blue). Right‐most column shows enlargements of the boxed regions. CC, cortical cortex; GCL, granular cell layer; LV, lateral ventricle; SGZ, subgranular zone; STR, striatum; SVZ, subventricular zone.
-
ERT‐qPCR for ZIKV RNA expression in brain, mean ± SEM, n = 3 biological replicates, *P < 0.05, **P < 0.001 by Student's t test.
-
F, GWestern blot for autophagy protein LC3‐II, p62, and quantification normalized with GAPDH, mean ± SEM, n = 3 biological replicates, *P < 0.05, and **P < 0.001 by Student's t test.
ZIKV evades virophagy by downregulating Fanconi anemia pathway genes
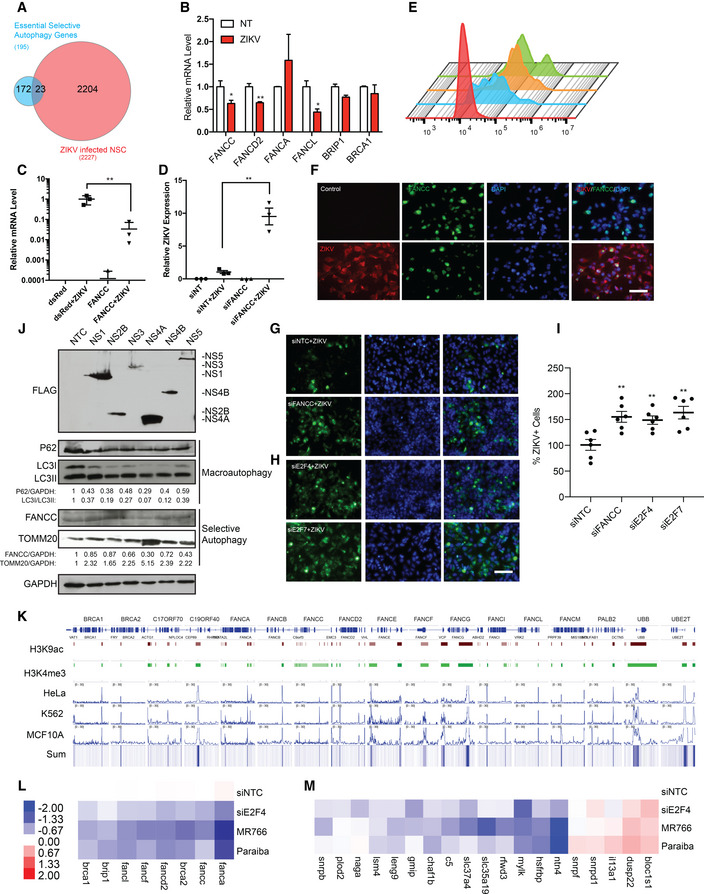
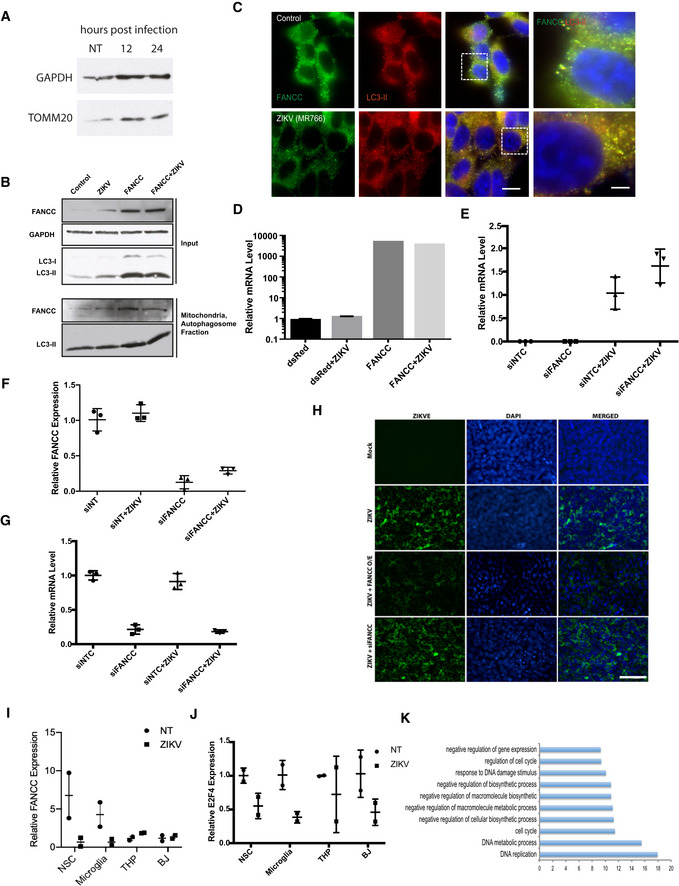
In addition to serving as a non‐selective cellular degradation pathway, specialized forms of autophagy clear specific molecules and organelles, such as lipids (lipophagy), protein aggregates (aggrephagy), organelles (mitophagy, peroxiphagy), and pathogens (virophagy). We next asked whether or how ZIKV infection might affect selective forms of autophagy, in particular, virophagy. An image‐based siRNA screen has previously identified 195 genes important for virophagy in HeLa cells, 141 of which were essential (Orvedahl et al, 2011). Comparative analyses of these 195 genes and those downregulated by ZIKV revealed that 23 of the 195 virophagy‐related genes are significantly downregulated in hNSCs by ZIKV infection (Fig 3A and Table EV2) (Tang et al, 2016). These findings suggest that ZIKV evades the selective antiviral autophagy response by downregulating virophagy genes. ZIKV‐infected NSCs also showed a time‐dependent accumulation of TOMM20, an outer mitochondrial membrane protein (Fig EV2A), indicating that infection reduces mitophagy. This observation is consistent with the TEM results (Fig 1K) and shows that ZIKV dysregulates metabolic processes.
Figure 3. ZIKV dysregulates the Fanconi anemia pathway to suppress virophagy.
- A
-
BRT–qPCR analysis of FA pathway genes at 48 h after ZIKV infection of hNSCs. Mean ± SEM of biological triplicates. *P < 0.05, **P < 0.01 by Student's t test.
-
C, DRT–qPCR analysis of ZIKV mRNA 48 h after ZIKV infection of HeLa cells overexpressing FANCC (C) or FANCC‐specific siRNA (D). Mean ± SEM of biological triplicates. **P < 0.01 by Student's t test.
-
EFlow cytometry analysis of ZIKVE expression in mock‐infected (red), ZIKV‐infected (blue), ZIKV‐infected siFANCC‐transfected (orange), and ZIKV‐infected siE2F4‐transfected (green) hNSCs at 48 h post‐infection.
-
EZIKV NS1 and FANCC immunostaining 48 h after ZIKV infection of hNSCs. Scale bar = 100 μm.
-
FZIKV NS1 expression 48 h after ZIKV infection of hNSCs expressing control siRNA (NTC) or siFANCC‐targeting siRNA. Scale bar = 100 μm.
-
H, IZIKV NS1 expression 48 h after ZIKV infection of hNSCs expressing control (NTC) or siE2F4‐targeting siRNA. Mean ± SEM of six imaging fields of biological triplicates, **P < 0.01 by Student's t test, Scale bar = 100 μm.
-
JImmunoblot of macroautophagy (p62, LC3I/LC3II) and selective autophagy (FANCC, TOMM20) proteins 24 h after overexpression of FLAG‐tagged ZIKV NS1, NS2B, NS3, NS4A, NS4B, and NS5 in 293FT cells.
-
IAnalysis of E2F4 ChIP‐seq datasets (Encode) showing direct chromatin‐binding interaction between E2F4 and FA pathway genes in HeLa (GEO: GSM935365, Farnham lab), K562 (GEO: GSM935600, Farnham lab), and MCF10A (GEO: GSM: 935400, Struhl lab) cell lines. H3K9ac and H3K4me3 datasets identify promoter regions. The genomic region is displayed in log scale with the scale range identified in each panel (0–30). The summed interaction (Sum) across all three cell types is represented as a heatmap.
-
L, MHeatmaps of RT–qPCR analysis of FA pathway genes (K) or essential selective autophagy genes (L) in hNSCs 48 h after transfection with control (NTC) or E2F4‐targeting siRNAs or after infection with ZIKV MR766 and Paraiba strains. Color patterns in heatmap indicate as red showing the highest expression and blue showing the lowest expression of genes.
Figure EV2. FANCC modulates virophagy in ZIKV‐infected cells.
-
AWestern blot analysis of TOMM20 in ZIKV‐infected cells at 12 and 24 h post‐infection.
-
BWestern blot analysis of LC3‐I, LC3‐II, and FANCC expression in mock‐ or ZIKV‐infected HeLa cells expressing a control plasmid or a FANCC overexpression plasmid. Upper panel shows whole cell lysates, and lower panels show subcellular fractions enriched in mitochondria and autophagosomes.
-
CConfocal immunofluorescence images showing co‐labeling of FANCC with LC3‐II antibody in hNSC infected with ZIKV (MR766) and control group. Scale bar = 100 μm, boxed magnified images with scale bar = 50 μm.
-
D, ERT–qPCR analysis of relative expression of FANCC genes in control or ZIKV‐infected HeLa cells expressing control plasmid or FANCC overexpression plasmid FANCC (D), or control (NT) or FANCC‐specific siRNAs (E). Cells were analyzed at 48 h post‐infection. Data are presented as the mean ± SEM of biological triplicates.
-
F, GRT–qPCR analysis of ZIKV (F) and FANCC (G) gene expression in mock‐ or ZIKV‐infected HeLa cells expressing control (NTC) or FANCC‐specific siRNA. Cells were analyzed 24 h post‐infection. Data are presented as the mean ± SEM of n = 3 biological replicates.
-
HImmunofluorescence images of ZIKVE expression in ZIKV‐infected (MR766, MOI 0.2) HeLa cells after FANCC knockdown (siFANCC) or overexpression (O/E). Cells were stained at 48 h after ZIKV infection. Scale bar = 100 μm.
-
I, JRelative mRNA expression of FANCC and E2F4 in mNSC, human microglial, macrophage/monocyte (THP‐1), and fibroblast (BJ) cell lines at 36 h after ZIKV infection. Mean of biological duplicates.
-
KGene ontology analysis of predicted E2F4 target genes downregulated by ZIKV infection. Bars represent −log10 P value.
Among the 23 virophagy‐related genes significantly downregulated upon ZIKV infection are a number of FA pathway genes with known roles in DNA damage repair. Recent work has identified unexpected and essential roles for FANCC and other FA genes, including FANCL, in both virophagy and mitophagy (Sumpter et al, 2016; Tang et al, 2016) Moreover, FANCC is crucial to proper central nervous system development, and mutations in FANCC are associated with congenital abnormalities such as microcephaly and microphthalmia. These observations suggest a possible link between FANCC downregulation and ZIKV‐induced microcephaly (Auerbach, 2009), and this is supported by the observation that FANCC, FANCD2, FANCL, BRIP1, and BRCA1 mRNA levels were downregulated 48 h after ZIKV infection in hNSCs (Fig 3B).
FANCC has been shown to directly interact with both Sindbis and herpes simplex virus type 1 capsid proteins located on autolysosomes in infected HeLa cells (Sumpter et al, 2016). To determine whether FANCC traffics to autophagosomes in ZIKV‐infected HeLa cells, we probed mitochondria fractions from ZIKV‐infected and/or FANCC‐overexpressing HeLa. FANCC association with the mitochondrial fraction was observed by immunoblot, thereby suggesting a role of FANCC in autophagy (Fig EV2B) (Sumpter et al, 2016). In addition, FANCC co‐localized with autophagosome as evidenced by immunofluorescence co‐labeling with LC3‐II (Fig EV2C). Moreover, FANCC overexpression or knockdown decreased ZIKV expression by two orders of magnitude or increased it ~10‐fold, respectively (Figs 3C and D and EV2D–G). Similarly, flow cytometry analysis and immunofluorescence staining of ZIKVE in hNSCs and HeLa cells corroborated the inverse correlation between FANCC expression and ZIKV replication (Figs 3E–I and EV2H). Taken together, these data demonstrate that ZIKV downregulates selective autophagy genes, including FA pathway genes.
To determine how ZIKV infection regulates FANCC expression, we cloned and overexpressed FLAG‐tagged ZIKV nonstructural proteins NS1, NS2B, NS3, NS4A, NS4B, and NS5 in 293FT cells (Fig 3J). Immunoblotting analysis of p62 and LC3I/LC3II indicated that, while overexpression of all NS proteins caused a slight induction of autophagy, NS4A and NS4B induced the autophagic response, which is consistent with previous observations (Liang et al, 2016). FANCC protein expression was downregulated most significantly by NS4A and NS5, while the mitophagy marker TOMM20 was increased by NS4A. These data suggest that NS4A induces macroautophagy to enhance efficient viral replication while downregulating the essential selective autophagy protein FANCC.
Transcription factor E2F4 regulates essential selective autophagy genes
Interestingly, ZIKV infection consistently downregulated FA genes in NSCs (Fig 3B) but not in HeLa cells, despite robust infection, suggesting that ZIKV‐mediated regulation of selective autophagic genes may be cell‐type specific. To test this, we analyzed FANCC expression in several other ZIKV‐infected human cells, including microglia, monocyte/macrophages (THP‐1), and foreskin fibroblasts (BJ cells) and found that ZIKV significantly decreased FANCC expression only in microglia (Fig EV2I). Thus, the selectivity with which ZIKV downregulates FANCC expression suggests a potential neurotropic effect.
We investigated this further by analyzing transcriptomic data from ZIKV‐infected hNSCs using iRegulon software (Janky et al, 2014), which identifies regulators, transcription factors, and target genes common to a given geneset. From the ZIKV‐infected hNSC dataset, we identified a number of candidate transcription factors, including the E2F family member E2F4. RT–qPCR analysis confirmed that E2F4 is downregulated following ZIKV infection of hNSCs and microglia, but not of THP‐1 or BJ cells, consistent with pattern of FANCC expression following ZIKV infection (Fig EV2J). Gene ontology analysis of predicted E2F4 target genes differentially expressed 3 days post‐infection revealed enrichment of genes regulating DNA replication, metabolism, cell cycle, and cellular biosynthesis, all of which are important for efficient viral replication (Fig EV2K). In support of this, knockdown of E2F4 in hNSCs enhanced viral replication, as evidenced by flow cytometry (Fig 3E) and immunostaining (Fig 3G and H).
Analysis of ENCODE ChIP‐seq datasets from three additional human cell lines; HeLa (immortalized cervical cancer cells), K562 (immortalized chronic myelogenous leukemia cell line), and MCF10A (normal mammary epithelial cell line) revealed a direct interaction between E2F4 and all members of the FA family at actively transcribed promoter sites identified by H3K4me3 and H3K9ac peaks (Fig 3K). siRNA‐mediated knockdown of E2F4 in hNSCs confirmed that E2F4 positively regulates transcription of FA genes (Figs 3L and EV3A) and at least 14 other essential selective autophagy genes (Fig 3M) consistent with ZIKV MR766 and Paraiba infection. Collectively, these data provide evidence that E2F4 directly regulates FANCC expression and essential selective autophagy genes and is downregulated during ZIKV infection.
Figure EV3. ZIKV and FANCC induce autophagy and apoptosis.
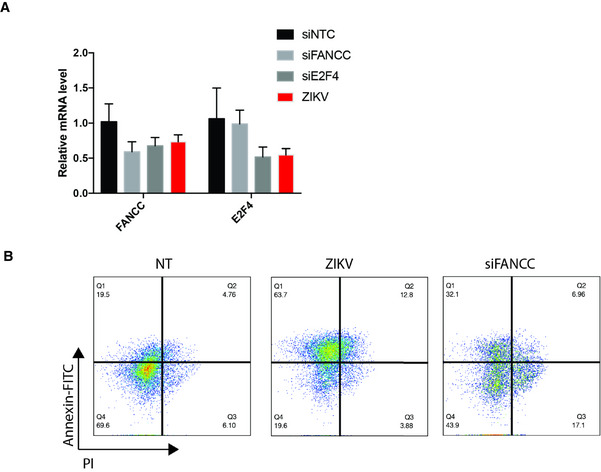
- RT–qPCR analysis of FANCC and E2F4 expression in hNSCs expressing control (NTC), FANCC‐specific, or E2F4‐specific siRNAs, or infected with ZIKV 48 h post‐treatment. Data are presented as the mean ± SEM of biological triplicates.
- Flow cytometric analysis of annexin V and PI staining of hNSCs at 48 h after mock (left), ZIKV infection (middle), or siFANCC transfection (right). Q1, early apoptotic cells (annexin+/PI−); Q2, late apoptotic cells (annexin+/PI+); Q3, necrotic cells (annexin−/PI+); Q4, healthy cells (annexin−/PI−).
Downregulation of FANCC decreases neurosphere growth
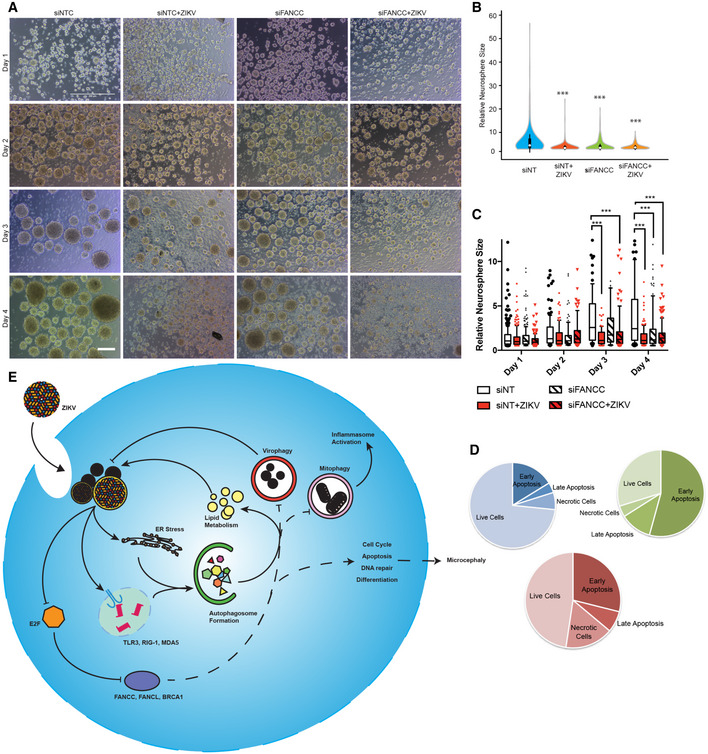
We hypothesized that downregulation of FANCC might contribute to ZIKV pathogenesis not only by abrogating virophagy and increasing viral replication but also by dysregulating cell cycle, apoptosis, DNA repair, and multipotency genes in infected NSCs, thereby contributing to the microcephaly phenotype. To examine this, we transfected hNSCs with control or FANCC siRNA, generated neurospheres, and infected them with ZIKV strain MR766 1 day later. Consistent with previous studies, ZIKV infection reduced neurosphere formation and growth (Fig 4A–C) (Dang et al, 2016; Qian et al, 2016). Interestingly, FANCC knockdown alone also attenuated neurosphere growth, further reinforcing the concept that FANCC downregulation by ZIKV may contribute to microcephaly. Neurospheres formed by infected siFANCC‐expressing NSCs were similar in size to those formed by infected cells expressing control siRNA but showed greater cell death and reduced integrity based on gross morphology (Fig 4A). Flow cytometric analysis of propidium iodide and annexin V staining of neurospheres confirmed an increase in apoptosis in ZIKV‐infected and FANCC knockdown cells (Figs 4D and EV3B). Thus, downregulation of FANCC not only reduces virophagy but attenuates neurosphere growth and formation through the induction of apoptosis (Fig 4E).
Figure 4. Downregulation of FANCC increases ZIKV replication and inhibits neurosphere growth.
-
ARepresentative images of mock‐ or ZIKV‐infected human neurospheres expressing control (NTC) or FANCC‐targeting siRNAs at 1–4 days post‐infection. Scale bar = 250 μm.
-
B, CViolin plot (B) and box plot (C) of relative size of neurospheres treated as described in (A) and measured on day 4 (B) or days 1–4 (C). Box plots show the mean and the smallest; largest values in whiskers represent the 10th and 90th percentiles in 50 randomly selected cells per group; and solid horizontal line indicates median. ***P < 0.001 by Student's t test.
-
DPie chart displaying the percentage of early apoptotic, late apoptotic, or necrotic hNSCs at 48 h after mock infection (blue), ZIKV infection (green), or siFANCC transfection (red).
-
DModel of the effects of ZIKV infection on ER stress, autophagy induction, and FA gene expression leading to impaired virophagy and mitophagy.
ZIKV induces autophagy and downregulates FA genes in mice
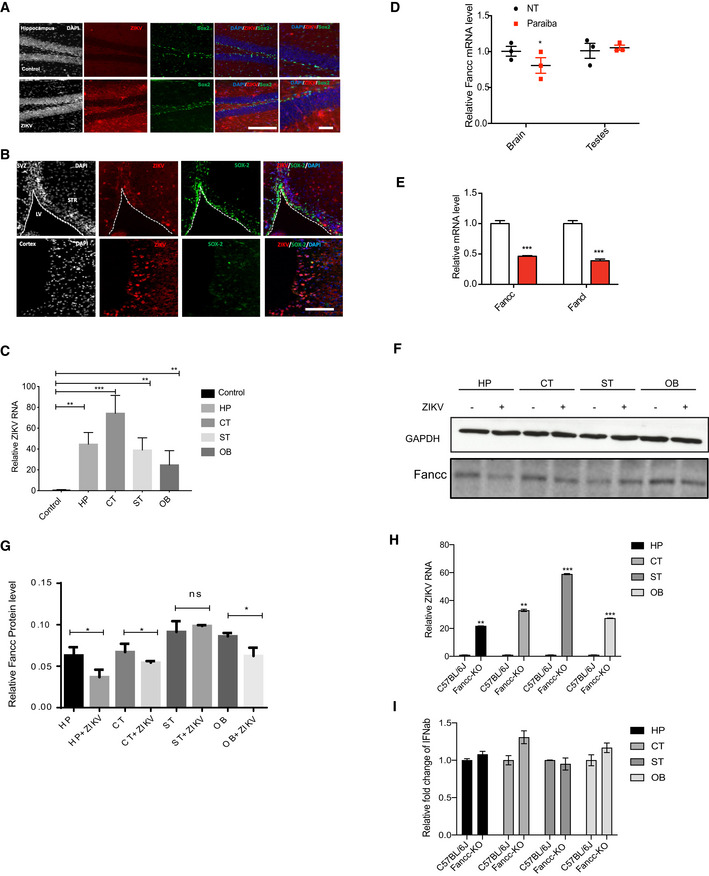
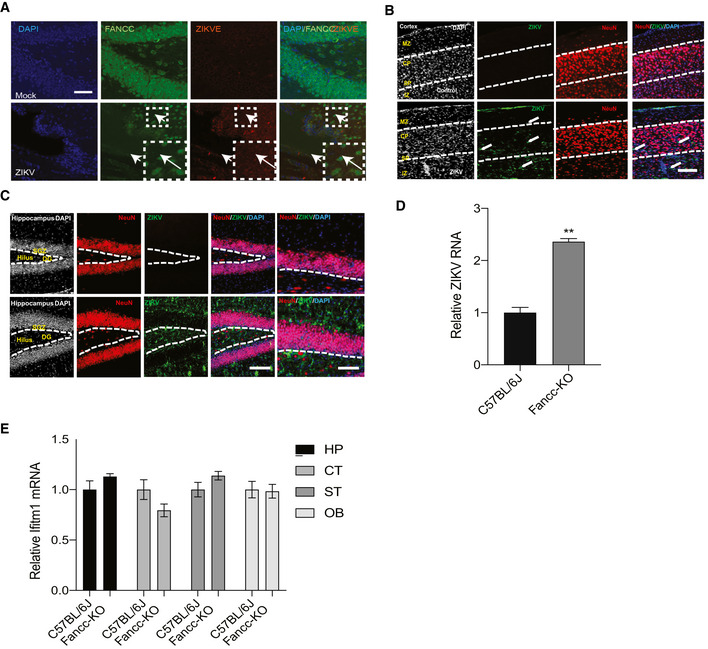
To determine in vivo relevance of our findings, we utilized a previously established murine model of ZIKV pathogenesis in which mice lack the interferon receptor (Ifnar1 −/−) (Cugola et al, 2016; Lazear et al, 2016; Li et al, 2016; Zhao et al, 2016). Ifnar1 −/− mice were infected with ZIKV and sacrificed 6 days later. Brain sections were immunostained for ZIKV envelope protein (ZIKVE), NSC marker protein Sox2, immature neuronal marker Dcx, and mature neuronal marker NeuN. Consistent with previously established models, ZIKVE was detected in Sox2 expressing NSCs in the neurogenic regions of the subventricular zone (SVZ) of the anterior forebrain and the subgranular zone of the hippocampus in ZIKV‐infected mice (Fig 5A and B). RT–qPCR analysis revealed that ZIKV efficiently infected different brain regions such as hippocampus, cortex, striatum, and olfactory bulb (Fig 5C).
Figure 5. ZIKV induces autophagy and downregulates Fancc in vivo .
-
A, BImmunostaining of neural progenitor marker SOX2 (green) and ZIKV envelope flavivirus group antigen (ZIKVE, red) in the hippocampus (A) and SVZ (B) of uninfected or ZIKV Paraiba‐infected Ifnar −/− mice 6 days post‐infection. Nuclei were stained with DAPI (gray). Right‐most column in (A) shows enlargements of the regions. CC, cortical cortex; GCL, granular cell layer; LV, lateral ventricle; SGZ, subgranular zone; STR, striatum; SVZ, subventricular zone. Scale bars, 100 μm.
-
CRT–qPCR analysis of relative ZIKV RNA in different brain regions of Ifnar −/− mice. Mean ± SEM of n = 3 biological replicates, **P < 0.005, ***P < 0.001 by Student's t test.
-
CRT–qPCR analysis of relative Fancc mRNA levels from whole brains or testes in mock‐ and ZIKV Paraiba‐infected Ifnar −/− mice 6 days post‐infection. Mean ± SEM of n = 3 biological replicates, *P < 0.05 and ns by Student's t test.
-
DRT–qPCR analysis of relative Fancc or Fancl mRNA levels from whole brains from mock‐ and ZIKV Paraiba‐infected Ifnar −/− newborn mice. Mean ± SEM of n = 3 biological replicates, ***P < 0.001 by Student's t test.
-
EWestern blot analysis of Fancc protein in brain regions from mock‐ and ZIKV Paraiba‐infected Ifnar −/− mice 6 days post‐infection. CT, cortex; HP, hippocampus; OB, Olfactory Bulb; ST, striatum.
-
FBar graph showing the quantification of Fancc proteins, mean ± SEM of n = 3 biological replicates, *P < 0.05 and ns by Student's t test.
-
GRT–qPCR analysis of relative ZIKV RNA in different brain regions of Fancc KO neonatal mice 6 days post‐infection. Mean ± SEM of n = 3 biological replicates, **P < 0.005, ***P < 0.001 by Student's t test.
-
HRT–qPCR for Ifnab gene expression in wild type and Fancc KO mice. Mean ± SEM of n = 3 biological replicates, ns by Student's t test.
To analyze ZIKV‐mediated FANCC downregulation in vivo, we examined the brains of mock‐ and ZIKV‐infected Ifnar1 −/− mice 6 days post‐infection. RT–qPCR analysis showed that ZIKV‐mediated downregulation of Fancc in infected brains but not infected testes, despite infection in both tissues (Fig 5D). Moreover, infected newborn brains showed significant downregulation of both Fancc and Fancl, consistent with our in vitro findings (Fig 5E). Similarly, immunohistochemical analysis showed that ZIKV infection reduced the Fancc in hippocampus of mice brain (Fig EV4A). Further, immunoblotting was performed for Fancc protein level in different brain region and we found that Fancc protein levels were reduced in hippocampus, cortex, and olfactory bulb of ZIKA‐infected mice (Fig 5F and G).
Figure EV4. In vivo model of ZIKV infection.
-
AImmunoreactivity of Fancc (green) with ZIKVE (red) in control and ZIKV‐infected hippocampus brain region. Arrows represent reduction in Fancc immunoreactivity in ZIKV‐infected cells, Scale bar = 50 μm.
-
B, CImmunostaining of mature neuronal marker NeuN (red) and ZIKV envelope flavivirus group antigen (ZIKVE, green) in the cortex (A), hippocampus (B) of uninfected or ZIKV Paraiba‐infected Ifnar −/− mice 6 days post‐infection. Nuclei were stained with DAPI (gray). DG, dentate gyrus; GCL, granular cell layer; InGr, internal granular layer; SGZ, subgranular zone. Scale bars are as indicated on image.
-
DRT‐qPCR for ZIKV RNA expression in wild‐type and Fancc KO mice brain infected with ZIKV. Mean ± SEM, n = 3 biological replicates, **P < 0.001 by Student's t test.
-
DRT‐qPCR for Ifitm1 mRNA expression in wild type and Fancc KO mice brain. Mean ± SEM, n = 3 biological replicates, ns by Student's t test.
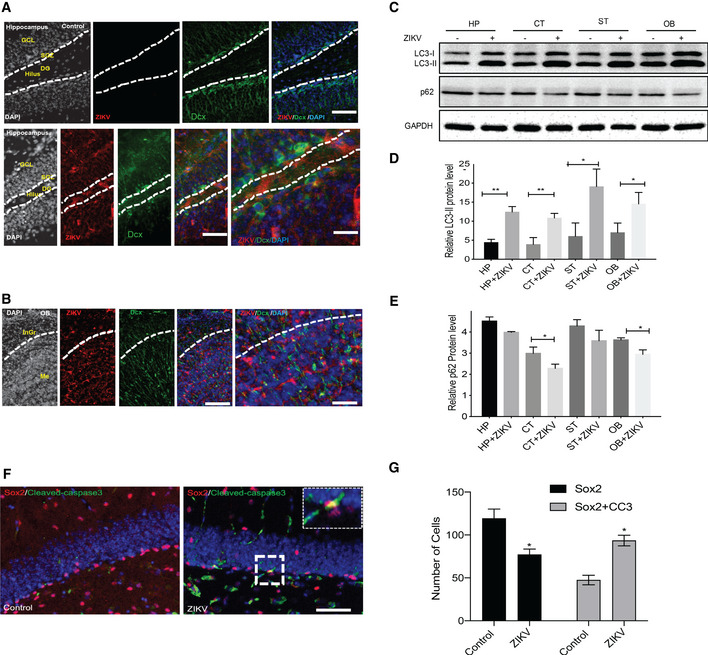
To further confirm the role of FANCC in ZIKV infection and regulation of autophagy, we utilized the Fancc KO and wild‐type (C57BL/6J) mice. The 2‐week old neonatal pups from Fancc KO and wild‐type mice were infected with MR766 ZIKV strain and 6 days later, pups were sacrificed to collect and dissect the brain regions. RT–qPCR analysis revealed that ZIKV efficiently infected different brain regions such as hippocampus, cortex, striatum, and olfactory bulb and whole brain of Fancc KO mice as compared to wild type (Figs 5H and EV4D). We next analyzed the expression of interferon genes, such as Ifnab and Ifitm1 in wild‐type and Fancc KO mice brains, which showed no significant changes (Figs 5I and EV4E). In addition, immunohistochemistry showed that ZIKV was also detected in immature Dcx+ neurons in hippocampus and olfactory bulb (Fig 6A and B) but not in mature NeuN+ neurons in cortex and hippocampus (Fig EV4B and C). Next, immunoblotting of control and ZIKV infected brain regions showed robust increase of autophagic protein such as LC3‐II and downregulation of p62 (Fig 6C–E). Thus, immunoblot analyses of cortex, hippocampus, striatum, and olfactory bulb regions of mock‐ and ZIKV‐infected mice showed an increase in lipidation of LC3‐I to LC3‐II, confirming that ZIKV induces autophagy. Further, we found that ZIKV infection in Fancc KO reduced NSC population (Sox2+ cells) as compared to wild‐type mice and this reduction was due to enhanced apoptosis of NSCs as evaluated by Sox2/cleaved‐caspase‐3+ co‐labeled cells (Fig 6F and G). Altogether, these results show that ZIKV induces autophagy and downregulates the essential selective autophagy genes FANCC both in vitro and in vivo.
Figure 6. ZIKV infection of Ifnar −/− and Fancc KO mice induces autophagy and NPCs cell death.
-
A, BImmunostaining of immature neuronal marker DCX (green) and ZIKV envelope (ZIKVE, red) in the hippocampus and olfactory bulb of uninfected or ZIKV Paraiba‐infected Ifnar −/− mice 6 days post‐infection. Nuclei were stained with DAPI (gray). Bottom row shows enlargements of the hippocampus region. DG, dentate gyrus; GCL, granular cell layer; InGr, internal granular layer; Me, medulla; OB, olfactory bulb; SGZ, subgranular zone. Scale bars, 50 and 100 μm.
-
C–EWestern blot of autophagy protein LC3 and p62 in different brain region of Fancc KO neonatal mice 6 days post‐infection of ZIKV (MR766). Mean ± SEM of n = 3 biological replicates, *P < 0.05, **P < 0.005, by Student's t test. CT, cortex; HP, hippocampus; OB, Olfactory Bulb; ST, striatum.
-
FRepresentative immunofluorescent images showing immunoreactivity of neural progenitor marker (Sox2) with apoptosis marker (Cleaved‐caspase‐3, CC3) in hippocampus region of Fancc KO mice. Scale bar = 50 μm.
-
DQuantitative analysis of number of Sox2+ cells and Sox2/CC3+ co‐labeled cells in Fancc KO mice hippocampal brain region. Mean ± SEM, n = 3 biological replicates, *P < 0.05 by Student's t test.
Discussion
Collectively, these data establish the parasitic relationship between ZIKV and its host cells in the induction of macroautophagy to facilitate efficient viral replication in vitro and in vivo. ZIKV reprograms the host transcriptome, alters the cell ultrastructure, and downregulates the E2F family of transcription factors to perturb cellular metabolic processes, cell cycle regulation, and FA gene expression to enhance viral replication. Our findings on the effect of ZIKV‐mediated downregulation of FANCC in both virophagy and neurosphere formation suggest a causal link between increased viral replication and the clinically observed microcephaly phenotype.
Interestingly, the ability of ZIKV to induce an autophagic response in host cells is shared by other RNA viruses and flaviviruses, such as dengue, HCV, and JEV (Heaton & Randall, 2010; Li et al, 2012; Mateo et al, 2013). We found that the autophagic flux in NSCs was elevated due to ZIKV infection and was beneficial for viral replication, as shown by the ability of autophagy inhibitors to decrease viral replication both in vitro and in vivo. We hypothesize that autophagy assists in metabolic remodeling; for example, through increased fatty acid synthesis and lipid droplet formation, and through increased synthesis of membranous scaffolds on which the viral RNA replication and translational machinery are assembled (Dreux et al, 2009; Heaton & Randall, 2010; Mateo et al, 2013). Consistent with our finding here, flaviviruses such as dengue and HCV have been shown to co‐opt UPR signaling to enhance their replication; however, it is unclear whether there is a causal relationship between UPR and autophagy during ZIKV infection (Blazquez et al, 2014). JEV‐mediated induction of autophagy in Neuro2a mouse neuroblastoma cells has been shown to facilitate evasion of the antiviral immune response, potentially through degradation of type I interferons (Jin et al, 2013).
To analyze the inverse relationship; that is, how ZIKV induces autophagy in the host cell, we analyzed transcriptomic and ultrastructural changes in NSCs and HeLa cells. RNA‐seq analysis of HeLa cells treated with the autophagy inducers perifosine, rapamycin, or resveratrol identified a number of genes shown to be downregulated by ZIKV infection of hNSCs (Tang et al, 2016) and revealed several shared pathways that may contribute to the microcephalic phenotype demonstrated both in vitro and in vivo (Cugola et al, 2016; Dang et al, 2016; Li et al, 2016; Miner et al, 2016; Qian et al, 2016). These data confirm previous studies that implicate autophagy in the regulation of cell cycle progression (Lum et al, 2005; Filippi‐Chiela et al, 2011) but also reveal a highly networked set of genes dysregulated by autophagy in ZIKV‐infected NSCs. Enrichment of genes in the p53 pathway provides a strong link between the autophagic response (Lee et al, 2012) and the regulation of cell cycle and metabolic stress observed in infected cells types.
Our TEM ultrastructural analysis of ZIKV‐infected hNSCs and mNSCs revealed gross morphological changes such as rearrangement of cellular membrane structures, increased vacuolar cavities, and increased numbers of phagophores, which are consistent with previous ultrastructural studies of dengue‐ and ZIKV‐infected cells (Hamel et al, 2015; Hanners et al, 2016). These changes also fit well with our RNA‐seq analyses, highlighting the link between the autophagic degradation of lipids, or lipophagy, accumulation of lipid droplets, and membrane reorganization, which are crucial for efficient viral replication. Because ZIKV is highly neurotropic and preferentially targets NSCs, infection‐induced alterations in lipid metabolism and induction of ER stress may have neurodegenerative effects beyond their impact on viral replication. For example, changes in lipid metabolism have been linked to neurological disorders, including Alzheimer's disease, multiple sclerosis, and synapse loss (Cutler et al, 2003; Haughey, 2010; Liu et al, 2010).
Although autophagy was initially recognized as a relatively non‐specific degradation and recycling pathway, it has become clear that selective forms of autophagy degrade specific cellular components, including mitochondria (mitophagy) and viral components (virophagy). Here, we showed that, in addition to hijacking the host autophagic machinery to amplify viral replication, ZIKV infection downregulates 23 genes essential for virophagy. Among these, FANCC and FANCL were both significantly downregulated by ZIKV infection in hNSCs and human microglial cells but not in cells unrelated to the nervous system such as HeLa, BJ, and THP‐1 monocytes. These findings may provide further insight into the neurotropism of ZIKV.
The FA gene family is required for mitophagy, inflammation, and DNA repair in bone marrow and HeLa cells (Niedzwiedz et al, 2004; Sumpter et al, 2016). Perturbation of either mitophagy or DNA repair mechanisms could potentially cause apoptosis and contribute to the microcephaly phenotype, in which the NSC population is depleted. ZIKV‐induced ER stress and inflammasome activation may also exacerbate the pathophysiological processes leading to apoptotic cell death. Our neurosphere model reinforced the potential causal relationship between ZIKV‐mediated FANCC downregulation, apoptosis, and microcephaly.
To determine the mechanism by which ZIKV downregulates virophagy genes, including FANCC, we analyzed the contribution of both ZIKV nonstructural proteins and dysregulated host factors using biochemical and bioinformatics approaches. In accordance with previous reports, we found that ZIKV NS4A and NS4B facilitated the induction of autophagy, as evidenced by enhanced formation of LC3II and degradation of p62 (Liang et al, 2016). Western blot analyses of FANCC and TOMM20 showed that FANCC expression and mitophagy were reduced to the greatest extent by NS4A. In addition, we elucidated the role of FANCC in ZIKV infection by using Fancc KO mice, which showed increased ZIKV infection as compared to wild‐type littermates and induced level of autophagic proteins in various brain regions without affecting the expression of interferon related genes.
To identify host factors downregulated by ZIKV that regulate FANCC and other selective autophagy machinery, we performed unbiased bioinformatics analyses and identified a number of master regulators of FA gene expression. E2F4 has previously been implicated in FA‐associated gene regulation and in cell cycle, mitotic spindle checkpoint, differentiation, and apoptosis regulation (Doerks et al, 2002; Hoskins et al, 2008; Kawatsuki et al, 2016). Knockdown and ChIP‐seq analyses revealed a direct interaction between E2F4 and transcriptional regulation of 23 essential selective autophagy genes, consistent with ZIKV infection. These data suggest a novel role for E2F4 in innate immune function and selective autophagy. Additionally, a recent study has established a regulatory link between E2F and IFN type I and II expression during adenovirus infection (Zheng et al, 2016). Thus, ZIKV downregulation of the E2F family may not only decrease FANCC expression and suppress virophagy but also modulate host IFN expression during virus replication. Further work will be required to understand the role of E2F transcriptional regulation in ZIKV infection and NSC biology.
In summary, we have shown that ZIKV induces autophagy in mouse and human NSCs, which contributes to the metabolic reprogramming, cellular membrane restructuring, and cell cycle dysregulation characteristic of ZIKV‐infected cells. We identified a novel mechanism by which ZIKV NS4A downregulates essential selective autophagic genes, including FANCC, to evade virophagy and mitophagy. FANCC plays multiple roles in ZIKV infection as a key regulator of genes involved in virophagy, cell cycle progression, apoptosis, and, potentially, microcephaly. Lastly, we identified the transcription factor E2F4 as a critical regulator of essential selective autophagy genes during ZIKV infection.
Materials and Methods
All studies were conducted in accordance with approved IRB protocols by the University of California, San Diego. All animal work was approved by the Institutional Review Board at the University of California, San Diego and was performed in accordance with Institutional Animal Care and Use Committee guidelines.
ZIKV propagation
All studies were conducted in accordance with protocols approved by the Institutional Review Board of the University of California, San Diego. ZIKV prototype MR766 (National Institute of Health) and Brazilian strain Paraiba (Stevenson Lab, University of Miami Life Science and Technology Park) were propagated in low‐passage Vero cells. Vero cells (American Type Culture Collection) were infected with viruses at a MOI of 1 in E‐MEM medium supplemented with 10% FBS, and the medium was exchanged at 24 h post‐infection. Viral supernatants were collected 4 days post‐infection, and titers were assessed using iScript One‐Step RT‐PCR kit (Bio‐Rad). Viral copy number was calculated from a standard curve of in vitro‐transcribed viral RNA transcripts.
Neural stem cell culture
Neural stem cells (NSCs) were isolated from the brains of embryonic day 12 C57BL/6 mouse fetuses and cultured as neurospheres, as described previously (Tiwari et al, 2014). In brief, brain tissue was dissected from fetuses on embryonic day 12, washed with cold Hanks balanced salt solution, and minced with a surgical blade into small pieces. A single cell suspension was made by incubating the brain pieces in 0.05% trypsin/EDTA at 37°C for 30 min, and trypsin was neutralized with 0.5 mg/ml soybean trypsin inhibitor. Cells were resuspended in neurobasal medium containing 2 mM l‐glutamine, 1% antibiotic/antimycotic, 2% B‐27 supplement, 1% N‐2 supplement, and 20 ng/ml each of epidermal growth factor (EGF) and basic fibroblast growth factor (bFGF). Flasks were placed in a humidified 5% CO2 incubator at 37°C. After 5–7 days in culture, the cells formed neurospheres, which are aggregates of multipotent and self‐renewing NSCs, capable of differentiating into neurons, glial cells, and oligodendrocytes. Human NSCs derived from H9 hESCs were purchased from Gibco (N7800200) and cultured in Knockout D‐MEM/F‐12 media containing 2 mM GlutaMax, 20 ng/ml bFGF, 20 ng/ml EGF, and 2% StemPro Neural Supplement on Matrigel‐ or CELLStart‐coated plates. Neurospheres were formed by dissociating cells with Accumax to form a single cell suspension and seeding into untreated plates.
ZIKV infection of human and mouse cells
Human and mouse NSCs were plated as monolayers in 12‐well plates coated with Matrigel and poly‐l‐lysine, respectively. HeLa cells (American Type Culture Collection), microglial cell line (Karn Lab, Case Western Reserve University), THP‐1 monocytes (American Type Culture Collection), and BJ fibroblasts (American Type Culture Collection) were infected with MR766 or Brazilian Paraiba strains of ZIKV at MOI 0.2 and 2, respectively, and the plates were incubated at 37°C in a 5% CO2 atmosphere for 2, 12, 24, 36, or 48 h. As controls, cells were incubated with culture supernatants from uninfected Vero cells (mock‐infected controls). At the indicated times post‐infection, cell supernatants were collected for determination of viral copy number.
ZIKV binding and entry assays
hNSCs were treated with rapamycin, bafilomycin (Baf), chloroquine (CQ), and 3‐menthyladenine (3‐MA) for 1 h and incubated with ZIKV of MOI = 10 at 4 degrees for 2 h. Cells were washed with chilled PBS for three times, and cells were lysed using TRIzol and viral RNAs were quantified by RT‐qPCR. Next for the internalization assay, cells were incubated in 37°C for 4 h followed by washing with PBS for three times. Un‐internalized ZIKV particles were removed by accumax. Pellets were lysed by TRIzol, and total RNA was extracted and quantified.
ZIKV infection of mice
Ifnar −/− mice (4–5‐week‐old, MMRRC Jackson Laboratories) or Fancc KO (2 week old pups) were infected with ZIKV Paraiba (5 × 10⁴ PFU/μl) or MR766 (3.2 × 10⁵ PFU/μl) by i.p. injection (500 μl) as previously described (Lazear et al, 2016; Zhao et al, 2016). Mice were sacrificed for immunostaining 6 days after ZIKV infection.
Western blotting
Cells were lysed in RIPA buffer containing protease inhibitor cocktail (Roche), and proteins were resolved by SDS–PAGE (Bio‐Rad) and transferred to PVDF membranes (Bio‐Rad). Membranes were blocked with Western Blocker solution (Sigma), non‐fat milk, or Fast Western Blot Kit blocking reagent (Thermo Scientific Pierce), and signals were detected with Supersignal West Pico or Femto Chemiluminescent Substrate (Pierce). Loading was normalized by densitometry to the GAPDH signal using ImageJ software. The following antibodies were used: GAPDH (Cell Signaling Technology, 5174S), LC3 (Novus, NB100‐2220), FANCC (Novus, NBP1‐18977), ZIKV envelope (Millipore, MAB10216), ZIKV NS1 (BioFront, BF‐1225‐06), FLAG (Sigma, M2, F1804), TOMM20 (Santa Cruz, SC‐11415), P62 (Abcam, ab91562), and Nestin (Millipore: MAB353).
Immunofluorescence microscopy
Neural stem cells and HeLa cells were harvested at various time points following infection and immunostained as described previously (Dang et al, 2016). Briefly, ZIKV‐ and mock‐infected cells were fixed with 4% paraformaldehyde in PBS for 20 min at room temperature (RT). Cells were blocked by incubation in 3% BSA and 0.1% Triton X‐100 for 2 h at RT and then incubated overnight at 4°C with ZIKVE/anti‐flavivirus group antigen‐specific antibody (1:500, mouse, Millipore MAB10216) or an antibody to the NSC marker Nestin (1:500, Millipore MAB353). Cells were washed with PBS and incubated for 2 h at RT with fluorescein isothiocyanate (FITC)‐conjugated anti‐mouse IgG. The nuclei were stained with Hoechst 33258, and cells were imaged using a Leica fluorescence microscope (DMI 3000B) or an Olympus Fluoview FV1000 confocal microscope with Fluoview version 4.2.
Immunohistochemistry
Mice were transcardially perfused with normal saline (0.9% NaCl) followed by ice‐cold 4% paraformaldehyde (PFA, pH 7.2) under deep anesthesia, as described previously (Tiwari et al, 2014). Brains were removed and post‐fixed in 10% PFA overnight at 4°C followed by cryopreservation in 10, 20, and 30% (w/v) sucrose in PBS. Serial coronal sections of 30 μm thickness beginning at bregma −1.50 to −3.50 mm through the dorsal hippocampus encompassing the dentate gyrus region and +0.26 to −2.5 mm through the SVZ were cut using a freezing cryostat (Leica Biosystems, CM3050s). Free‐floating sections were washed, antigen retrieval was performed with citrate buffer (pH 6.2), and the sections were blocked with 3% normal goat serum, 0.1% Triton X‐100, and 0.5% BSA for 2 h. Sections were then incubated with mouse anti‐ZIKVE (flavivirus group antigen) antibody (1:500), rabbit anti‐SOX2, mouse anti‐Cleaved‐caspase 3 (1:200) or goat anti‐FANCC (1:100) for 24 h at 4°C. Sections were then stained with secondary antibodies (anti‐mouse and anti‐rabbit Alexa Fluor 488 at 1:200; anti‐rabbit, anti‐mouse, and anti‐goat Alexa Fluor 594 at 1:200), washed, mounted with DAPI‐containing Hard Set anti‐fade mounting medium (Vectashield, Vector Laboratories, CA, USA), and stored in the dark at 4°C. Slides were analyzed using an inverted Leica fluorescence microscope (DMI 3000B) or a Leica SP5 confocal with Resonant Scanner microscope with Leica LAS Lite Software.
RNA extraction and RT–qPCR
Total cellular RNA was extracted with TRIzol reagent (Invitrogen), and 500 ng RNA was used to synthesize cDNA (iScript, Bio‐Rad). PCR primer pairs were purchased from Integrated DNA Technologies (Table EV3). PCR reactions were performed with SYBR Green Master Mix (Bio‐Rad) using a LightCycler 480 II RT–qPCR machine (Roche).
Data analysis
Gene ontology analyses of biological processes and cellular localization were performed using the Database for Annotation, Visualization, and Integrated Discovery (DAVID) (da Huang et al, 2009). Sankey diagrams were created using SankeyMATIC. GSEA was utilized to find the pathways in hallmark genesets (FDR q‐value < 0.01) for differentially expressed coding genes from cells treated with perifosine (P < 0.01), rapamycin (P < 0.01), and resveratrol (P < 0.01). The same analysis was performed for genes significantly downregulated in ZIKV‐infected human NSCs (Tang et al, 2016). Pathways from GSEA hallmark genesets for perifosine, rapamycin, and resveratrol were combined, and duplicates were removed. The list of unique pathways was then compared with the list of pathways from the ZIKV‐infected NSC dataset, and common pathways were visualized using Sankey diagrams. The width of each band in the Sankey diagram is proportional to the number of genes. The same analysis was repeated for the KEGG genesets, Reactome genesets, and GO biological processes from GSEA. String network analyses were performed and visualized using Cytoscape (Shannon et al, 2003; Bindea et al, 2009).
ChIP‐seq analyses
ChIP‐seq datasets for E2F4 in HeLa (wgEncodeEH000689), K562 (wgEncodeEH000671), and MCF10A (wgEncodeEH002835) cells, and H3K9ac (ab4441; wgEncodeEH001019) and H3K4me3 (wgEncodeEH000423) in HeLa cells were downloaded from the Encyclopedia of DNA Elements (ENCODE) Consortium database at UCSC and visualized using the Integrative Genomics Viewer (IGV) software (Robinson et al, 2011; Thorvaldsdottir et al, 2013).
Plasmids and siRNA transfection
Zika virus strain MR766 nonstructural proteins NS1, NS2B, NS3, NS4A, NS4B, and NS5 were cloned from synthesized cDNA fragments (IDT). ZIKV proteins were amplified by PCR and cloned into pFLAG‐CMV2 vectors with an N‐terminal Flag tag.
The GFP‐LC3 and tandem EGFP‐mCherry‐LC3B plasmids were obtained from Addgene and the siRNA for human FANCC and E2F4 were from Dharmacon. The pCMV‐FANCC‐FLAG plasmid was purchased from Sino Biological Inc. Plasmids and siRNA were transfected into NSCs or HeLa cells using Lipofectamine 2000 (Invitrogen), according to the manufacturer's recommendations.
Quantification of GFP‐LC3 punctae
GFP‐LC3 punctae were counted using established methods (Klionsky et al, 2008, 2012; Agarwal et al, 2015). Cells were visualized using a Leica fluorescence microscope (DMI 3000B) or an Olympus Fluoview FV1000 confocal microscope. The data are presented as the average number of GFP‐LC3 punctae in 50 randomly selected cells from each group.
Transmission electron microscopy
Transmission electron microscopy was performed human and mouse NSCs. Samples were immersed in modified Karnovsky's fixative (2.5% glutaraldehyde and 2% paraformaldehyde in 0.15 M sodium cacodylate buffer, pH 7.4) for at least 4 h, post‐fixed in 1% osmium tetroxide in 0.15 M cacodylate buffer for 1 h, and stained en bloc in 2% uranyl acetate for 1 h. Samples were dehydrated in ethanol, embedded in Durcupan epoxy resin (Sigma‐Aldrich), sectioned at 50–60 nm using a Leica UCT ultramicrotome, and picked up on Formvar and carbon‐coated copper grids. Sections were stained with 2% uranyl acetate for 5 min and with Sato's lead stain for 1 min. Grids were viewed with (i) a JEOL 1200EX II TEM (JEOL, Peabody, MA) and photographed using a Gatan digital camera (Gatan, Pleasanton, CA) or (ii) a Tecnai G2 Spirit BioTWIN TEM equipped with an Eagle 4k HS digital camera (FEI, Hilsboro, OR).
Flow cytometry
Human NSCs were removed from six‐well plates using Accumax at 48 h post‐transfection with plasmids and/or infection with ZIKV. Cells were resuspended in ice‐cold PBS and washed twice. Annexin V and PI staining were performed using a FITC‐Annexin V Apoptosis Detection Kit I (BD Pharmingen), according to the manufacturer's instructions. Samples were analyzed using a BD Accuri C6 personal flow cytometer and FlowJo software.
Chemicals
Rapamycin (Alfa Aesar Fischer Scientific, AAJ62473MF) and bafilomycin A1 (Sigma, B1793) were diluted in DMSO. Chloroquine (Life Technologies, L10382) was purchased in aqueous solution, and 3‐MA (Sigma, M9281) was resuspended in cell culture grade water.
Statistical analysis
Statistical analysis was carried out using GraphPad Prism software. Differences between group means were analyzed by Student's t test. Differentially expressed genes in RNA‐seq data were analyzed using ANOVA. A P value ≤ 0.5 was considered statistically significant.
Author contributions
SKT and JWD designed and performed the experiments, analyzed the data, and wrote the manuscript; NL performed experiments; YQ performed the bioinformatics analyses; SW performed experiments; TMR conceived and planned the project and participated in experimental design, data analysis, data interpretation, and manuscript writing.
Conflict of interest
T.M.R. is a founder of ViRx Pharmaceuticals and has an equity interest in the company. The terms of this arrangement have been reviewed and approved by the University of California San Diego in accordance with its conflict of interest policies.
Supporting information
Expanded View Figures PDF
Table EV1
Table EV2
Table EV3
Review Process File
Acknowledgements
We are grateful to late Dr. Grzegorz Nalepa for the Fancc KO animals. We thank the Tuszynski laboratory for their help with confocal imaging and the UCSD CMM Electron Microscopy core for their help with processing of ultrathin cryosections and imaging by transmission electron microscopy. We thank the Cherqui laboratory for their help with flow cytometry and Keyence microscopy. We thank members of the Rana laboratory for helpful discussions and advice. This work was supported in part by grants from the National Institutes of Health (DA039562, DA046171, DA049524, and AI125103).
EMBO Reports (2020) 21: e49183
References
- Agarwal S, Tiwari SK, Seth B, Yadav A, Singh A, Mudawal A, Chauhan LK, Gupta SK, Choubey V, Tripathi A et al (2015) Activation of autophagic flux against xenoestrogen bisphenol‐A‐induced hippocampal neurodegeneration via AMP kinase (AMPK)/mammalian target of rapamycin (mTOR) pathways. J Biol Chem 290: 21163–21184 [DOI] [PMC free article] [PubMed] [Google Scholar] [Retracted]
- Auerbach AD (2009) Fanconi anemia and its diagnosis. Mutat Res 668: 4–10 [DOI] [PMC free article] [PubMed] [Google Scholar]
- Bindea G, Mlecnik B, Hackl H, Charoentong P, Tosolini M, Kirilovsky A, Fridman WH, Pages F, Trajanoski Z, Galon J (2009) ClueGO: a Cytoscape plug‐in to decipher functionally grouped gene ontology and pathway annotation networks. Bioinformatics 25: 1091–1093 [DOI] [PMC free article] [PubMed] [Google Scholar]
- Blazquez AB, Escribano‐Romero E, Merino‐Ramos T, Saiz JC, Martin‐Acebes MA (2014) Stress responses in flavivirus‐infected cells: activation of unfolded protein response and autophagy. Front Microbiol 5: 266 [DOI] [PMC free article] [PubMed] [Google Scholar]
- Bogliolo M, Surralles J (2015) Fanconi anemia: a model disease for studies on human genetics and advanced therapeutics. Curr Opin Genet Dev 33: 32–40 [DOI] [PubMed] [Google Scholar]
- Brasil P, Calvet GA, de Souza RV, Siqueira AM (2016a) Exanthema associated with Zika virus infection. Lancet Infect Dis 16: 866 [DOI] [PubMed] [Google Scholar]
- Brasil P, Sequeira PC, Freitas AD, Zogbi HE, Calvet GA, de Souza RV, Siqueira AM, de Mendonca MC, Nogueira RM, de Filippis AM et al (2016b) Guillain‐Barre syndrome associated with Zika virus infection. Lancet 387: 1482 [DOI] [PubMed] [Google Scholar]
- Cao B, Parnell LA, Diamond MS, Mysorekar IU (2017) Inhibition of autophagy limits vertical transmission of Zika virus in pregnant mice. J Exp Med 214: 2303–2313 [DOI] [PMC free article] [PubMed] [Google Scholar]
- Cugola FR, Fernandes IR, Russo FB, Freitas BC, Dias JLM, Guimarães KP, Benazzato C, Almeida N, Pignatari GC, Romero S et al (2016) The Brazilian Zika virus strain causes birth defects in experimental models. Nature 534: 267–271 [DOI] [PMC free article] [PubMed] [Google Scholar]
- Cutler R, Kelly J, Storie K, Pedersen W, Tammara A, Hatanpaa K, Troncoso J, Mattson MP (2003) Involvement of oxidative stress‐induced abnormalities in ceramide and cholesterol metabolism in brain aging and Alzheimer's disease. Proc Natl Acad Sci USA 101: 2070–2075 [DOI] [PMC free article] [PubMed] [Google Scholar]
- Dang J, Tiwari S, Lichinchi G, Qin Y, Patil V, Eroshkin A, Rana T (2016) Zika virus depletes neural progenitors in human cerebral organoids through activation of the innate immune receptor TLR3. Cell Stem Cell 19: 258–265 [DOI] [PMC free article] [PubMed] [Google Scholar]
- Dang JW, Tiwari SK, Qin Y, Rana TM (2019) Genome‐wide integrative analysis of Zika‐virus‐infected neuronal stem cells reveals roles for micrornas in cell cycle and stemness. Cell Rep 27: 3618–3628 [DOI] [PMC free article] [PubMed] [Google Scholar]
- Doerks T, Copley RR, Schultz J, Ponting CP, Bork P (2002) Systematic identification of novel protein domain families associated with nuclear functions. Genome Res 12: 47–56 [DOI] [PMC free article] [PubMed] [Google Scholar]
- Dreux M, Gastaminza P, Wieland S, Chisari F (2009) The autophagy machinery is required to initiate hepatitis C virus replication. Proc Natl Acad Sci USA 106: 14046–14051 [DOI] [PMC free article] [PubMed] [Google Scholar]
- Duffy MR, Chen TH, Hancock WT, Powers AM, Kool JL, Lanciotti RS, Pretrick M, Marfel M, Holzbauer S, Dubray C et al (2009) Zika virus outbreak on Yap Island, Federated States of Micronesia. N Engl J Med 360: 2536–2543 [DOI] [PubMed] [Google Scholar]
- Faivre L, Guardiola P, Lewis C, Dokal I, Ebell W, Zatterale A, Altay C, Poole J, Stones D, Kwee ML et al (2000) Association of complementation group and mutation type with clinical outcome in fanconi anemia. European Fanconi Anemia Research Group. Blood 96: 4064–4070 [PubMed] [Google Scholar]
- Filippi‐Chiela EC, Villodre ES, Zamin LL, Lenz G (2011) Autophagy interplay with apoptosis and cell cycle regulation in the growth inhibiting effect of resveratrol in glioma cells. PLoS ONE 6: e20849 [DOI] [PMC free article] [PubMed] [Google Scholar]
- Frappart PO, Lee Y, Lamont J, McKinnon PJ (2007) BRCA2 is required for neurogenesis and suppression of medulloblastoma. EMBO J 26: 2732–2742 [DOI] [PMC free article] [PubMed] [Google Scholar]
- Garbati MR, Hays LE, Keeble W, Yates JE, Rathbun RK, Bagby GC (2013) FANCA and FANCC modulate TLR and p38 MAPK‐dependent expression of IL‐1beta in macrophages. Blood 122: 3197–3205 [DOI] [PMC free article] [PubMed] [Google Scholar]
- Gillespie LK, Hoenen A, Morgan G, Mackenzie JM (2010) The endoplasmic reticulum provides the membrane platform for biogenesis of the flavivirus replication complex. J Virol 84: 10438–10447 [DOI] [PMC free article] [PubMed] [Google Scholar]
- Hamel R, Dejarnac O, Wichit S, Ekchariyawat P, Neyret A, Luplertlop N, Perera‐Lecoin M, Surasombatpattana P, Talignani L, Thomas F et al (2015) Biology of Zika virus infection in human skin cells. J Virol 89: 8880–8896 [DOI] [PMC free article] [PubMed] [Google Scholar]
- Haneline LS, Broxmeyer HE, Cooper S, Hangoc G, Carreau M, Buchwald M, Clapp DW (1998) Multiple inhibitory cytokines induce deregulated progenitor growth and apoptosis in hematopoietic cells from Fac‐/‐ mice. Blood 91: 4092–4098 [PubMed] [Google Scholar]
- Hanners NW, Eitson JL, Usui N, Richardson RB, Wexler EM, Konopka G, Schoggins JW (2016) Western Zika virus in human fetal neural progenitors persists long term with partial cytopathic and limited immunogenic effects. Cell Rep 15: 2315–2322 [DOI] [PMC free article] [PubMed] [Google Scholar]
- Haughey NJ (2010) Sphingolipids in neurodegeneration. Neuromolecular Med 12: 301–305 [DOI] [PMC free article] [PubMed] [Google Scholar]
- Hayes EB (2009) Zika virus outside Africa. Emerg Infect Dis 15: 1347–1350 [DOI] [PMC free article] [PubMed] [Google Scholar]
- Heaton NS, Randall G (2010) Dengue virus‐induced autophagy regulates lipid metabolism. Cell Host Microbe 8: 422–432 [DOI] [PMC free article] [PubMed] [Google Scholar]
- Heaton NS, Perera R, Berger KL, Khadka S, Lacount DJ, Kuhn RJ, Randall G (2010) Dengue virus nonstructural protein 3 redistributes fatty acid synthase to sites of viral replication and increases cellular fatty acid synthesis. Proc Natl Acad Sci USA 107: 17345–17350 [DOI] [PMC free article] [PubMed] [Google Scholar]
- Hoskins EE, Gunawardena RW, Habash KB, Wise‐Draper TM, Jansen M, Knudsen ES, Wells SI (2008) Coordinate regulation of Fanconi anemia gene expression occurs through the Rb/E2F pathway. Oncogene 27: 4798–4808 [DOI] [PMC free article] [PubMed] [Google Scholar]
- da Huang W, Sherman BT, Lempicki RA (2009) Systematic and integrative analysis of large gene lists using DAVID bioinformatics resources. Nat Protoc 4: 44–57 [DOI] [PubMed] [Google Scholar]
- Janky R, Verfaillie A, Imrichova H, Van de Sande B, Standaert L, Christiaens V, Hulselmans G, Herten K, Naval Sanchez M, Potier D et al (2014) iRegulon: from a gene list to a gene regulatory network using large motif and track collections. PLoS Comput Biol 10: e1003731 [DOI] [PMC free article] [PubMed] [Google Scholar]
- Jin R, Zhu W, Cao S, Chen R, Jin H, Liu Y, Wang S, Wang W, Xiao G (2013) Japanese encephalitis virus activates autophagy as a viral immune evasion strategy. PLoS ONE 8: e52909 [DOI] [PMC free article] [PubMed] [Google Scholar]
- Kalb R, Neveling K, Hoehn H, Schneider H, Linka Y, Batish SD, Hunt C, Berwick M, Callen E, Surralles J et al (2007) Hypomorphic mutations in the gene encoding a key Fanconi anemia protein, FANCD2, sustain a significant group of FA‐D2 patients with severe phenotype. Am J Hum Genet 80: 895–910 [DOI] [PMC free article] [PubMed] [Google Scholar]
- Kawatsuki A, Yasunaga JI, Mitobe Y, Green PL, Matsuoka M (2016) HTLV‐1 bZIP factor protein targets the Rb/E2F‐1 pathway to promote proliferation and apoptosis of primary CD4+ T cells. Oncogene 35: 4509–4517 [DOI] [PMC free article] [PubMed] [Google Scholar]
- Kimura S, Noda T, Yoshimori T (2007) Dissection of the autophagosome maturation process by a novel reporter protein, tandem fluorescent‐tagged LC3. Autophagy 3: 452–460 [DOI] [PubMed] [Google Scholar]
- Klionsky DJ, Abeliovich H, Agostinis P, Agrawal DK, Aliev G, Askew DS, Baba M, Baehrecke EH, Bahr BA, Ballabio A et al (2008) Guidelines for the use and interpretation of assays for monitoring autophagy in higher eukaryotes. Autophagy 4: 151–175 [DOI] [PMC free article] [PubMed] [Google Scholar]
- Klionsky DJ, Abdalla FC, Abeliovich H, Abraham RT, Acevedo‐Arozena A, Adeli K, Agholme L, Agnello M, Agostinis P, Aguirre‐Ghiso JA et al (2012) Guidelines for the use and interpretation of assays for monitoring autophagy. Autophagy 8: 445–544 [DOI] [PMC free article] [PubMed] [Google Scholar]
- Kudchodkar SB, Levine B (2009) Viruses and autophagy. Rev Med Virol 19: 359–378 [DOI] [PMC free article] [PubMed] [Google Scholar]
- Lazear HM, Diamond MS (2016) Zika Virus: new clinical syndromes and its emergence in the western hemisphere. J Virol 90: 4864–4875 [DOI] [PMC free article] [PubMed] [Google Scholar]
- Lazear HM, Govero J, Smith AM, Platt DJ, Fernandez E, Miner JJ, Diamond MS (2016) A mouse model of zika virus pathogenesis. Cell Host Microbe 19: 720–730 [DOI] [PMC free article] [PubMed] [Google Scholar]
- Lee YR, Lei HY, Liu MT, Wang JR, Chen SH, Jiang‐Shieh YF, Lin YS, Yeh TM, Liu CC, Liu HS (2008) Autophagic machinery activated by dengue virus enhances virus replication. Virology 374: 240–248 [DOI] [PMC free article] [PubMed] [Google Scholar]
- Levine B, Mizushima N, Virgin HW (2011) Autophagy in immunity and inflammation. Nature 469: 323–335 [DOI] [PMC free article] [PubMed] [Google Scholar]
- Lee IH, Kawai Y, Fergusson MM, Rovira II, Bishop AJ, Motoyama N, Cao L, Finkel T (2012) Atg7 modulates p53 activity to regulate cell cycle and survival during metabolic stress. Science 336: 225–228 [DOI] [PMC free article] [PubMed] [Google Scholar]
- Li JK, Liang JJ, Liao CL, Lin YL (2012) Autophagy is involved in the early step of Japanese encephalitis virus infection. Microbes Infect 14: 159–168 [DOI] [PubMed] [Google Scholar]
- Li C, Xu D, Ye Q, Hong S, Jiang Y, Liu X, Zhang N, Shi L, Qin CF, Xu Z (2016) Zika virus disrupts neural progenitor development and leads to microcephaly in mice. Cell Stem Cell 19: 120–126 [DOI] [PubMed] [Google Scholar]
- Liang Q, Luo Z, Zeng J, Chen W, Foo SS, Lee SA, Ge J, Wang S, Goldman SA, Zlokovic BV et al (2016) Zika virus NS4A and NS4B proteins deregulate Akt‐mTOR signaling in human fetal neural stem cells to inhibit neurogenesis and induce autophagy. Cell Stem Cell 19: 663–671 [DOI] [PMC free article] [PubMed] [Google Scholar]
- Lichinchi G, Zhao BS, Wu Y, Lu Z, Qin Y, He C, Rana TM (2016) Dynamics of human and viral RNA methylation during Zika virus infection. Cell Host Microbe 20: 666–673 [DOI] [PMC free article] [PubMed] [Google Scholar]
- Liu Q, Trotter J, Zhang J, Peters MM, Cheng H, Bao J, Han X, Weeber EJ, Bu G (2010) Neuronal LRP1 knockout in adult mice leads to impaired brain lipid metabolism and progressive, age‐dependent synapse loss and neurodegeneration. J Neurosci 30: 17068–17078 [DOI] [PMC free article] [PubMed] [Google Scholar]
- Lum JJ, Bauer DE, Kong M, Harris MH, Li C, Lindsten T, Thompson CB (2005) Growth factor regulation of autophagy and cell survival in the absence of apoptosis. Cell 120: 237–248 [DOI] [PubMed] [Google Scholar]
- Mateo R, Nagamine CM, Spagnolo J, Mendez E, Rahe M, Gale M Jr, Yuan J, Kirkegaard K (2013) Inhibition of cellular autophagy deranges dengue virion maturation. J Virol 87: 1312–1321 23175363 [Google Scholar]
- McLean JE, Wudzinska A, Datan E, Quaglino D, Zakeri Z (2011) Flavivirus NS4A‐induced autophagy protects cells against death and enhances virus replication. J Biol Chem 286: 22147–22159 [DOI] [PMC free article] [PubMed] [Google Scholar]
- Miner JJ, Cao B, Govero J, Smith AM, Fernandez E, Cabrera OH, Garber C, Noll M, Klein RS, Noguchi KK et al (2016) Zika virus infection during pregnancy in mice causes placental damage and fetal demise. Cell 165: 1081–1091 [DOI] [PMC free article] [PubMed] [Google Scholar]
- Mizui T, Yamashina S, Tanida I, Takei Y, Ueno T, Sakamoto N, Ikejima K, Kitamura T, Enomoto N, Sakai T et al (2010) Inhibition of hepatitis C virus replication by chloroquine targeting virus‐associated autophagy. J Gastroenterol 45: 195–203 [DOI] [PMC free article] [PubMed] [Google Scholar]
- Mootha VK, Lindgren CM, Eriksson KF, Subramanian A, Sihag S, Lehar J, Puigserver P, Carlsson E, Ridderstrale M, Laurila E et al (2003) PGC‐1alpha‐responsive genes involved in oxidative phosphorylation are coordinately downregulated in human diabetes. Nat Genet 34: 267–273 [DOI] [PubMed] [Google Scholar]
- Neveling K, Endt D, Hoehn H, Schindler D (2009) Genotype‐phenotype correlations in Fanconi anemia. Mutat Res 668: 73–91 [DOI] [PubMed] [Google Scholar]
- Niedzwiedz W, Mosedale G, Johnson M, Ong CY, Pace P, Patel KJ (2004) The Fanconi anaemia gene FANCC promotes homologous recombination and error‐prone DNA repair. Mol Cell 15: 607–620 [DOI] [PubMed] [Google Scholar]
- Noronha L, Zanluca C, Azevedo ML, Luz KG, Santos CN (2016) Zika virus damages the human placental barrier and presents marked fetal neurotropism. Mem Inst Oswaldo Cruz 111: 287–293 [DOI] [PMC free article] [PubMed] [Google Scholar]
- Orvedahl A, Sumpter R Jr, Xiao G, Ng A, Zou Z, Tang Y, Narimatsu M, Gilpin C, Sun Q, Roth M et al (2011) Image‐based genome‐wide siRNA screen identifies selective autophagy factors. Nature 480: 113–117 [DOI] [PMC free article] [PubMed] [Google Scholar]
- Pagano G, Talamanca AA, Castello G, d'Ischia M, Pallardo FV, Petrovic S, Porto B, Tiano L, Zatterale A (2013) From clinical description, to in vitro and animal studies, and backward to patients: oxidative stress and mitochondrial dysfunction in Fanconi anemia. Free Radic Biol Med 58: 118–125 [DOI] [PubMed] [Google Scholar]
- Qian X, Nguyen HN, Song MM, Hadiono C, Ogden SC, Hammack C, Yao B, Hamersky GR, Jacob F, Zhong C et al (2016) Brain‐region‐specific organoids using mini‐bioreactors for modeling ZIKV exposure. Cell 165: 1238–1254 [DOI] [PMC free article] [PubMed] [Google Scholar]
- Robinson JT, Thorvaldsdottir H, Winckler W, Guttman M, Lander ES, Getz G, Mesirov JP (2011) Integrative genomics viewer. Nat Biotechnol 29: 24–26 [DOI] [PMC free article] [PubMed] [Google Scholar]
- Sarno M, Sacramento GA, Khouri R, do Rosario MS, Costa F, Archanjo G, Santos LA, Nery N Jr, Vasilakis N, Ko AI et al (2016) Zika virus infection and stillbirths: a case of hydrops fetalis, hydranencephaly and fetal demise. PLoS Negl Trop Dis 10: e0004517 [DOI] [PMC free article] [PubMed] [Google Scholar]
- Shannon P, Markiel A, Ozier O, Baliga NS, Wang JT, Ramage D, Amin N, Schwikowski B, Ideker T (2003) Cytoscape: a software environment for integrated models of biomolecular interaction networks. Genome Res 13: 2498–2504 [DOI] [PMC free article] [PubMed] [Google Scholar]
- Sii‐Felice K, Barroca V, Etienne O, Riou L, Hoffschir F, Fouchet P, Boussin FD, Mouthon MA (2008a) Role of Fanconi DNA repair pathway in neural stem cell homeostasis. Cell Cycle 7: 1911–1915 [DOI] [PubMed] [Google Scholar]
- Sii‐Felice K, Etienne O, Hoffschir F, Mathieu C, Riou L, Barroca V, Haton C, Arwert F, Fouchet P, Boussin FD et al (2008b) Fanconi DNA repair pathway is required for survival and long‐term maintenance of neural progenitors. EMBO J 27: 770–781 [DOI] [PMC free article] [PubMed] [Google Scholar]
- Subramanian A, Tamayo P, Mootha VK, Mukherjee S, Ebert BL, Gillette MA, Paulovich A, Pomeroy SL, Golub TR, Lander ES et al (2005) Gene set enrichment analysis: a knowledge‐based approach for interpreting genome‐wide expression profiles. Proc Natl Acad Sci USA 102: 15545–15550 [DOI] [PMC free article] [PubMed] [Google Scholar]
- Sumpter R Jr, Sirasanagandla S, Fernandez AF, Wei Y, Dong X, Franco L, Zou Z, Marchal C, Lee MY, Clapp DW et al (2016) Fanconi anemia proteins function in mitophagy and immunity. Cell 165: 867–881 [DOI] [PMC free article] [PubMed] [Google Scholar]
- Tang H, Hammack C, Ogden SC, Wen Z, Qian X, Li Y, Yao B, Shin J, Zhang F, Lee EM et al (2016) Zika virus infects human cortical neural progenitors and attenuates their growth. Cell Stem Cell 18: 587–590 [DOI] [PMC free article] [PubMed] [Google Scholar]
- Thorvaldsdottir H, Robinson JT, Mesirov JP (2013) Integrative Genomics Viewer (IGV): high‐performance genomics data visualization and exploration. Brief Bioinform 14: 178–192 [DOI] [PMC free article] [PubMed] [Google Scholar]
- Tischkowitz MD, Hodgson SV (2003) Fanconi anaemia. J Med Genet 40: 1–10 [DOI] [PMC free article] [PubMed] [Google Scholar]
- Tiwari SK, Agarwal S, Seth B, Yadav A, Nair S, Bhatnagar P, Karmakar M, Kumari M, Chauhan LK, Patel DK et al (2014) Curcumin‐loaded nanoparticles potently induce adult neurogenesis and reverse cognitive deficits in Alzheimer's disease model via canonical Wnt/?-catenin pathway. ACS Nano 8: 76–103 [DOI] [PubMed] [Google Scholar]
- Tiwari SK, Dang J, Qin Y, Lichinchi G, Bansal V, Rana TM (2017) Zika virus infection reprograms global transcription of host cells to allow sustained infection. Emerg Microbes Infect 6: e24 [DOI] [PMC free article] [PubMed] [Google Scholar]
- Ventura CV, Maia M, Ventura BV, Linden VV, Araujo EB, Ramos RC, Rocha MA, Carvalho MD, Belfort R Jr, Ventura LO (2016) Ophthalmological findings in infants with microcephaly and presumable intra‐uterus Zika virus infection. Arq Bras Oftalmol 79: 1–3 [DOI] [PubMed] [Google Scholar]
- Xu C, Wang M, Song Z, Wang Z, Liu Q, Jiang P, Bai J, Li Y, Wang X (2018) Pseudorabies virus induces autophagy to enhance viral replication in mouse neuro‐2a cells in vitro . Virus Res 248: 44–52 [DOI] [PubMed] [Google Scholar]
- Zhang H, Puleston DJ, Simon AK (2016) Autophagy and immune senescence. Trends Mol Med 22: 671–686 [DOI] [PubMed] [Google Scholar]
- Zhao H, Fernandez E, Dowd KA, Speer SD, Platt DJ, Gorman MJ, Govero J, Nelson CA, Pierson TC, Diamond MS et al (2016) Structural basis of Zika virus‐specific antibody protection. Cell 166: 1016–1027 [DOI] [PMC free article] [PubMed] [Google Scholar]
- Zheng Y, Stamminger T, Hearing P (2016) E2F/Rb family proteins mediate interferon induced repression of adenovirus immediate early transcription to promote persistent viral infection. PLoS Pathog 12: e1005415 [DOI] [PMC free article] [PubMed] [Google Scholar]
- Zhou C, Zhong W, Zhou J, Sheng F, Fang Z, Wei Y, Chen Y, Deng X, Xia B, Lin J (2012) Monitoring autophagic flux by an improved tandem fluorescent‐tagged LC3 (mTagRFP‐mWasabi‐LC3) reveals that high‐dose rapamycin impairs autophagic flux in cancer cells. Autophagy 8: 1215–1226 [DOI] [PubMed] [Google Scholar]
Associated Data
This section collects any data citations, data availability statements, or supplementary materials included in this article.
Supplementary Materials
Expanded View Figures PDF
Table EV1
Table EV2
Table EV3
Review Process File