

Abstract
Background
We previously reported that osteopontin plays an essential role in accelerating both reparative fibrosis and clearance of dead cells (efferocytosis) during tissue repair after myocardial infarction (MI) and galectin‐3hiCD206+ macrophages is the main source of osteopontin in post‐MI heart. Interleukin‐10– STAT3 (signal transducer and activator of transcription 3)–galectin‐3 axis is essential for Spp1 (encoding osteopontin) transcriptional activation in cardiac macrophages after MI. Here, we investigated the more detailed mechanism responsible for functional maturation of osteopontin‐producing macrophages.
Methods and Results
In post‐MI hearts, Spp1 transcriptional activation occurred almost exclusively in MerTK (Mer tyrosine kinase)+ galectin‐3hi macrophages. The induction of MerTK on galectin‐3hi macrophages is essential for their functional maturation including efferocytosis and Spp1 transcriptional activity. MerTK+galectin‐3hi macrophages showed a strong activation of both STAT3 and ERK (extracellular signal‐regulated kinase). STAT3 inhibition suppressed the differentiation of osteopontin‐producing MerTK+galectin‐3hi macrophages, however, STAT3 activation was insufficient at inducing Spp1 transcriptional activity. ERK inhibition suppressed Spp1 transcriptional activation without affecting MerTK or galectin‐3 expression. Concomitant activation of ERK is required for transcriptional activation of Spp1. In Il‐10 knockout enhanced green fluorescent protein–Spp1 knock‐in mice subjected to MI, osteopontin‐producing macrophages decreased but did not disappear entirely. Interleukin‐10 and macrophage colony‐stimulating factor synergistically activated STAT3 and ERK and promoted the differentiation of osteopontin‐producing MerTK+galectin‐3hi macrophages in bone marrow–derived macrophages. Coadministration of anti‐interleukin‐10 plus anti–macrophage colony‐stimulating factor antibodies substantially reduced the number of osteopontin‐producing macrophages by more than anti–interleukin‐10 antibody alone in post‐MI hearts.
Conclusions
Interleukin‐10 and macrophage colony‐stimulating factor act synergistically to activate STAT3 and ERK in cardiac macrophages, which in turn upregulate the expression of galectin‐3 and MerTK, leading to the functional maturation of osteopontin‐producing macrophages.
Keywords: galectin‐3, macrophage , macrophage colony‐stimulating factor, MerTK, myocardial infarction, osteopontin
Subject Categories: Basic Science Research, Inflammation, Ischemia
Nonstandard Abbreviations and Acronyms
- BM
bone marrow
- EGFP
enhanced green fluorescent protein
- ERK
extracellular signal‐regulated kinase
- Gas6
growth arrest–specific gene 6
- M‐CSF
macrophage colony‐stimulating factor
- MerTK
Mer tyrosine kinase
- MI
myocardial infarction
- rIL
recombinant interleukin
- rM‐CSF
recombinant macrophage colony‐stimulating factor
- STAT3
signal transducer and activator of transcription 3
- TUNEL
terminal deoxynucleotidyl transferase 2′‐deoxyuridine‐5′‐triphosphate nick‐end labeling
- WT
wild‐type
Clinical Perspective
What Is New?
The induction of MerTK (Mer tyrosine kinase) on galectin‐3hi macrophages is essential for their functional maturation including efferocytosis and Spp1 transcriptional activity.
Differentiation and maturation of osteopontin‐producing MerTK+ galectin‐3hi macrophages requires the activation of both signal transducer and activator of transcription 3 and extracellular signal‐regulated kinase.
Interleukin‐10 and macrophage colony‐stimulating factor synergistically activates signal transducer and activator of transcription 3 and ERK (extracellular signal‐regulated kinase), thereby facilitating differentiation of bone marrow‐derived monocytes into osteopontin‐producing macrophages in the infarcted myocardium.
What Are the Clinical Implications?
Stimulating the differentiation and maturation of osteopontin‐producing MerTK+ galectin‐3hi macrophages may suppress post–myocardial infarction cardiac remodeling and prevent the onset of heart failure by promoting optimal wound healing.
Our finding will set a path for the development of treatment strategies to prevent the onset of heart failure after myocardial infarction by promoting the wound‐healing mechanism.
Rapid and efficient removal of dead cells during wound healing is essential for maintaining tissue homeostasis and mitigating inflammation. 1 , 2 M2‐like macrophages support tissue homeostasis, wound healing, and inflammation resolution. 2 , 3 , 4 , 5 We previously demonstrated that osteopontin directly mediates efferocytosis, the efficient clearance of apoptotic cells, and reparative fibrotic responses after myocardial infarction (MI) 6 ; and that galectin–3hi CD206+ macrophages in the infarcted myocardium almost exclusively produce osteopontin. Therefore, galectin‐3 most likely contributes to cardiac repair after MI, at least in part by the development of osteopontin‐producing macrophages. STAT3 (signal transducer and activator of transcription 3) activation is a prerequisite for steering macrophages toward the galectin‐3hi reparative phenotype and for the transcriptional activation of Spp1, which encodes osteopontin. We previously reported that interleukin‐10 induces osteopontin expression, but interleukin‐4 does not. However, the in vitro interleukin‐4 stimulation of bone marrow (BM) monocytes induces galectin‐3 expression and the differentiation of CD206+ alternative macrophages. 7 Overall, recent literature suggests that the upregulation of galectin‐3 is necessary but insufficient for the functional maturation of osteopontin‐producing macrophages.
The Tyro3, Axl, and MerTK receptors are a family of receptor tyrosine kinases that promote apoptotic cell clearance in macrophages. 8 , 9 , 10 , 11 , 12 , 13 The Tyro3, Axl, and MerTK (Mer tyrosine kinase) receptors bind to the “eat‐me” signal produced by phosphatidylserine on apoptotic cell membranes using Gas6 (growth arrest–specific gene 6) and protein S as bridging ligands. 14 During monocyte‐to‐macrophage differentiation, MerTK expression is upregulated, and then signaling from MerTK promotes the polarization of reparative M2‐like macrophages. 15 Thus, MerTK‐mediated macrophage efferocytosis facilitates optimal wound healing after MI. 4
In this study, we demonstrated that the induction of MerTK on galectin‐3hi CD206+ macrophages is essential for the functional maturation to OPN‐producing macrophages in the heart after MI. Furthermore, we found that the activation of both STAT3 and ERK (extracellular signal‐regulated kinase) drives the transcriptional activation of the OPN encoding gene Spp1 in galectinhi M2‐like macrophages. Interleukin‐10 and macrophage colony‐stimulating factor (M‐CSF) synergistically activate both STAT3 and ERK in cardiac macrophages after MI. Therefore, M‐CSF administration is a promising treatment strategy to prevent heart failure by accelerating myocardial repair.
Methods
The data, analytic methods, and study materials are available from the corresponding author upon reasonable request.
Animal Care
C57BL/6 (B6) mice were purchased from Clea Japan (Tokyo, Japan). Spp1‐knockout and EGFP (enhanced green fluorescent protein)–Spp1‐knockin reporter mice were kindly provided by Nagahiro Minato (Kyoto University, Japan). Il‐10‐knockout mice were kindly provided by Akihiro Yoshimura (Keio University, Japan). Lgals3‐knockout mice were kindly provided by Nobuyuki Takakura (Osaka University, Japan). All mice were bred using husbandry guidelines for C57BL/6 mice. 8‐ to 10‐week‐old male mice were used. This study conforms to the Guide for the Care and Use of Laboratory Animals published by the US National Institutes of Health (Publication no. 85‐23, revised 1996), and the study protocol was approved by the Institutional Animal Care and Use Committee at the Keio University School of Medicine.
MI Induction
Mice underwent the permanent ligation of the left anterior descending coronary artery, while the control group underwent a sham operation without ligation, as previously described. 6 Briefly, mice were lightly anesthetized with isoflurane gas, intubated, and then fully anesthetized with 1.0% to 1.5% isoflurane gas using a mechanically ventilated rodent respirator. A left thoracotomy opened the chest cavity, exposing the heart. Next, the left anterior descending coronary artery was permanently ligated with a 7‐0 silk suture at the site of its emergence from the left atrium. Sample size was estimated on the basis of previous studies that followed a similar experimental design and evaluated comparable functional and molecular parameters.
Cell Preparation for Flow Cytometry
We harvested murine cardiac cells using an adapted version of previously described methods. 6 Mice were deeply anesthetized and intracardially perfused with 40 mL of ice‐cold sterile PBS to exclude blood cells. The heart was dissected, minced with fine scissors, and then enzymatically digested with a type II collagenase cocktail (Worthington Biochemical Corp., Lakewood, NJ) for 1 hour at 37°C with gentle agitation. After digestion, the tissue was triturated and passed through a 70‐μm cell strainer. In addition, we harvested BM cells from the femurs and tibias of 8‐ to 10‐week‐old male mice. BM was flushed out with a 24‐gauge syringe, and a single‐cell suspension was passed through a 70‐μm cell strainer. Red blood cells were lysed with erythrocyte lysis buffer (BioLegend, San Diego, CA) for 10 minutes and resuspended in RPMI‐1640 medium supplemented with 10% fetal bovine serum. Single‐cell suspensions were blocked with CD16/32 monoclonal antibody (2.4G2; BD Biosciences, Franklin Lakes, NJ) at 4°C for 10 minutes. Cells were stained with a mixture of labeled antibodies at 4°C for 20 minutes.
Flow Cytometric Analysis
We performed flow cytometric analysis using a FACSAria III instrument (BD Biosciences) and analyzed the data using FlowJo software (Tree Star Inc, Ashland, OR). We used antibodies that had specificity to the following proteins: F4/80 (BM8; BioLegend), Ly6G (1A‐8‐Ly6g; BioLegend), CD11b (M1/70; BioLegend), galectin‐3 (M3/38; BioLegend), MERTK (Mer; 2B10C42; BioLegend), CD206 (15‐2; BioLegend), ERK1/2 Phospho (Thr202/Tyr204) (6B8B69; BioLegend) and STAT3 Phospho (Tyr705) (13A3‐1; BioLegend). We analyzed galectin‐3 (M3/38; BioLegend) using a True‐Nuclear Transcription Factor Buffer Set (BioLegend), ERK1/2 Phospho (Thr202/Tyr204) (6B8B69; BioLegend) and STAT3 Phospho (Tyr705) (13A3‐1; BioLegend) using ice‐cold 90% methanol after fixation.
Cell Culture of CD11b+Ly6G− Cells
CD11b+Ly6G− cells were isolated from the BM of EGFP‐Spp1‐knock‐in reporter mice, Lgals3‐knockout mice, Spp1‐knockout mice, and wild‐type (WT) mice. 2×10⁵ cells were seeded per well in 12‐well flat bottom tissue‐culture treated plates (Thermo Fisher Scientific, Waltham, MA). Cells were cultivated at 37°C with 5% CO2 in DMEM supplemented with 10% heat‐inactivated fetal calf serum, 100 μg/mL streptomycin, and 100 U/mL penicillin. For 72 hours, cells were treated with 10 ng/mL recombinant interleukin (rIL)‐10, 10 ng/mL interleukin‐4, 10 ng/mL interleukin‐1, and 10 ng/mL M‐CSF. Control cells were not treated. Sample size was estimated on the basis of previous studies that followed a similar experimental design and evaluated comparable functional and molecular parameters.
In Vitro STAT3 Inhibition Assay
2×10⁵ CD11b+Ly6G− cells isolated from the BM of either EGFP‐Spp1‐knock‐in reporter or WT mice were treated for 2 hours with 10 μmol/L Stattic (Selleck Chemicals, Houston, TX), which is a small nonpeptide molecule that potently inhibits STAT3 activation and nuclear translocation. The cells were then cultured in the presence of either 10 ng/mL rIL‐10 or 10 ng/mL rIL‐10+10 ng/mL M‐CSF for 72 hours.
In Vitro STAT3 Activation
For 48 hours, 2×10⁵ CD11b+Ly6G− cells isolated from the BM of either EGFP‐Spp1‐knock‐in reporter or WT mice were cultured in 100 pmol/L Colivelin (R&D Systems, Minneapolis, MN).
In Vitro ERK1/2 Inhibition
For 48 hours, 2×10⁵ CD11b+Ly6G− cells isolated from the BM of EGFP‐Spp1‐knock‐in reporter mice were cultured in 5 μmol/L SCH772984, a specific inhibitor of ERK1/2. Then the cells were treated with 10 ng/mL rIL‐10 or 10 ng/mL M‐CSF.
Genetic Knockdown and Expression of CD11b+Ly6G− Cells
For knockdown experiments, cells were transfected with Lgals3, Mertk, or short interfering RNA (Sigma‐Aldrich, St Louis, MO) using Lipofectamine 3000 (Invitrogen, Waltham, MA) following the manufacturer's protocol.
Phagocytosis Assay
CD11b+Ly6G− cells isolated from the BM of EGFP‐Spp1‐knock‐in reporter mice were cultivated in the presence of either 10 ng/mL rIL‐10, 10 ng/mL rIL‐10+10 ng/mL M‐CSF, or left untreated for 72 hours. These cells were then incubated with latex beads for 4 hours following the manufacturer's protocol (Cayman Chemical Company, Ann Arbor, MI). The uptake of latex beads by the cells was analyzed by microscopy.
In Vivo STAT3 Inhibition
C57BL/6 (B6) mice and EGFP‐Spp1‐knock‐in reporter mice were randomly distributed into 2 treatment groups, control vehicle group and Stattic‐treated group. Five percent DMSO in PBS was administered daily to the control vehicle group via intraperitoneal injection starting 1 day before MI induction and continued for 3 days after MI induction. 20 mg/kg Stattic in PBS was administered daily to the Stattic‐treated group via intraperitoneal injection starting 1 day before MI‐induction and continued for 3 days after MI induction.
In Vivo Interleukin‐10 and M‐CSF Inhibition
EGFP‐Spp1‐knock‐in reporter mice were randomly distributed into 3 treatment groups: control IgG, 200 μg of rat anti‐mouse interleukin‐10 (JES5‐2A5; Bio X Cell, Lebanon, NH), and 200 μg of rat anti‐mouse IL‐10 (Bio X Cell) plus 200 μg of rat anti‐mouse CSF1 (5A1; Bio X Cell). The treatments were administered daily via intraperitoneal injection starting 1 day before MI induction and continued for 3 days after MI induction.
In Vivo ERK1/2 Inhibition
EGFP‐Spp1‐knock‐in reporter mice were randomly distributed into 2 treatment groups, the control vehicle group (5% DMSO in PBS) and the SCH772984 group (25 mg/kg of SCH772984 in PBS [Selleck Chemicals]). Control vehicle or SCH772984 was administered daily via intraperitoneal injection starting 1 day before MI induction and continued for 3 days after MI induction.
Recombinant M‐CSF Treatment of EGFP‐Spp1‐Knock‐In Reporter Mice After MI
EGFP‐Spp1‐knock‐in reporter mice that underwent MI induction were randomly distributed into 2 treatment groups: control vehicle group and recombinant M‐CSF (rM‐CSF) group. Either control reagent (PBS) or 10 ng of rM‐CSF (BioLegend) was administered daily via intravenous injection starting on day 0 and continued for 3 days after MI induction.
Warfarin Administration Into EGFP‐Spp1‐Knock‐In Reporter Mice After MI
EGFP‐Spp1‐knock‐in reporter mice that underwent MI induction were randomly distributed into 2 treatment groups: control vehicle group and warfarin group. Either control reagent or 2 mg/kg of warfarin (Cayman Chemical) was administered daily via intraperitoneal injection starting on day 0 and continued for 3 days after MI induction.
Coculture of CD11b+Ly6G− Cells and Apoptotic Cardiomyocyte
Adult cardiomyocytes from 10‐week‐old WT mice were isolated and incubated in 0.8 mmol/L H2O2 for 10 hours. 16 For 72 hours, 2×10⁵ CD11b+Ly6G− cells isolated from the BM of EGFP‐Spp1‐knock‐in reporter mice were cocultured with control cardiomyocyte or apoptotic cardiomyocyte.
Quantitative Real‐Time Polymerase Chain Reaction
Total RNA samples from sorted cells and hearts were prepared using either the RNeasy Mini Kit (Qiagen, Hilden, Germany) or Trizol reagent (Invitrogen), according to the manufacturer's instructions. The First‐Strand cDNA Synthesis Kit (Invitrogen) was used for cDNA synthesis. Quantitative real‐time polymerase chain reaction was performed using ViiA 7 Real‐Time PCR System (Applied Biosystems, Foster City, CA). GAPDH was used as an endogenous control to normalize for differences in the amount of total RNA in each sample. All values are expressed as fold increase or decrease relative to the expression of GAPDH. Primer sequences for genes were as follows: Gapdh, 5′‐AGGTCGGTGTGAACGGATTTG‐3′ and 5′‐TGTAGACCATGTAGTTGAGGTCA‐3′; Spp1, 5′‐CCCGGTGAAGTGCTGATT‐3′ and 5′‐TTCTTCAGAGGACACAGCATTC‐3′; Col1a1, 5′‐GCTCCTCTTAGGGGCCACT‐3′ and 5′‐CCACGTCTCACCATTGGGG‐3′.
Statistical Analysis
All values are presented as the mean±SEM. The statistical significance of differences between 2 groups was determined using a 2‐sided unpaired Student t test. Differences among multiple groups were compared using ANOVA followed by Tukey's test. P<0.05 was considered statistically significant. Statistical analysis was performed by IBM SPSS Statistics version 26 software.
Results
MerTK Is Expressed in Cardiac Osteopontin‐Producing Macrophages After MI
We analyzed the hearts of EGFP‐Spp1 knock‐in reporter mice on day 3 after either the sham operation or MI inducement. Although macrophages were found in the hearts of both the sham‐operated and post‐MI mice, the cells from each group had very different properties. Typically, osteopontin‐producing galectin‐3hi macrophages are present in post‐MI hearts but not in sham‐operated hearts. 6 In the sham‐operated hearts, the cardiac F4/80+ CD11b+ Ly6G− macrophages expressed MerTK (Figure 1A). This result is consistent with other reports, 2 , 4 and it supports the notion that MerTK+ macrophages play an important role in maintaining tissue homeostasis.
Figure 1. A unique population of galectin‐3hi MerTK+ macrophages is the primary source of osteopontin in post‐MI hearts.
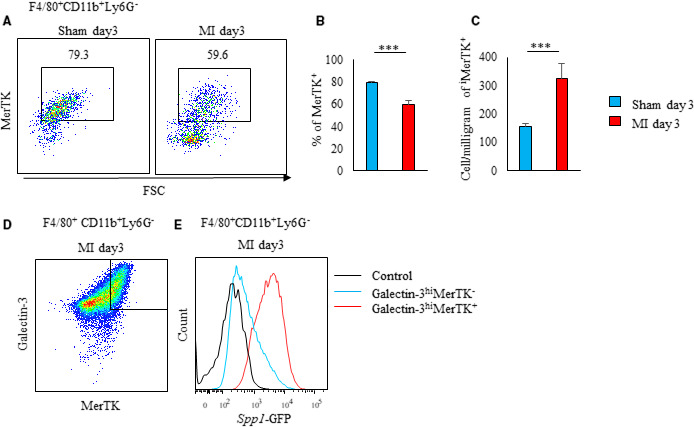
A through C, Flow cytometric analysis of MerTK expression in F4/80+CD11b+Ly6G− cells from sham‐operated and post‐MI hearts on day 3 (n=3 to 5 mice per group). Representative scatter plot of intracellular galectin‐3 and MerTK expression in F4/80+CD11b+Ly6G− cells (A). Bar graph shows the percentage of galectin‐3hi MerTK+ cells in F4/80+CD11b+Ly6G− cells (B). Bar graph shows the cell number per mg of galectin‐3hiMerTK+F4/80+CD11b+Ly6G− cells (C). D and E, Flow cytometric analysis of EGFP‐Spp1 expression in galectin‐3hiMerTK+ and galectin‐3hiMerTK− expressing F4/80+CD11b+ Ly6G− cells in post‐MI hearts. Representative scatter plot of intracellular galectin‐3 and MerTK expression in F4/80+CD11b+Ly6G− cells in post‐MI hearts on day 3 (D). Representative histogram of Spp1‐GFP expressing cells in galectin‐3hiMerTK+ and galectin‐3hiMerTK− expressing F4/80+CD11b+ Ly6G− cells from post‐MI hearts on day 3 (E). Flow cytometric analysis was performed in at least 3 independent experiments. Data are mean±SEM. ***P<0.001. EGFP indicates enhanced green fluorescent protein; GFP, green fluorescent protein; MerTK, Mer tyrosine kinase; and MI, myocardial infarction.
In the post‐MI hearts, the absolute number of MerTK+ macrophages increased (Figure 1A through 1C). MerTK was expressed in galectin‐3hi macrophages (Figure 1D). Green fluorescent protein–expressing macrophages coexpressed MerTK and galectin‐3 (Figure 1E). Therefore, cardiac macrophages coexpressing MerTK and galectin‐3 produced osteopontin after MI.
MerTK Expression Is Necessary for the Functional Maturation of Osteopontin‐Producing Macrophages
Among macrophages, CD206+ (M2) subtypes have been classified as reparative macrophages. 17 Both interleukin‐10 and interleukin‐4 induce M2‐like macrophage differentiation and galectin‐3 expression, but only interleukin‐10 induces the transcriptional activity of Spp1. 6 In cultured BM‐derived CD11b+Ly6G− cells, rIL‐10 induced the expression of both MerTK and galectin‐3, while rIL‐4 only induced galectin‐3 expression (Figure 2A and 2B). When BM‐derived CD11b+Ly6G− cells from EGFP‐Spp1‐knock‐in reporter mice were stimulated with rIL‐10, we observed Spp1 transcriptional activation in MerTK‐positive cells (Figure 2C). However, we did not observe Spp1 transcriptional activation in MerTK‐negative cells (Figure 2D). Therefore, MeTK expression was necessary for the functional maturation of osteopontin‐producing macrophages.
Figure 2. Bone marrow‐derived CD11b+ Ly6G− cells differentiate to osteopontin‐producing cells that express both galectin‐3hi and MerTK after in vitro interleukin‐10 treatment.
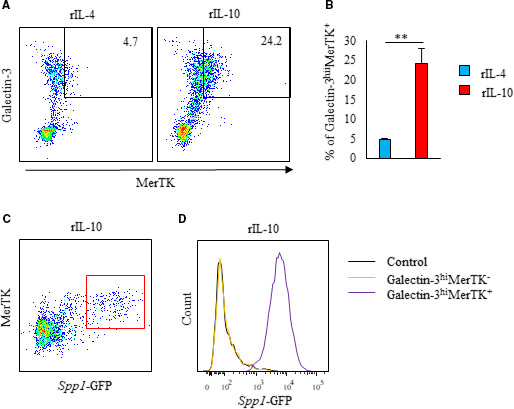
A through D, CD11b+Ly6G− cells were isolated from the bone marrow of 8‐ to 10‐week‐old EGFP‐Spp1‐knock‐in reporter mice and cultured for 3 days with rIL‐4 or rIL‐10. A and B, Flow cytometric analysis of intracellular galectin‐3 and MerTK was performed (n=5 per group). Representative scatter plot of intracellular galectin‐3 and MerTK expression in rIL‐4 or rIL‐10 treated CD11b+Ly6G− cells (A). Bar graph shows galectin‐3hiMerTK+expression in CD11b+Ly6G− cells (B). Representative scatter plot of Spp1‐GFP expression in MerTK+CD11b+Ly6G− cells treated with rIL‐10 (C). Representative histogram of Spp1‐GFP expression in galectin‐3hiMerTK+ and galectin‐3hiMerTK‐expressing CD11b+Ly6G− cells treated with rIL‐10 (D). Flow cytometric analysis was performed in at least 3 independent experiments. Data are mean±SEM. **P<0.01. EGFP indicates enhanced green fluorescent protein; GFP, green fluorescent protein; MerTK, Mer tyrosine kinase; MI, myocardial infarction; and rIL, recombinant interleukin.
STAT3 Pathway Induces MerTK
We previously determined that Spp1 transcriptional activation requires the activation of the STAT3 pathway. 6 To elucidate the involvement of STAT3 activation in MerTK expression, BM‐derived CD11b+ Ly6G− cells from EGFP‐Spp1‐knock‐in reporter mice were stimulated with rIL‐10 in either the presence or absence of Stattic. In the presence of Stattic, few BM‐derived CD11b+ Ly6G− cells differentiated into the MerTK+ galectin‐3hi subset (Figure 3A and 3B). After rIL‐10 stimulation, CD11b+Ly6G− cells from the Lgals3 (encoding galectin‐3) knockout mice differentiated into MerTK‐expressing cells at the same rate as the CD11b+Ly6G− cells from WT mice (Figure 3C).
Figure 3. STAT3‐MerTK‐Galectin‐3 axis regulates in vitro osteopontin expression.
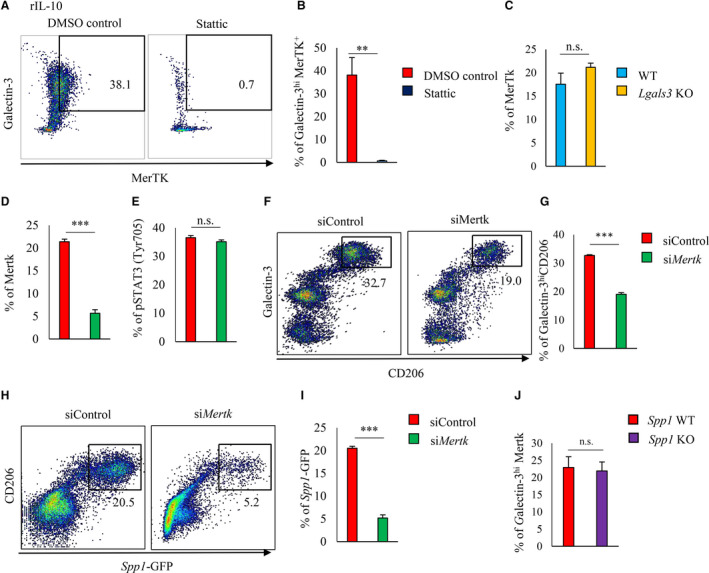
A and B, CD11b+Ly6G− cells were isolated from the bone marrow of 8‐ to 10‐week‐old WT mice and cultured for 3 days in rIL‐10+DMSO or rIL‐10+Stattic. Representative flow cytometry scatter plot of intracellular galectin‐3hiMerTK+ expression in CD11b+Ly6G− cells (A). Bar graph shows galectin‐3hi MerTK+ expression in CD11b+Ly6G− cells (n=5 per group) (B). C, CD11b+Ly6G− cells were isolated from the bone marrow of 8‐ to 10‐week‐old WT or Lgals3 KO mice and cultured in rIL‐10 for 3 days. Bar graph shows MerTK expression in CD11b+Ly6G− cells by flow cytometric analysis (n=5 mice per group). D through I, CD11b+Ly6G− cells were isolated from the bone marrow of 8‐ to 10‐week‐old EGFP‐Spp1‐knock‐in reporter mice and cultured in rIL‐10 for 3 days with siControl or siMerTK. Bar graphs show the expression of MerTK (D) and pSTAT3 (E) in CD11b+Ly6G− cells with either siControl or siMerTK (n=5 mice per group). Representative scatter plot of of intracellular galectin‐3 in CD206+ CD11b+ Ly6G− cells (F). Bar graph shows galectin‐3hiCD206+ expression in CD11b+Ly6G− cells (n=5 mice per group) (G). Representative scatter plot of Spp1‐GFP in CD206+ CD11b+ Ly6G− cells (H). Bar graph shows Spp1‐GFP expression in CD11b+Ly6G− cells (n=5 mice per group) (I). CD11b+Ly6G− cells were isolated from the bone marrow of 8‐ to 10‐week‐old WT or Spp1 knockout mice and cultured in rIL‐10 for 3 days. Bar graph shows galectin‐3hiMerTK+ expression in CD11b+Ly6G− cells (n=3 per group) (J). Flow cytometric analysis was performed in at least 3 independent experiments. Data are mean±SEM. **P<0.01, ***P<0.001; n.s., not significant. EGFP indicates enhanced green fluorescent protein; GFP, green fluorescent protein; MerTK, Mer tyrosine kinase; rIL, recombinant interleukin; STAT3, signal transducer and activator of transcription 3; and WT, wild‐type.
Next, MerTK was significantly knocked down by short interfering RNA in rIL‐10–stimulated BM‐derived CD11b+ Ly6G− cells from EGFP‐Spp1‐knock‐in reporter mice (Figure 3D and Figure S1A and S1B). Short interfering RNA knockdown of MerTK did not affect STAT3 activation (Figure 3E, Figure S1C), but it decreased the differentiation efficiency of galectin3hi CD206+ macrophages (Figure 3F and 3G) and markedly suppressed the Spp1 transcriptional activity of CD206+ macrophages (Figure 3H and 3I). Similar differentiation efficiencies for the MerTK+ galectin3hi subset after rIL‐10 stimulation were observed for the BM‐derived CD11b+ Ly6G− cells of Spp1 WT and knockout mice (Figure 3J).
MerTK specifically mediated the phagocytosis of apoptotic cells in inflammatory environments, and that activation of MerTK was required for this event. 8 However, apoptotic cardiomyocytes treated with hydrogen peroxide and CD11b+Ly6G− cells were cocultured, but the transcriptional activity of Spp1 was not induced (Figure S2A). Furthermore, the MerTK ligand, Gas6, which is a vitamin K–dependent protein, plays an important role in the signaling pathways downstream of MerTK activation. 18 Spp1‐EGFP knock‐in mice subjected to MI were treated with warfarin, a vitamin K inhibitor, up to days 0 to 3 to inhibit the function of Gas6. However, Spp1 transcriptional activity was similar in both groups (Figure S2B).
Thus, MerTK is upregulated via the STAT3 signaling pathway and MerTK expression activates galectin‐3hi macrophage differentiation and Spp1 transcription.
MerTK Expression in Cardiac Macrophages After MI Requires STAT3 Activation
We previously reported that cardiac macrophages have less STAT3 tyrosine phosphorylation and fewer galectin–3hi CD206+ subsets in post‐MI hearts of Il‐10 knockout mice than that of WT mice. 6 In this study, we found that the proportion and absolute number of MerTK+ galectin‐3hi macrophages were significantly smaller in Il‐10 KO mice than in WT mice (Figure 4A through 4C).
Figure 4. Inhibition of STAT3 tyrosine phosphorylation suppressed MerTK expression in cardiac macrophages after MI.
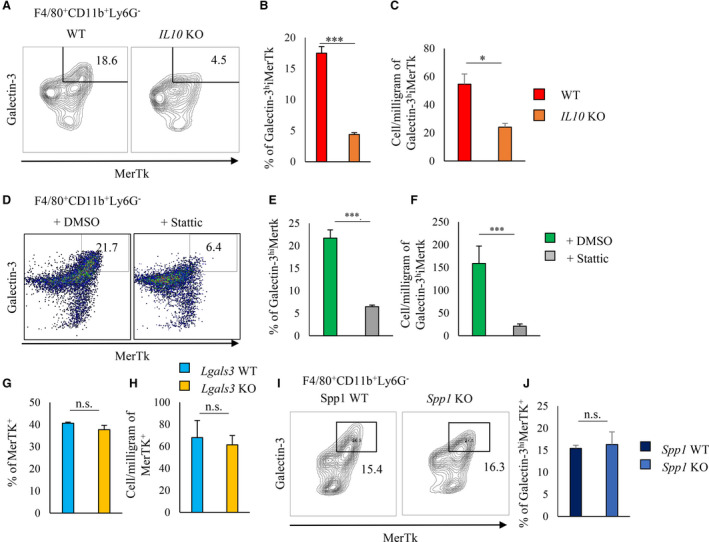
A through C, Flow cytometric analysis of galectin‐3 and MerTK expression in F4/80+CD11b+Ly6G− cells from post‐MI hearts on day 3 from WT and Il‐10 knockout mice. Representative scatterplot of galectin‐3hiMerTK+ expression in F4/80+CD11b+Ly6G− cells (A). Bar graphs show the percentage (B) and the cell number per milligram (C) of galectin‐3hiMerTK+ cells in F4/80+CD11b+Ly6G− cells (n=5 per group). D through F, DMSO or Stattic (STAT3 inhibitor) was administered to WT mice via intraperitoneal injection from 1 day before MI to days 3 after MI. Representative scatterplot of galectin‐3hiMerTK+ expression in F4/80+CD11b+Ly6G− cells (D). Bar graphs show the percentage of galectin‐3hiMerTK+ cells in CD11b+Ly6G− cells (E) and the cell number per milligram of galectin‐3hiMerTK+F4/80+CD11b+Ly6G− cells (n=8 per group) (F). G and H, Flow cytometric analysis of MerTK in F4/80+CD11b+Ly6G− cells from post‐MI hearts of WT and Lgals3 knockout mice. Bar graphs show the percentage (G) and cell number per milligram (H) of MerTK+ cells in F4/80+CD11b+Ly6G− cells (n=4 per group). I and J, Flow cytometric analysis of galectin‐3hiMerTK+ expression in F4/80+CD11b+Ly6G− cells from post‐MI hearts of WT and Spp1 knockout mice. Representative scatterplot of galectin‐3hiMerTK+ expression in F4/80+CD11b+Ly6G− cells. (I) Bar graph shows the percentage of MerTK+ cells in F4/80+CD11b+Ly6G− cells (n=3 per group) (J). Flow cytometric analysis was performed in at least 3 independent experiments. Data are mean±SEM. *P<0.05, ***P<0.001; n.s., not significant. EGFP indicates enhanced green fluorescent protein; GFP, green fluorescent protein; MerTK, Mer tyrosine kinase; MI, myocardial infarction; pSTAT3, phosphorylated signal transducer and activator of transcription 3; rIL, recombinant interleukin; and WT, wild‐type.
We previously reported that Stattic treatment suppressed the appearance of osteopontin‐producing galectin‐3hi CD206+ macrophages in post‐MI hearts. 6 Herein, Stattic suppressed STAT3 phosphorylation of cardiac macrophages 3 days post‐MI (Figure S3A) and significantly reduced both the proportion and absolute number of MerTK+ galectin‐3hi macrophages in post‐MI hearts (Figure 4D through 4F).
In contrast, similar proportions and absolute numbers of MerTK+ macrophages in post‐MI hearts were found in Lgals3 knockout mice and WT mice (Figure 4G and 4H, and Figure S3B). The proportion of MerTK+ galectin‐3hi macrophages in Spp1 knockout was similar to that of WT mice (Figure 4I and 4J). Therefore, STAT3 activation induced MerTK expression independently of either galectin‐3 or osteopontin expression in cardiac macrophages after MI.
Macrophage Colony‐Stimulating Factor (M‐CSF) Is Involved in the Differentiation of OPN‐Producing Macrophages After MI
When MI was induced in Il‐10 knockout EGFP‐Spp1 knock‐in mice, the proportion of green fluorescent protein–positive cells in cardiac macrophages significantly decreased but did not disappear completely (Figure 5A and 5B); this suggests that other cytokines besides interleukin‐10 may promote the differentiation of osteopontin‐producing macrophages. M‐CSF is known to play an important role in the differentiation of alternatively activated macrophages, and the costimulation of interleukin‐10 and M‐CSF regulates MerTK expression. 15
Figure 5. Interleukin‐10 requires M‐CSF to induce in vivo osteopontin‐producing macrophage differentiation and the upregulation of galectin‐3 and MerTK.
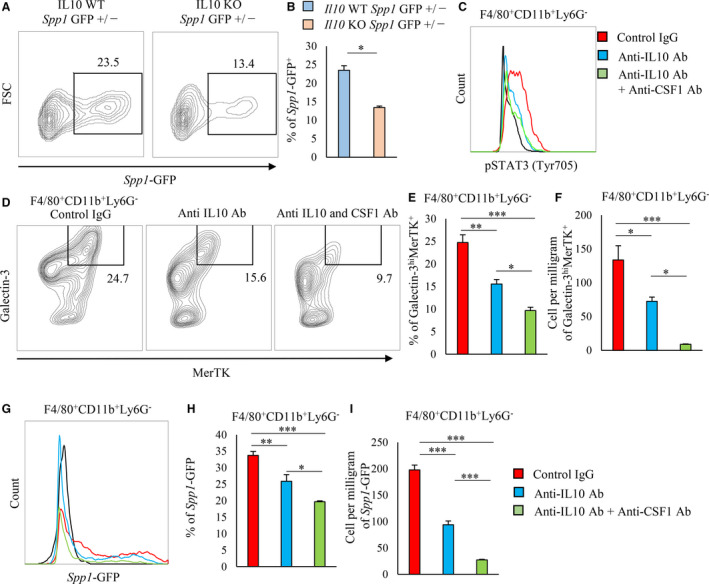
A and B, Flow cytometric analysis of GFP expression in CD11b+ Ly6G− cells in post‐MI hearts on day 3 from either Il‐10 WT or Il‐10 KO EGFP‐Spp1‐knock‐in reporter mice and is shown in the representative scatter plots (A). Bar graph shows the percentage of GFP+ expression in CD11b+Ly6G− cells (B). C through I, Control IgG, anti–interleukin‐10 antibody, or anti–interleukin‐10+anti–M‐CSF antibodies were administered to EGFP‐Spp1‐knock‐in reporter mice via intraperitoneal injection from 1 day before MI to 3 days MI. Representative histogram of pSTAT3 (Y705) expression in cardiac CD11b+Ly6G− cells treated with control IgG, anti–interleukin‐10 antibody, or anti–interleukin‐10+anti–M‐CSF antibodies. C, Flow cytometric analysis of intracellular galectin‐3 and MerTK expression in F4/80+CD11b+Ly6G− cells from post‐MI hearts treated with control IgG, anti–interleukin‐10 antibody, or anti–interleukin‐10+anti–M‐CSF antibodies. Representative plot of galectin‐3hiMerTK expression in F4/80+CD11b+Ly6G− cells (D). Bar graph shows the percentage of galectin‐3hiMerTK expression in F4/80+CD11b+Ly6G− cells (n=4 to 5 mice per group) (E). Bar graph shows the cell number per milligram of galectin‐3hiMerTK+F4/80+CD11b+Ly6G− cells (n=4 to 5 mice per group) (F). Representative histogram of Spp1‐GFP expression in F4/80+CD11b+Ly6G− cells (G). Bar graph shows the percentage of Spp1‐GFP expression in F4/80+CD11b+Ly6G− cells (n=4–5 mice per group) (H). Bar graph shows the cell number per mg of GFP+F4/80+CD11b+Ly6G− cells (n=4 to 5 mice per group) (I). Flow cytometric analysis was performed in at least 3 independent experiments. Data are mean±SEM. *P<0.05, **P<0.01, ***P<0.001. EGFP indicates enhanced green fluorescent protein; GFP, green fluorescent protein; M‐CSF, macrophage colony‐stimulating factor; MerTK, Mer tyrosine kinase; MI, myocardial infarction; pSTAT3, phosphorylated signal transducer and activator of transcription 3; and rIL, recombinant interleukin.
To clarify the contribution of M‐CSF in the differentiation of osteopontin‐producing macrophages after MI, we administered control IgG, anti–‐interleukin‐10 antibody, or anti–interleukin‐10 antibody plus anti–M‐CSF antibody to EGFP‐Spp1 knock‐in mice subjected to MI. STAT3 phosphorylation (Figure 5C), the proportion and absolute number of MerTK+ galectin‐3hi cells (Figure 5D through 5F), and the proportion and absolute number of green fluorescent protein–positive cells (Figure 5G through 5I) in cardiac macrophages were suppressed by the anti–interleukin‐10 antibody but were substantially suppressed by the coadministration of anti–interleukin‐10 and anti–M‐CSF antibodies.
We performed in vitro stimulation of BM‐derived CD11b+ Ly6G− cells from EGFP‐Spp1 knock‐in mice with either rIL‐10 or a combination of rIL‐10 plus rM‐CSF. Co‐stimulation of rIL‐10 plus rM‐CSF more potently induced the differentiation of MerTK+ galectin‐3hi cells (Figure S4A) and green fluorescent protein–positive cells (Figure S4B and S4C) than did interleukin‐10 stimulation. Also, costimulation with rIL‐10 plus rM‐CSF more strongly activated efferocytosis than interleukin‐10 stimulation (Figure S4D and S4E). Therefore, interleukin‐10 and M‐CSF cooperatively promoted the differentiation of osteopontin‐producing MerTK+ galectin‐3hi macrophages, which contributed to the sufficient clearance of dead cells in post‐MI hearts.
Transcriptional Activation of Spp1 Requires ERK1/2 Activation
We previously reported that the interleukin‐10–STAT3–galectin‐3 axis is essential for osteopontin‐producing reparative macrophage polarization. 6 The stimulation of colivelin, which is a neuroprotective peptide that activates STAT3, significantly induced both STAT3 activation and galectin‐3 upregulation in cultured BM‐derived CD11b+ Ly6G− cells from EGFP‐Spp1 knock‐in mice (Figure S5A and S5B); however, colivelin did not induce Spp1 transcriptional activity in these cells (Figure S5C and S5D).
In addition to STAT3 activation, ERK1/2 activation is essential for the differentiation of alternatively activated macrophages. 19 , 20 rIL‐10 activated ERK1/2 in cultured BM‐derived CD11b+ Ly6G− cells from EGFP‐Spp1 knock‐in mice, but rIL‐4 did not activate ERK1/2 in these cells (Figure S6A). The costimulation of rIL‐10 and rM‐CSF more strongly activated ERK1/2 than did rIL‐10 independently (Figure 6A). SCH772984, an inhibitor of ERK1/2, significantly suppressed the ERK1/2 activation induced by rIL‐10 and rM‐CSF (Figure 6B); Spp1 transcriptional activity was also suppressed by SCH772984 (Figure 6C). SCH772984 did not affect STAT3 activation (Figure S6B) or the differentiation of galectin‐3hi MerTK+ subset (Figure 6E). However, ERK activation by the costimulation of rIL‐10 and rM‐CSF was not affected by Stattic's suppression of STAT3 activity or knockdown of Lgals3 or MerTK (Figure S6C and S6D). Spp1 knockout mouse‐derived CD11b+Ly6G− cells expressed similar ERK1/2 activation levels to the WT mice‐derived CD11b+Ly6G− cells when costimulated by rIL‐10 and rM‐CSF (Figure S6E).
Figure 6. ERK1/2 phosphorylation regulates in vitro OPN expression.
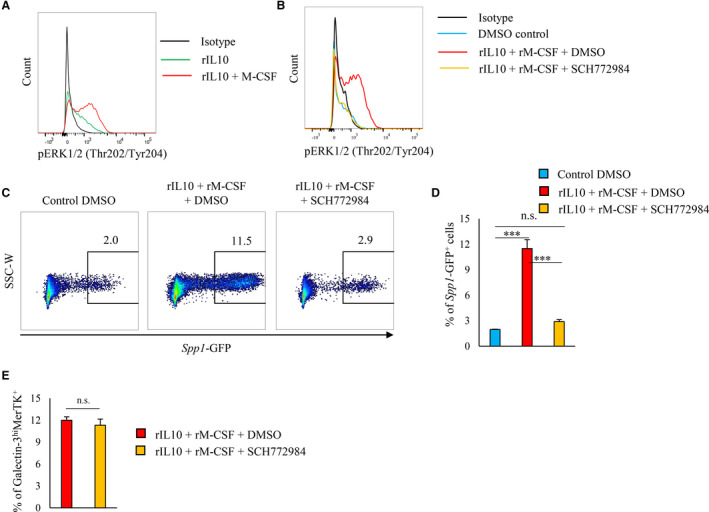
A, CD11b+Ly6G− cells were isolated from the bone marrow of 8‐ to 10‐week‐old WT mice and cultured for 3 days with either rIL‐10 or rIL‐10+rM‐CSF. Representative histogram of pERK1/2 (Thr202/Tyr204) expression in CD11b+Ly6G− cells (A). B through E, CD11b+Ly6G− cells were isolated from the bone marrow of 8‐ to 10‐week‐old WT mice and cultured for 3 days treated with rIL‐10+rM‐CSF plus DMSO, rIL‐10+rM‐CSF+SCH772984 (ERK1/2 inhibitor), or DMSO. Representative histogram of pERK1/2 (Thr202/Tyr204) in CD11b+Ly6G− cells (B). Representative scatter plot of EGFP‐Spp1 expression (C), and bar graph shows the percentage of EGFP‐Spp1 (D). Bar graph shows the percentage of galectin‐3hiMerTK+ expression in CD11b+Ly6G− cells (E). Flow cytometric analysis was performed in at least 3 independent experiments. Data are mean±SEM. ***P<0.001; n.s., not significant. EGFP indicates enhanced green fluorescent protein; ERK, extracellular signal‐regulated kinase; MerTK, Mer tyrosine kinase; M‐CSF, macrophage colony‐stimulating factor; MI, myocardial infarction; pERK, phosphorylated extracellular signal‐regulated kinase; rIL, recombinant interleukin; and WT, wild‐type.
The in vivo activation of ERK1/2 in cardiac macrophages of post‐MI hearts occurred on day 3 but did not occur in the sham‐operated hearts (Figure 7A and 7B). We observed ERK1/2 activation in MerTK+ galectin‐3hi macrophages but not in MerTK− galectin‐3hi macrophages (Figure S7A).
Figure 7. ERK1/2 phosphorylation regulates in vivo osteopontin expression.
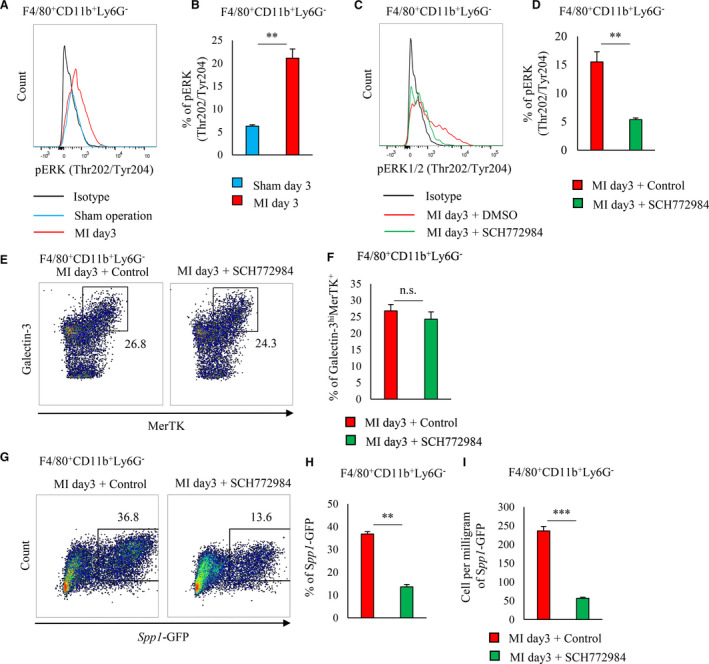
A, Representative histogram of pERK1/2 (Thr202/Tyr204) expression in cardiac F4/80+ CD11b+Ly6G− cells of either sham‐operated or post‐MI hearts on day 3 (n=3 mice per group) (A). Bar graph shows the percentage of pERK1/2 (Thr202/Tyr204)‐expressing cells in F4/80+CD11b+Ly6G− cells (n=3 mice per group) (B). C through I, DMSO or SCH772984 (ERK1/2 inhibitor) was administered to EGFP‐Spp1‐knock‐in reporter mice via intraperitoneal injection from 1 day before MI to 3 days after MI. Representative flow cytometry histogram of pERK1/2 expression in cardiac F4/80+CD11b+Ly6G− cells treated with either DMSO or SCH772984 (C). Bar graph shows the percentage of pERK1/2 (Thr202/Tyr204)‐expressing cells in F4/80+CD11b+Ly6G− cells (n=5 mice per group) (D). Flow cytometric analysis of intracellular galectin‐3 and MerTK expression in F4/80+CD11b+Ly6G− cells from post‐MI hearts treated DMSO or SCH772984. Representative scatter plot of galectin‐3hi MerTK expression in F4/80+CD11b+Ly6G− cells (E). Bar graph shows the percentage of galectin‐3hi MerTK cells in CD11b+Ly6G− cells (n=5 mice per group) (F). Representative scatter plot of GFP‐MerTK+ expression in F4/80+CD11b+Ly6G− cells (G). Bar graph shows the percentage of Spp1‐GFP+ cells in F4/80+CD11b+Ly6G− cells (n=5 mice per group) (H). Bar graph shows the cell number per mg of Spp1‐GFP+F4/80+CD11b+Ly6G− cells (n=5 mice per group) (I). Flow cytometric analysis was performed in at least 3 independent experiments. Data are mean±SEM. **P<0.01, ***P<0.001; n.s., not significant. EGFP indicates enhanced green fluorescent protein; ERK, extracellular signal‐regulated kinase; MerTK, Mer tyrosine kinase; MI, myocardial infarction; and pERK, phosphorylated extracellular signal‐regulated kinase.
After MI was induced in EGFP‐Spp1 knock‐in reporter mice, SCH772984 was injected intraperitoneally. SCH772984 suppressed ERK1/2 activation in cardiac macrophages 3 days after MI induction (Figure 7C and 7D). ERK1/2 suppression did not affect STAT3 phosphorylation (Figure S7B) or the proportion of MerTK+ galectin‐3hi in the total cardiac macrophages (Figure 7E and 7F); but ERK1/2 suppression by SCH772984 significantly suppressed Spp1 transcriptional activity (Figure 7G through 7I). On the other hand, Stattic treatment did not affect ERK1/2 activation in cardiac macrophages after MI (Figure S7C). Coadministration of interleukin‐10 and M‐CSF neutralizing antibodies inhibited ERK1/2 activation in cardiac macrophages after MI (Figure S7D).
There were no differences in ERK1/2 phosphorylation of cardiac macrophages from either Spp1 knockout mice or Spp1 WT mice (Figure S7E). Therefore, interleukin‐10 and M‐CSF cooperatively activated ERK1/2 independent of STAT3; this STAT3‐independent ERK1/2 activation pathway was essential for the transcriptional activation of Spp1 in MerTK+ galectin‐3hi macrophages of post‐MI hearts.
Recombinant M‐CSF Administration Accelerates Infarct Repair After MI by Inducing OPN‐Producing Macrophage Differentiation
To examine whether rM‐CSF treatment accelerates infarct repair after MI by inducing osteopontin‐producing macrophage differentiation, we treated post‐MI EGFP‐Spp1‐knock‐in reporter mice with either rM‐CSF or control reagent from day 0 to day 3. Administration of rM‐CSF increased the proportion and number of galectin‐3hi MerTK+ and osteopontin‐producing subsets in F4/80+CD11b+Ly6G− cells of post‐MI hearts when compared with mice receiving the control reagent (Figure 8A through 8C). In the infarcted myocardium on day 3, the gene expression of Spp1 and Col1a1 increased in mice treated with rM‐CSF when compared with the control reagent (Figure 8D and 8E). Histochemical analysis demonstrated that administration of rM‐CSF increased the fibrosis of the infarcted myocardium (Figure S8A and S8B), and echocardiography analysis also showed an increase in the wall thickness of the interventricular septum wall of the infarcted myocardium (Figure S8C). Although there was no significant difference in left ventricular end‐diastolic volume or left ventricular end‐systolic volume between the 2 groups, left ventricular end‐diastolic volume and left ventricular end‐systolic volume tended to be smaller in the rM‐CSF group compared with the control group (Figure S8C). These results were consistent with previous reports. 21 , 22 , 23 Histochemical analysis demonstrated that more osteopontin‐producing cells remained in mice treated with rM‐CSF than with the control reagent on day 7 after MI (Figure 8F). Furthermore, there were fewer TUNEL (terminal deoxynucleotidyl transferase 2′‐deoxyuridine‐5′‐triphosphate nick‐end labeling)‐positive cells in the infarcted myocardium of mice treated with rM‐CSF than the control (Figures 8F and 8G). Therefore, M‐CSF treatment after MI is a promising strategy that accelerated myocardial tissue repair.
Figure 8. M‐CSF treatment improves myocardial repair by inducing osteopontin‐producing macrophage differentiation after MI.
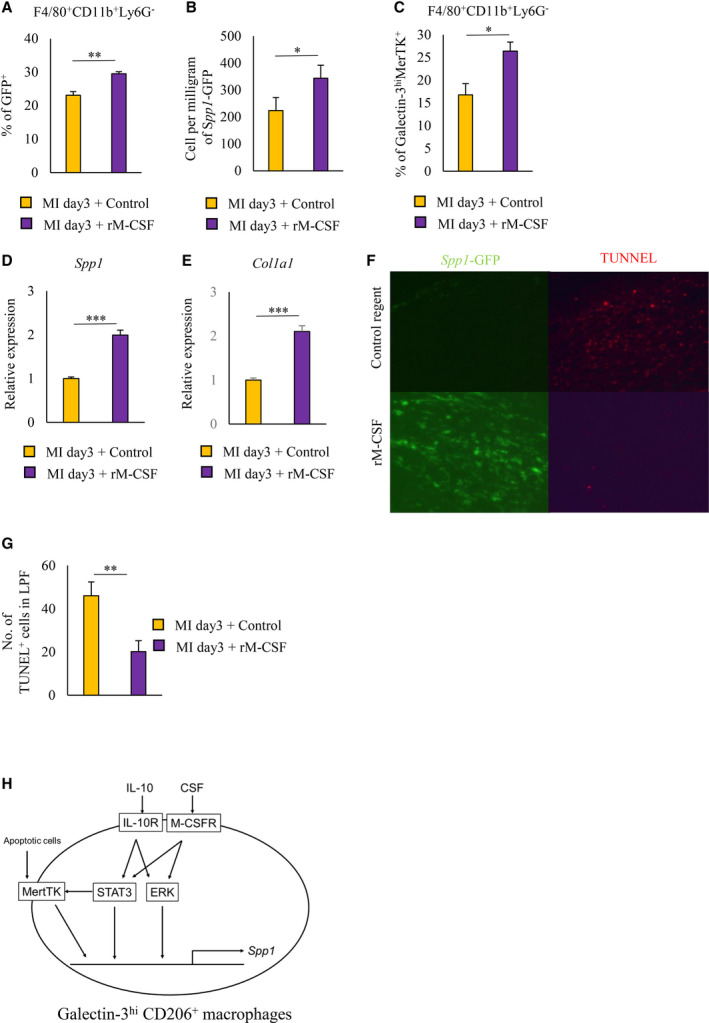
A through F, Control reagent or rM‐CSF was administered to EGFP‐Spp1‐knock‐in reporter mice via intravenous injection from day 0 to day 3 after MI. Bar graphs show the percentage (A) and cell number per mg (B) of Spp1‐GFP+ cells in F4/80+CD11b+Ly6G− cells from post‐MI hearts. Bar graph shows the intracellular galectin‐3MerTK expression in F4/80+CD11b+Ly6G− cells from post‐MI hearts (C). mRNA expression levels of Spp1 (D) and Col1a1 (E) were quantified in post‐MI hearts on day 3 of WT mice treated with control regent or rM‐CSF (n=9 mice per group). Histochemical identification of TUNEL‐positive cells in post‐MI hearts from EGFP‐Spp1‐knock‐in reporter mice on day 7 (F). Total cell number of TUNEL‐positive cells in post‐MI hearts (G). Schematic illustration depicts the pathway that induced the differentiation of osteopontin‐producing macrophages after MI (H). Data are mean±SEM. *P<0.05, **P<0.01, ***P<0.001. EGFP indicates enhanced green fluorescent protein; M‐CSF, macrophage colony‐stimulating factor; MerTK, Mer tyrosine kinase; MI, myocardial infarction; rM‐CSF, recombinant macrophage colony‐stimulating factor; and TUNEL, terminal deoxynucleotidyl transferase 2′‐deoxyuridine‐5′‐triphosphate nick‐end labeling.
Discussion
In this study, we determined that galectin‐3hi macrophages, which almost exclusively produce osteopontin in the heart after MI, express MerTK. STAT3 activation was involved in MerTK expression and strongly enhanced Spp1 transcriptional activity in galectin‐3hi macrophages. After the occurrence of MI, osteopontin‐producing MerTK+ galectin‐3hi cardiac macrophages functionally matured when stimulated by interleukin‐10 and M‐CSF. These cardiac macrophages also required STAT3 activation; but, STAT3 was insufficient at independently inducing Spp1 transcriptional activity. We also found that ERK1/2 activation is essential for the induction of Spp1 transcriptional activity independently of STAT3‐dependent induction of galectin‐3 or MerTK. Thus, interleukin‐10 and M‐CSF synergistically activated the pathways of STAT3 and ERK1/2.
OPN plays an indispensable role in tissue repair after MI; it promotes efferocytosis through cytokine production, macrophage migration and survival, and antigen opsonization. 24 , 25 , 26 Prolonged inflammation was caused by the insufficient clearance of dead cells in Spp1 knockout mice subjected to MI. 27 We recently demonstrated that Spp1 knockout mice showed vulnerability in developing post‐MI left ventricular chamber dilatation, which was caused by the accumulation of numerous unengulfed TUNEL‐positive cells in the infarcted myocardium. 6
In this study, we demonstrated that MerTK expression in galectinhi CD206+ macrophages enhanced Spp1 transcriptional activity and promoted efficient efferocytosis. MerTK expression in macrophages is important for the mediated tethering and engulfment of apoptotic cells. 14 Thus, MerTK is involved in the elimination of self‐antigens caused by dead cells, suppression of inflammatory cytokines induced by the Toll‐like receptor pathway, and suppression of autoreactive B‐cell and T‐cell proliferation; thereby establishing the immune tolerance of MerTK. 28 , 29 MerTK signaling increases the cytoplasm/nucleus ratio of 5‐lipoxygenase, a synthase of specialized pro‐resolving lipid mediator, and promotes specialized pro‐resolving lipid mediator production. 30 Moreover, others reported the potential mitigation of inflammation by MerTK‐mediated specialized pro‐resolving lipid mediator production in ischemia‐reperfused hearts. 4
The MerTK ligand Gas6, which is a vitamin K–dependent protein, plays a role in tethering MerTK and dead cells. 31 MerTK‐mediated capture and engulfment are enhanced by the Gas6 opsonization of dead cells. 14 , 31 The Gas6 blood concentration decreases during the acute phase of ST‐segment elevation MI in humans. 32 However, the pathophysiological significance of this phenomenon remains unclear. The size of rat infarcts is reduced by increasing the Gas6 expression after myocardial ischemia‐reperfusion injury. 33 Several groups investigated the signaling pathways downstream of MerTK activation. 18 Signaling downstream of MerTK is involved in promoting survival, increasing migration, inhibiting apoptosis, and so on, and has diversity. However, our data demonstrated that inhibition of Gas6 by warfarin did not alter the transcriptional activity of Spp1 in post‐MI macrophages. These results suggest that the Gas6‐MerTK signal may not be so important for the transcriptional activity of Spp1 in post‐MI macrophages. Further elucidation of the mechanism should be the subject of future study.
We demonstrated that both interleukin‐10 and M‐CSF are involved in the differentiation and maturation of osteopontin‐producing MerTK+ galectin‐3hi macrophages in the heart after MI. In dogs, M‐CSF expression is markedly elevated in the infarcted myocardium. 21 In rats, M‐CSF treatment attenuates the deterioration of left ventricular function after MI by accelerating infarct repair. 22 In mice, blocking colony‐stimulating factor–1R kinase signaling reduced the number of M2‐like macrophages in the heart after MI and delayed the resolution of inflammation. 23 Even though our findings are consistent with previous reports that demonstrate the benefits of M‐CSF treatment after MI, the exact mechanism remains unclear. In this study, we demonstrated that M‐CSF treatment accelerated infarct repair after MI by inducing osteopontin‐producing macrophage differentiation, which then enhanced fibrosis and efferocytosis of dead cells in the infarcted myocardium. Although M‐CSF have a pleiotropic function, one of the detailed mechanisms of the previously shown effects of M‐CSF administration on cardiac function after MI is that it enhances the differentiation and induction of osteopontin‐producing macrophages. Thus, our results suggest that M‐CSF is just as important as interleukin‐10 for the induction of reparative macrophage differentiation after MI.
Although STAT3 activation is essential, it is insufficient at independently inducing osteopontin‐producing macrophage differentiation in the heart after MI. We found that Spp1 transcriptional activity requires the activation of ERK1/2 signaling that is independent of STAT3 signaling. Furthermore, ERK1/2 plays an important role in the induction of M2‐like macrophage differentiation by M‐CSF. 20 In this study, we demonstrated that ERK1/2 is phosphorylated in M2‐like macrophages of the infarcted myocardium and that the administration of neutralizing antibodies against interleukin‐10 and M‐CSF suppressed this type of ERK phosphorylation; however, it was not affected by the suppression of MerTK expression by a STAT3 inhibitor. Therefore, we determined that the parallel activation of STAT3 and ERK signaling maximizes the transcriptional activity of Spp1 in M2‐like macrophages (Figure 8H).
In conclusion, interleukin‐10 and M‐CSF activate both STAT3 and ERK in cardiac macrophages of the infarcted myocardium. Activated STAT3 induces osteopontin‐producing macrophage differentiation by upregulating the expression of galectin‐3 and MerTK. Thus, Spp1 transcription activity requires activated ERK and STAT3.
Although the acute mortality rate of MI has decreased in recent years, the number of patients who develop heart failure after MI is increasing. Accordingly, stimulating the differentiation and maturation of osteopontin‐producing MerTK+ galectin‐3hi macrophages may suppress post‐MI cardiac remodeling and prevent the onset of heart failure by promoting optimal wound healing.
Sources of Funding
This study was supported by JSPS Grant‐in‐Aid for Scientific Research (B) Grant Number 18H02812 (2018‐2020) (to Sano) and JSPS Grant‐in Aid for Young Scientists Grant Number JP18K15197 (2018–2019), Grant‐in‐Aid for JSPS Fellows Grant Number JP19J00583H (2018‐2020), a grant from SENSHIN Medical Research Foundation, a grant from the Kanae Foundation for the Promotion of Medical Science, and a grant from Mochida Memorial Foundation for Medical and Pharmaceutical Research (to Shirakawa).
Disclosures
None.
Supporting information
Figures S1–S8
Acknowledgments
We thank Nagahiro Minato (Kyoto University, Japan), Akihiro Yoshimura (Keio University, Japan), and Nobuyuki Takakura (Osaka University, Japan) for providing technical support.
Author contributions: Shirakawa and Sano designed the experiments. KS conducted most of the experiments. Endo, Kataoka, Katsumata, Anzai, MS, Kitakata, Ko, Goto, Hiraide, and Ichihara helped in the experimental work. Shirakawa and Sano analyzed and interpreted the data and wrote the manuscript. Fukuda and Minamino supervised.
(J Am Heart Assoc. 2020;9:e017071 DOI: 10.1161/JAHA.120.017071.)
Supplementary Materials for this article are available at https://www.ahajournals.org/doi/suppl/10.1161/JAHA.120.017071
For Sources of Funding and Disclosures, see page 15.
References
- 1. Horckmans M, Ring L, Duchene J, Santovito D, Schloss MJ, Drechsler M, Weber C, Soehnlein O, Steffens S. Neutrophils orchestrate post‐myocardial infarction healing by polarizing macrophages towards a reparative phenotype. Eur Heart J. 2017;187–197. [DOI] [PubMed] [Google Scholar]
- 2. Wan E, Yeap XY, Dehn S, Terry R, Novak M, Zhang S, Iwata S, Han X, Homma S, Drosatos K, et al. Enhanced efferocytosis of apoptotic cardiomyocytes through myeloid‐epithelial‐reproductive tyrosine kinase links acute inflammation resolution to cardiac repair after infarction. Circ Res. 2013;1004–1012. [DOI] [PMC free article] [PubMed] [Google Scholar]
- 3. Shiraishi M, Shintani Y, Shintani Y, Ishida H, Saba R, Yamaguchi A, Adachi H, Yashiro K, Suzuki K. Alternatively activated macrophages determine repair of the infarcted adult murine heart. J Clin Invest. 2016;2151–2166. [DOI] [PMC free article] [PubMed] [Google Scholar]
- 4. DeBerge M, Yeap XY, Dehn S, Zhang S, Grigoryeva L, Misener S, Procissi D, Zhou X, Lee DC, Muller WA, et al. MerTK cleavage on resident cardiac macrophages compromises repair after myocardial ischemia reperfusion injury. Circ Res. 2017;930–940. [DOI] [PMC free article] [PubMed] [Google Scholar]
- 5. Wynn TA, Vannella KM. Macrophages in tissue repair, regeneration, and fibrosis. Immunity. 2016;450–462. [DOI] [PMC free article] [PubMed] [Google Scholar]
- 6. Shirakawa K, Endo J, Kataoka M, Katsumata Y, Yoshida N, Yamamoto T, Isobe S, Moriyama H, Goto S, Kitakata H, et al. IL (interleukin)‐10-STAT3‐galectin‐3 axis is essential for osteopontin‐producing reparative macrophage polarization after myocardial infarction. Circulation. 2018;2021–2035. [DOI] [PubMed] [Google Scholar]
- 7. MacKinnon AC, Farnworth SL, Hodkinson PS, Henderson NC, Atkinson KM, Leffler H, Nilsson UJ, Haslett C, Forbes SJ, Sethi T. Regulation of alternative macrophage activation by galectin‐3. J Immunol. 2008;2650–2658. [DOI] [PubMed] [Google Scholar]
- 8. Zagorska A, Traves PG, Lew ED, Dransfield I, Lemke G. Diversification of TAM receptor tyrosine kinase function. Nat Immunol. 2014;920–928. [DOI] [PMC free article] [PubMed] [Google Scholar]
- 9. Fourgeaud L, Traves PG, Tufail Y, Leal‐Bailey H, Lew ED, Burrola PG, Callaway P, Zagorska A, Rothlin CV, Nimmerjahn A, et al. TAM receptors regulate multiple features of microglial physiology. Nature. 2016;240–244. [DOI] [PMC free article] [PubMed] [Google Scholar]
- 10. Wium M, Paccez JD, Zerbini LF. The dual role of TAM receptors in autoimmune diseases and cancer: an overview. Cells. 2018;166. [DOI] [PMC free article] [PubMed] [Google Scholar]
- 11. Nishi C, Yanagihashi Y, Segawa K, Nagata S. MERTK tyrosine kinase receptor together with TIM4 phosphatidylserine receptor mediates distinct signal transduction pathways for efferocytosis and cell proliferation. J Biol Chem. 2019;7221–7230. [DOI] [PMC free article] [PubMed] [Google Scholar]
- 12. Lee CH, Chun T. Anti‐inflammatory role of TAM family of receptor tyrosine kinases via modulating macrophage function. Mol Cells. 2019;1–7. [DOI] [PMC free article] [PubMed] [Google Scholar]
- 13. Graham DK, DeRyckere D, Davies KD, Earp HS. The TAM family: phosphatidylserine sensing receptor tyrosine kinases gone awry in cancer. Nat Rev Cancer. 2014;769–785. [DOI] [PubMed] [Google Scholar]
- 14. Dransfield I, Zagorska A, Lew ED, Michail K, Lemke G. Mer receptor tyrosine kinase mediates both tethering and phagocytosis of apoptotic cells. Cell Death Dis. 2015;e1646. [DOI] [PMC free article] [PubMed] [Google Scholar]
- 15. Zizzo G, Hilliard BA, Monestier M, Cohen PL. Efficient clearance of early apoptotic cells by human macrophages requires M2c polarization and MerTK induction. J Immunol. 2012;3508–3520. [DOI] [PMC free article] [PubMed] [Google Scholar]
- 16. Xiang J, Wan C, Guo R, Guo D. Is hydrogen peroxide a suitable apoptosis inducer for all cell types? Biomed Res Int. 2016;7343965. [DOI] [PMC free article] [PubMed] [Google Scholar]
- 17. Orecchioni M, Ghosheh Y, Pramod AB, Ley K. Macrophage polarization: different gene signatures in M1(LPS+) vs. classically and M2(LPS‐) vs. alternatively activated macrophages. Front Immunol. 2019;1084. [DOI] [PMC free article] [PubMed] [Google Scholar]
- 18. Cummings CT, Deryckere D, Earp HS, Graham DK. Molecular pathways: MERTK signaling in cancer. Clin Cancer Res. 2013;5275–5280. [DOI] [PMC free article] [PubMed] [Google Scholar]
- 19. Mu X, Shi W, Xu Y, Xu C, Zhao T, Geng B, Yang J, Pan J, Hu S, Zhang C, et al. Tumor‐derived lactate induces M2 macrophage polarization via the activation of the ERK/STAT3 signaling pathway in breast cancer. Cell Cycle. 2018;428–438. [DOI] [PMC free article] [PubMed] [Google Scholar]
- 20. Richardson ET, Shukla S, Nagy N, Boom WH, Beck RC, Zhou L, Landreth GE, Harding CV. ERK signaling is essential for macrophage development. PLoS One. 2015;e0140064. [DOI] [PMC free article] [PubMed] [Google Scholar]
- 21. Frangogiannis NG, Mendoza LH, Ren G, Akrivakis S, Jackson PL, Michael LH, Smith CW, Entman ML. MCSF expression is induced in healing myocardial infarcts and may regulate monocyte and endothelial cell phenotype. Am J Physiol Heart Circ Physiol. 2003;H483–H492. [DOI] [PubMed] [Google Scholar]
- 22. Yano T, Miura T, Whittaker P, Miki T, Sakamoto J, Nakamura Y, Ichikawa Y, Ikeda Y, Kobayashi H, Ohori K, et al. Macrophage colony‐stimulating factor treatment after myocardial infarction attenuates left ventricular dysfunction by accelerating infarct repair. J Am Coll Cardiol. 2006;626–634. [DOI] [PubMed] [Google Scholar]
- 23. Leblond AL, Klinkert K, Martin K, Turner EC, Kumar AH, Browne T, Caplice NM. Systemic and cardiac depletion of M2 macrophage through CSF‐1R signaling inhibition alters cardiac function post myocardial infarction. PLoS One. 2015;e0137515. [DOI] [PMC free article] [PubMed] [Google Scholar]
- 24. Rittling SR. Osteopontin in macrophage function. Expert Rev Mol Med. 2011;e15. [DOI] [PubMed] [Google Scholar]
- 25. Schack L, Stapulionis R, Christensen B, Kofod‐Olsen E, Skov Sorensen UB, Vorup‐Jensen T, Sorensen ES, Hollsberg P. Osteopontin enhances phagocytosis through a novel osteopontin receptor, the alphaXbeta2 integrin. J Immunol. 2009;6943–6950. [DOI] [PubMed] [Google Scholar]
- 26. Shin YJ, Kim HL, Choi JS, Choi JY, Cha JH, Lee MY. Osteopontin: correlation with phagocytosis by brain macrophages in a rat model of stroke. Glia. 2011;413–423. [DOI] [PubMed] [Google Scholar]
- 27. Trueblood NA, Xie Z, Communal C, Sam F, Ngoy S, Liaw L, Jenkins AW, Wang J, Sawyer DB, Bing OH, et al. Exaggerated left ventricular dilation and reduced collagen deposition after myocardial infarction in mice lacking osteopontin. Circ Res. 2001;1080–1087. [DOI] [PubMed] [Google Scholar]
- 28. Cabezon R, Carrera‐Silva EA, Florez‐Grau G, Errasti AE, Calderon‐Gomez E, Lozano JJ, Espana C, Ricart E, Panes J, Rothlin CV, et al. MERTK as negative regulator of human T cell activation. J Leukoc Biol. 2015;751–760. [DOI] [PMC free article] [PubMed] [Google Scholar]
- 29. Wallet MA, Sen P, Flores RR, Wang Y, Yi Z, Huang Y, Mathews CE, Earp HS, Matsushima G, Wang B, et al. MerTK is required for apoptotic cell‐induced T cell tolerance. J Exp Med. 2008;219–232. [DOI] [PMC free article] [PubMed] [Google Scholar]
- 30. Cai B, Thorp EB, Doran AC, Subramanian M, Sansbury BE, Lin CS, Spite M, Fredman G, Tabas I. MerTK cleavage limits proresolving mediator biosynthesis and exacerbates tissue inflammation. Proc Natl Acad Sci U S A. 2016;6526–6531. [DOI] [PMC free article] [PubMed] [Google Scholar]
- 31. van der Meer JH, van der Poll T, van ‘t Veer C. TAM receptors, Gas6, and protein S: roles in inflammation and hemostasis. Blood. 2014;2460–2469. [DOI] [PubMed] [Google Scholar]
- 32. Caldentey G, Garcia De Frutos P, Cristobal H, Garabito M, Berruezo A, Bosch X, San Antonio R, Flores‐Umanzor E, Perea RJ, De Caralt TM. Serum levels of growth arrest‐specific 6 protein and soluble AXL in patients with ST‐segment elevation myocardial infarction. Eur Heart J Acute Cardiovasc Care. 2019;708–716. [DOI] [PubMed] [Google Scholar]
- 33. Wu M, Lu S, Zhong J, Huang K, Zhang S. Protective effects of pterostilbene against myocardial ischemia/reperfusion injury in rats. Inflammation. 2017;578–588. [DOI] [PubMed] [Google Scholar]
Associated Data
This section collects any data citations, data availability statements, or supplementary materials included in this article.
Supplementary Materials
Figures S1–S8