

Hemorrhage and thrombosis are major causes of morbidity and mortality during extracorporeal membrane oxygenation (ECMO). Even in a controlled setting, bleeding occurs frequently—almost half (46%) of the patients randomized to ECMO in the EOLIA trial had hemorrhage requiring transfusion [1]. The pathophysiology of these complications during ECMO is complex, dynamic and not fully understood [2]. This may explain why standard approaches to monitor coagulation are imperfect and studies that employ traditional biostatistical methods do not consistently identify common risk factors. We applied machine learning to an ECMO dataset to predict hemorrhage and thrombosis. Our hypothesis was that machine learning would accurately predict these events and identify novel factors not anticipated clinically or identified by traditional biostatistical methods.
We used a preexisting, manually extracted, adult ECMO dataset established to study anticoagulation practices and ECMO complications [3]. The dataset was first cleaned. Data were condensed to one row per patient. The mean and range were used to create new variables from continuous variables. Categorical variables were encoded as binary variables using one-hot encoding. Missingness was handled by first dropping variables’ missing values for all patients. Some missing data were recovered by reviewing the electronic health record. Seven variables were dropped to limit the potential of reverse causation artificially enhancing outcome prediction. Remaining variables still missing values (thromboelastography, anti-factor Xa levels) were dropped. Hemorrhage was defined as bleeding during ECMO requiring a transfusion and/or intervention, thrombosis as deep vein thrombosis, pulmonary embolism, ischemic stroke during or following ECMO, or ECMO circuitry change.
The study cohort included 44 consecutive patients supported with ECMO. The average age was 42 years; 66% were men. The most common indication for ECMO was acute respiratory distress syndrome (59%), and 66% were supported with veno-venous ECMO. There were a total of 19 hemorrhage events, most commonly cannulation site bleeding (42%), and 16 thrombotic events, most commonly deep vein thrombosis (81%).
We compared chi-square to five supervised classification and regression machine learning models: random forest, recursive feature elimination, decision trees, k-nearest neighbors and logistic regression. Leave-one-out cross-validation maximized the training cohort size, which allowed each patient to be used to train and test the models to minimize sample bias [4]. The models to predict hemorrhage performed better (accuracy of 58–80%) than the models for thrombosis (40–64%) (Fig. 1).
Fig. 1.
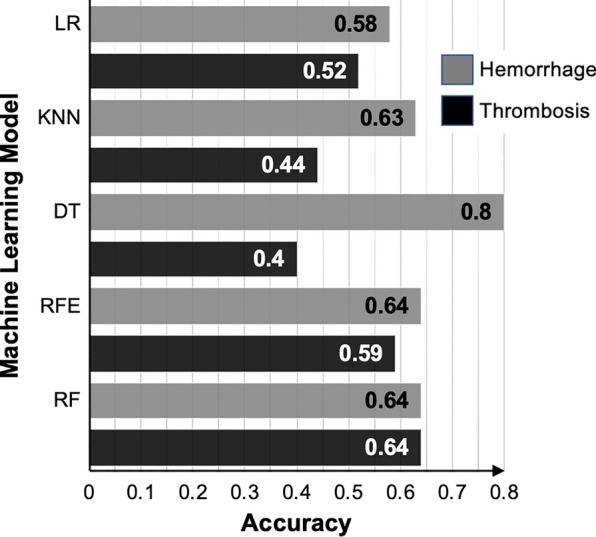
Performance of machine learning models. DT decision trees, kNN k-nearest neighbor, LR logistic regression, RF random forest, RFE recursive feature elimination
An ablation analysis ranked variables by importance to the model’s performance [5]. The rank lists for the random forest model differed from that of the chi-square model (Table 1). As expected, anticoagulation monitoring assays were most important in the chi-square model and the rank lists were identical for both outcomes. For the random forest model, the variables were more varied and included ECMO indications, cannulation strategies and duration. Rank lists for the random forest model differed between the two outcomes and could not be anticipated based on clinical intuition alone (e.g., race, body mass index, indication). These observations demonstrate an advantage of machine learning in its capacity to measure the correlations between combinations of variables and the outcome rather than correlation between the variable and outcome alone.
Table 1.
Ten most important variables for model to predict outcomes
| Random forest model* | Chi-square model |
|---|---|
| Hemorrhage | |
| Heparin drip rate—maximum dosage | Heparin drip rate—maximum dosage |
| Heparin drip rate—mean dosage | Heparin drip rate—mean dosage |
| PTT—lowest value | Heparin drip rate—minimum dosage |
| Activated clotting time—highest value | PTT—highest value |
| Platelet count—highest value | PTT—mean value |
| Race | PTT—lowest value |
| ECMO configuration | INR—highest value |
| ECMO—double-lumen cannulation | INR—mean value |
| Drainage cannula size | INR—lowest value |
| Drainage cannula site | Activated clotting time—highest value |
| Thrombosis | |
| ECMO—double-lumen cannulation | Heparin drip rate—maximum dosage |
| Platelet—lowest value | Heparin drip rate—mean dosage |
| Transfusion of cryoglobulin | Heparin drip rate—minimum dosage |
| Transfusion of platelets | PTT—highest value |
| Body mass index | PTT—mean value |
| Renal replacement therapy | PTT—lowest value |
| ECMO—duration | INR—highest value |
| ECMO indication—status asthmaticus | INR—mean value |
| ECMO indication—PH/right ventricular failure | INR—lowest value |
| Platelet count—mean value | Activated clotting time—highest value |
ECMO extracorporeal membrane oxygenation, PH pulmonary hypertension, PTT partial thromboplastin time, INR international normalized ratio
*p > 0.05, none of the individual features significantly contributed to the model’s performance
This is the first time machine learning has been applied to predict ECMO complications. The decision tree model predicted hemorrhage with promising accuracy despite the small sample size. A larger dataset would allow the use of deep learning models to potentially improve performance and validate our current models. Similar analyses using traditional biostatistical methods are infeasible. Machine learning provides an unbiased, robust and automated approach to handle and process the volume and variety of data generated by the provision of ECMO in order to elucidate factors that contribute to ECMO complications.
Acknowledgements
The authors would like to thank Cynthia Devers for her contribution to this study.
Authors’ contributions
A.A and C.E.V wrote the IRB protocol. A.A., N.S., C.E. and C.E.V designed the study. A.A and Y.K conducted the data entry and cleaning. A.A., Y.K., C.L., C.E. and C.E.V conducted the data analysis and interpretation. A.A., C.E., and C.E.V drafted the manuscript, and all authors contributed to revisions of the manuscript and approved the final draft. All authors read and approved the final manuscript.
Funding
This study was supported by HL134625 (A.A.) and HL141268 (C.E.V.).
Availability of data and materials
Please contact the corresponding author to request the data.
Ethics approval and consent to participate
The study was approved by our Institutional Review Board (IRB #413818). The study includes deidentified data; the IRB issued a waiver of informed consent (45 CFR 46.116).
Consent for publication
Yes.
Competing interests
Dr. Ventetuolo reports serving as a prior consultant for Acceleron Pharma and Maquet Cardiovascular and grants to her institution from United Therapeutics and Eiger for the conduct of research and a clinical trial, respectively. The remaining authors have no competing interests to disclose.
Footnotes
Publisher's Note
Springer Nature remains neutral with regard to jurisdictional claims in published maps and institutional affiliations.
Reference
- 1.Combes A, Hajage D, Capellier G, Demoule A, Lavoue S, Guervilly C, et al. Extracorporeal membrane oxygenation for severe acute respiratory distress syndrome. N Engl J Med. 2018;378(21):1965–1975. doi: 10.1056/NEJMoa1800385. [DOI] [PubMed] [Google Scholar]
- 2.Annich GM. Extracorporeal life support: the precarious balance of hemostasis. J Thromb Haemost. 2015;13 Suppl 1:S336–S342. doi: 10.1111/jth.12963. [DOI] [PubMed] [Google Scholar]
- 3.Chu DC, Abu-Samra AG, Baird GL, Devers C, Sweeney J, Levy MM, et al. Quantitative measurement of heparin in comparison with conventional anticoagulation monitoring and the risk of thrombotic events in adults on extracorporeal membrane oxygenation. Intensive Care Med. 2015;41(2):369–370. doi: 10.1007/s00134-014-3574-3. [DOI] [PMC free article] [PubMed] [Google Scholar]
- 4.Molinaro AM, Simon R, Pfeiffer RM. Prediction error estimation: a comparison of resampling methods. Bioinformatics. 2005;21(15):3301–3307. doi: 10.1093/bioinformatics/bti499. [DOI] [PubMed] [Google Scholar]
- 5.Fawcett C, Hoos HH. Analysing differences between algorithm configurations through ablation. J Heuristics. 2013;22:431–458. doi: 10.1007/s10732-014-9275-9. [DOI] [Google Scholar]
Associated Data
This section collects any data citations, data availability statements, or supplementary materials included in this article.
Data Availability Statement
Please contact the corresponding author to request the data.