Abstract
Hypoxia plays an important role in the genesis and progression of renal fibrosis. The underlying mechanisms, however, have not been sufficiently elucidated. We examined the role of p53 in hypoxia-induced renal fibrosis in cell culture (human and rat renal tubular epithelial cells) and a mouse unilateral ureteral obstruction (UUO) model. Cell cycle of tubular cells was determined by flow cytometry, and the expression of profibrogenic factors was determined by RT-PCR, immunohistochemistry, and western blotting. Chromatin immunoprecipitation and luciferase reporter experiments were performed to explore the effect of HIF-1α on p53 expression. We showed that, in hypoxic tubular cells, p53 upregulation suppressed the expression of CDK1 and cyclins B1 and D1, leading to cell cycle (G2/M) arrest (or delay) and higher expression of TGF-β, CTGF, collagens, and fibronectin. p53 suppression by siRNA or by a specific p53 inhibitor (PIF-α) triggered opposite effects preventing the G2/M arrest and profibrotic changes. In vivo experiments in the UUO model revealed similar antifibrotic results following intraperitoneal administration of PIF-α (2.2 mg/kg). Using gain-of-function, loss-of-function, and luciferase assays, we further identified an HRE3 region on the p53 promoter as the HIF-1α-binding site. The HIF-1α–HRE3 binding resulted in a sharp transcriptional activation of p53. Collectively, we show the presence of a hypoxia-activated, p53-responsive profibrogenic pathway in the kidney. During hypoxia, p53 upregulation induced by HIF-1α suppresses cell cycle progression, leading to the accumulation of G2/M cells, and activates profibrotic TGF-β and CTGF-mediated signaling pathways, causing extracellular matrix production and renal fibrosis.
Keywords: renal tubulointerstitial fibrosis, hypoxia, cell cycle (G2/M) arrest, p53, HIF-1α, TGF-β
Introduction
Hypoxia is a known contributor to kidney injury, leading to progressive loss of kidney function (Nangaku, 2006). In chronic kidney disease (CKD), rarefication of peritubular microvessels occurs almost universally regardless of initial causes of kidney disease, leading to a state of the sustained tissue, especially tubulointerstitial, hypoxia (Mimura and Nangaku, 2010). We previously have shown that hypoxia can induce HIF-1α-mediated Twist upregulation which plays a key role in the epithelial-mesenchymal transition (EMT) during renal fibrogenesis (Sun et al., 2009; Liu, 2011; LeBleu et al., 2013). Studies by others have also shown that in mild (sub-lethal) acute renal injury, the surviving tubular cells can undergo proliferation and restore tubular functions through a normal repair process. When injury is severe (lethal) or recurrent and less severe (sub-lethal), the repair process can become maladaptive, in which the proliferating tubular cells are aberrantly deterred in the G2/M phase of the cell cycle (Canaud and Bonventre, 2015). The G2/M deterrence is, in essence, a cell cycle delay rather than ‘arrest’. We use ‘arrest’ here in keeping with other existing publications on this aberration (Obacz et al., 2013). These G2/M-arrested cells generate profibrotic cytokines, including TGF-β and CTGF, contributing to fibrogenesis (Bechtel et al., 2010; Wynn, 2010; Baumann, 2014). The role of hypoxia in the genesis of G2/M arrest in non-cancer cells and tissues has not been adequately investigated.
G2/M phase (mitosis-induced transition point) is one of the two major cell cycle checkpoints (the second one being G1/S phase, DNA synthesis initiation point). p53 is the key regulator of cell cycle arrest in response to a variety of noxious insults (Li et al., 2012). p53 accomplishes its task by regulating several key cell cycle proteins, including cyclins, cell cycle-dependent kinases (CDKs) and CDK inhibitors (Chang and Ferrell, 2013; Baumann, 2014). In the presence of hypoxia, HIF-1α is activated; jointly, HIF-1α and p53 regulate the expression of several key genes involved in cell cycle control (Obacz et al., 2013). Cross-talk between HIF-1α and p53 has also been reported by several independent research groups, mostly in cancer cells, reviewed in detail in Sermeus and Michiels (2011) and Zhou et al. (2015). Specifically, hypoxia has been shown to induce p53 protein accumulation (Graeber et al., 1994; Hammond et al., 2002) as well as to reduce p53 degradation (Zhang and Hill, 2004; Hubert et al., 2006). Hypoxia, when prolonged and severe, can induce HIF-1α-mediated p53 stabilization and triggers p53-dependent apoptosis (An et al., 1998). In lysophosphatidic acid (LPA)-stimulated colon cancer cell lines, p53 competes with Kruppel-like factor 5 (an effector of LPA-induced proliferation of colon cancer cells) for HIF-1α binding (Lee et al., 2013). Other studies, however, have not shown apparent hypoxia-induced effects of p53 in cancer cells in vitro (Wouters et al., 2009). The varying results could be related to a number of factors, including a varying state of HIF-1α phosphorylation, various cancer cells/cell lines used, and the severity of induced injury. Taken together, the interplay between HIF-1α and p53 is complex and can vary depending on experimental conditions and cell types (Obacz et al., 2013). Most studies thus far have been carried out in the setting of cancer growth and metastasis.
In this study, we show that hypoxia in renal tubular cells can induce G2/M arrest through HIF-1α-mediated p53 upregulation that alters the downstream expression of genes involved in the cell cycle progression (cyclins and CDK1). G2/M-arrested renal tubular cells generate TGF-β and CTGF, which stimulate fibrogenesis including production and accumulation of extracellular matrix proteins. Moreover, we identified an HRE3 region of the p53 promoter that directly interacts with HIF-1α, inducing transcriptional activation of p53 expression. In the UUO mice, administration of the p53 inhibitor PIF-α (Rocha et al., 2003) prevented G2/M arrest and renal fibrosis.
Results
Hypoxia induces G2/M phase arrest in renal tubular epithelial cells
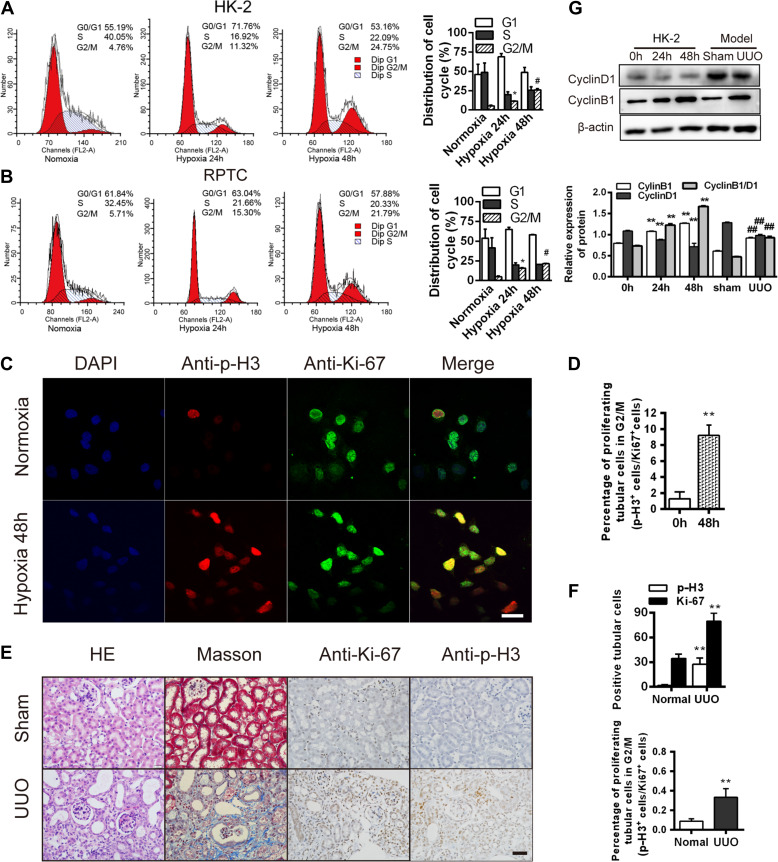
To investigate the effects of hypoxia on cell cycle progression in renal tubular cells, we quantified the percentages of cells in the different cell cycle stages during hypoxia, using two established human and rat renal tubular epithelial cell lines, HK-2 (Sun et al., 2009) and RPTC (Li et al., 2010). Hypoxia (24 and 48 h) significantly increased the proportion of the G2/M cells (Figure 1A). Accordingly, compared with cells under normoxia, the G2/M marker p-H3 (phosphorylated histone H3 at Ser10; Crosio et al., 2002), was disproportionately elevated over the proliferation marker, Ki-67 (Yu et al., 1992) after 48 h of hypoxia (P < 0.05, Figure 1B–D). We also examined these effects in vivo in a mouse unilateral ureteral obstruction (UUO) model (Chevalier et al., 2009; Ucero et al., 2014). Prior studies have shown that obstructed kidneys in UUO mice exhibit markedly elevated adenosine and HIF-1α expression, key molecules upregulated during ischemic hypoxia (Eltzschig et al., 2004; Fredholm, 2007; Higgins et al., 2007, 2008), consistent with the presence of hypoxia in this model. We found a markedly elevated p-H3/Ki-67 ratio in the UUO kidneys, compared with control kidneys (P < 0.05, Figure 1E and F), consistent with the presence of G2/M arrest. Accordingly, the ratio of cyclin B1/D1 was also elevated in both the hypoxic HK-2 and RPTC cells and the UUO kidneys (P < 0.05, Figure 1G). These results are consistent with the induction of the G2/M arrest in renal tubules during hypoxia.
Figure 1.
Hypoxia induces G2/M phase arrest in renal tubular epithelial cells. (A and B) Cell cycle analyses in HK-2 (A) and RPTC (B) at baseline and after hypoxia. Changes in the cell cycle phase percentages are shown (right). (C) Co-staining for p-H3 (red) and Ki-67 (green) in HK-2 cells under hypoxia for 48 h. Scale bar, 10 μm. (D) The p-H3/Ki-67 ratio in the HK-2 cells in C. **P < 0.001 vs. cells under normoxia. (E) HE staining and immunohistochemistry for p-H3 and Ki-67 in sham and UUO kidneys after 14 days. Masson’s trichrome staining shows fibrosis (blue). Magnification, 400×. Scale bar, 50 μm. (F) Numbers (per 400× field) of Ki-67- or p-H3-positive cells (top) and percentages of proliferating cells in G2/M phase (p-H3+ cells/Ki-67+ cells, bottom) in sham and UUO kidneys after 14 days. **P < 0.01. (G) Cyclin D1 and cyclin B1 protein levels in normoxic or hypoxic (24 and 48 h) HK-2 cells and in sham and UUO kidneys 14 days after surgery. **P < 0.001 vs. 0 h. ##P < 0.001 vs. sham. n = 3 in A and B; n = 3 mice/group in E–G. Data are presented as mean ± SEM.
Hypoxia and hypoxia-induced G2/M arrest are associated with fibrogenesis
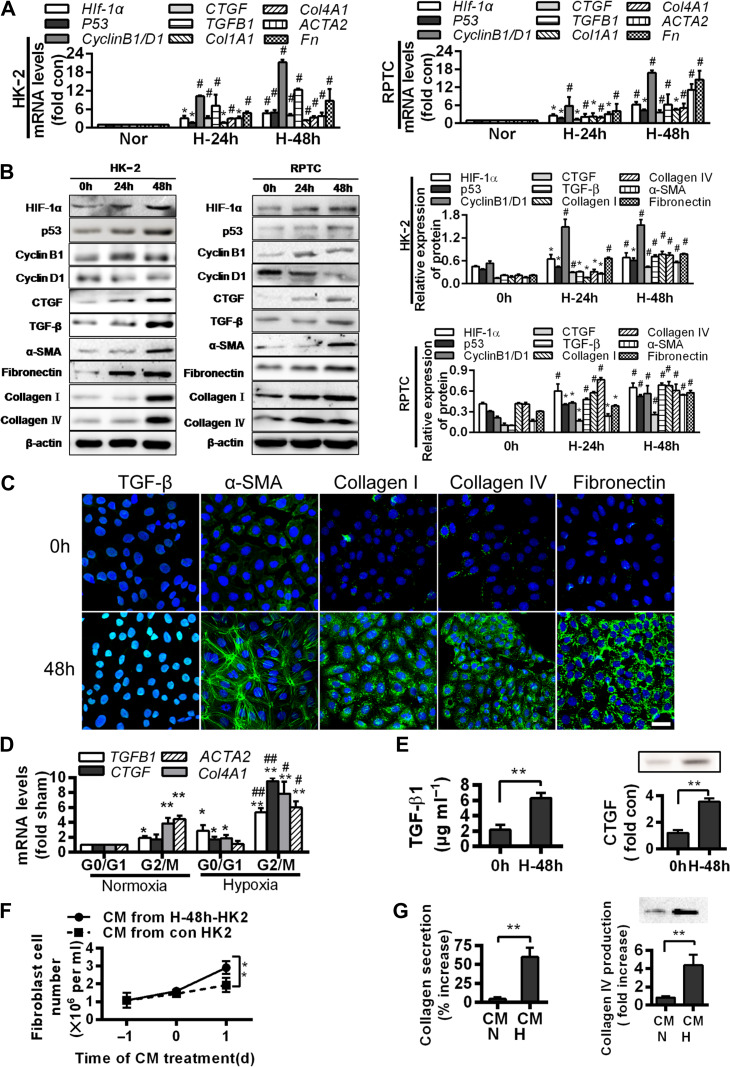
To explore whether hypoxia and hypoxia-induced G2/M arrest in renal tubules can be associated with fibrogenesis, we examined the effects of hypoxia (48 h) on the expressions of fibrosis-related genes, including Hif-1α, p53, TGFB1, CTGF, Col1A1, Col4A1, ACTA2, and Fn, and proteins, including HIF-1α, p53, TGF-β, CTGF, collagen I, collagen IV, α-smooth muscle actin (α-SMA), and fibronectin, in HK-2 and RPTC cells. Compared with their normoxic counterparts, hypoxia triggered a dramatic increase in their expressions (P < 0.05, Figure 2A–C).
Figure 2.
G2/M arrest during hypoxia induces the production of profibrogenic factors and extracellular matrix proteins. (A) Quantitative RT-PCR analyses for mRNA levels of the indicated genes in normoxic or hypoxic (24 and 48 h) HK-2 (left) and RPTC (right) cells. *P < 0.05, #P < 0.001 vs. normoxic cells. (B) Western blotting analyses for protein levels of the indicated proteins in normoxic or hypoxic (24 and 48 h) HK-2 and RPTC cells. Representative blots are shown (left) and histograms show the relative protein levels normalized to the loading control β-actin (right). (C) Immunofluorescence analyses of TGF-β, α-SMA, collagen I, collagen IV, and fibronectin expressions (green) and DIPA (blue) in HK-2 before and after 48 h hypoxia. Scale bar, 10 μm. (D) mRNA levels of profibrogenic factors in normoxic and hypoxic HK-2 cells in various cell cycle phases. *P < 0.05, **P < 0.01 vs. normoxia in G0/G1; #P < 0.05, ##P < 0.01 vs. normoxia in G2/M. (E) TGF-β1 production (left) and CTGF protein level (right) increase in the supernatant of HK-2 under hypoxia for 48 h. **P < 0.01 vs. 0 h. (F and G) Effects of conditioned media (CM) from normoxic or hypoxic HK-2 on the proliferation of NIH3T3 fibroblasts (F) and productions of collagen I (G, left) and collagen IV (G, right) in fibroblasts. **P < 0.01. Data are presented as mean ± SEM from at least three experiments.
We further isolated the HK-2 and RPTC cells in G0/G1 and G2/M phases using Hoechst staining and fluorescence-activated cell sorting. Cellular TGFB1 and CTGF mRNA levels were highly elevated G2/M cells than in the G0/G1 cells in both normoxic and hypoxic conditions (P < 0.05). Likewise, Col4A1 and ACTA2 expressions were higher in the G2/M cells than in the G0/G1 cells (P < 0.05, Figure 2D). As TGF-β and CTGF are powerful profibrotic molecules, these findings are consistent with G2/M arrest in the induction of fibrogenesis.
We further examined the protein contents of TGF-β1 and CTGF in the supernatants (conditioned media) of the hypoxic HK-2 cells to evaluate any paracrine effects that might be generated by the hypoxic cells. We found that both TGF-β1 and CTGF were robustly enriched (P < 0.05; Figure 2E) in the media. When applied to the NIH3T3 fibroblasts, the conditioned media stimulated proliferation and the secretion of collagens (P < 0.05, n = 3, Figures 2F and G).
p53 is critical for hypoxia-induced cell cycle G2/M arrest and fibrogenesis
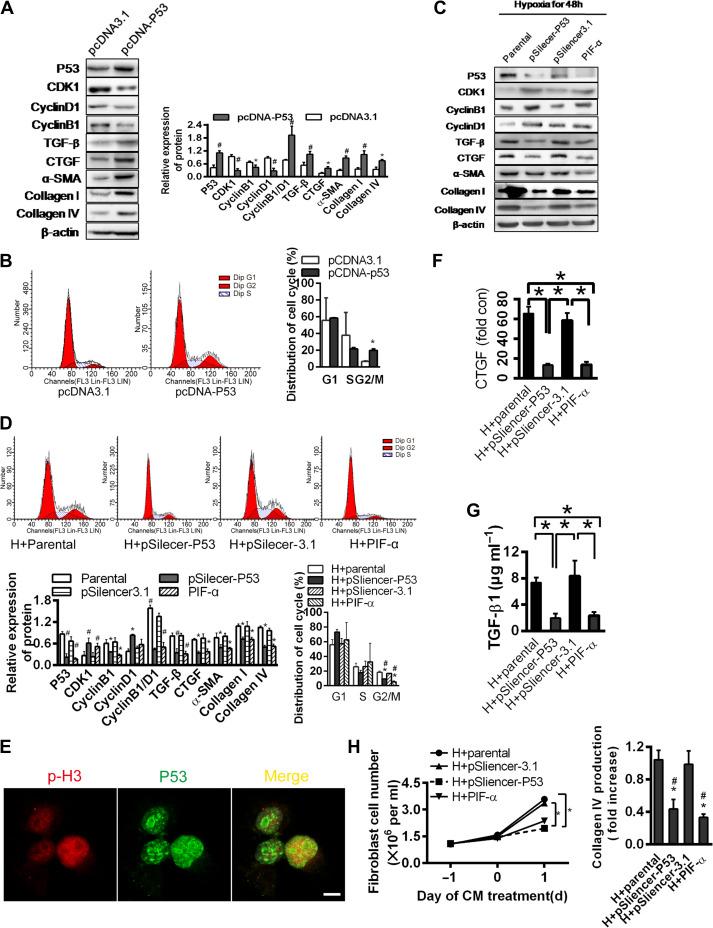
To examine the role of p53 in G2/M arrest and fibrogenesis, we overexpressed p53 in the HK-2 cells. The overexpression resulted in a reduced expression of CDK1 and cyclin B1 (low B1/D1 ratio), TGF-β, CTGF, α-SMA, collagen I, and collagen IV (P < 0.05, Figure 3A). The proportion of cells in the G2/M phase was significantly increased, consistent with a p53-driven G2/M arrest and fibrogenesis (Figure 3B).
Figure 3.
p53 is critical for hypoxia-induced G2/M phase arrest in renal tubular epithelial cells. (A) Western blotting analyses for protein levels in p53 overexpression plasmid or control vector-transfected HK-2 cells under normoxia (left). The histogram shows relative levels normalized to β-actin (top right). (B) Cell cycle distributions in p53 overexpression plasmid or control vector-transfected cells. Changes in the percentage of proliferating cells in G2/M phase are shown (right). *P < 0.05. (C and D) HK-2 cells transfected with pSilencer3.1 empty vector or pSilencer-p53 or treated with PIF-α were cultured under hypoxic condition for 48 h. Protein levels were determined by western blotting analysis (C) and normalized to β-actin (D, bottom left). Cell cycle distribution was determined by flow cytometry (D, top). Changes in the percentage of proliferating cells in G2/M are shown (D, bottom right). *P < 0.05 vs. parental cells; #P < 0.05 vs. empty vector-transfected cells. Data are presented as mean ± SEM from three independent experiments. (E) Co-localization of p-H3 and p53 in HK-2 cultured under hypoxia for 48 h. Scale bar, 10 μm. (F and G) Changes in CTGF protein (F) and TGF-β concentration (G) in the supernatant of HK-2 transfected with pSilencer3.1 empty vector or pSilencer-p53 or treated with PIF-α under hypoxia for 48 h. *P < 0.05. (H) Effects of CM from hypoxic HK-2 transfected with pSilencer3.1 empty vector or pSilencer-p53 or treated with PIF-α on the proliferation of NIH3T3 fibroblasts (left) and production of collagen IV (right). *P < 0.05 vs. hypoxic parental CM, #P < 0.05 vs. empty vector-transfected cell CM. Data are presented as mean ± SEM from three independent experiments.
To examine the effects of p53 during hypoxia, we eliminated p53 in the HK-2 cells by either siRNA technique or a p53 blocker, PIF-α. When p53 was eliminated, hypoxia failed to suppress CDK1, failed to alter the expression ratio of cyclin D1/B1 and was unable to elevate the expressions of TGF-β, CTGF, α-SMA, collagen I, and collagen IV (Figure 3C). Accordingly, the proportion of the G2/M cells was lower (P < 0.05, Figure 3D). p53 and p-H3 were co-localized in the HK-2 cells (Figure 3E), consistent with cell cycle arrest promoted by p53 during hypoxia.
Paracrine effects were also demonstrated by applying conditioned media of the hypoxic HK-2 cells pretreated with PIF-α or p53 silenced with siRNA onto the NIH3T3 cells. Conditioned media without p53 signal failed to induce TGF-β1 and CTGF, when compared with the effects of media from control and pSilencer3.1 empty vector-transfected cells (P < 0.05, Figure 3F and G). Corresponding changes in the collagen production by the NIH3T3 cells were notably significant (Figure 3H). Taken together, these data point to a key role of p53 in hypoxia-induced G2/M arrest and tubular fibrogenesis.
HIF-1α, through direct binding to the HRE3 region of the p53 promoter, transcriptionally upregulates p53 expression
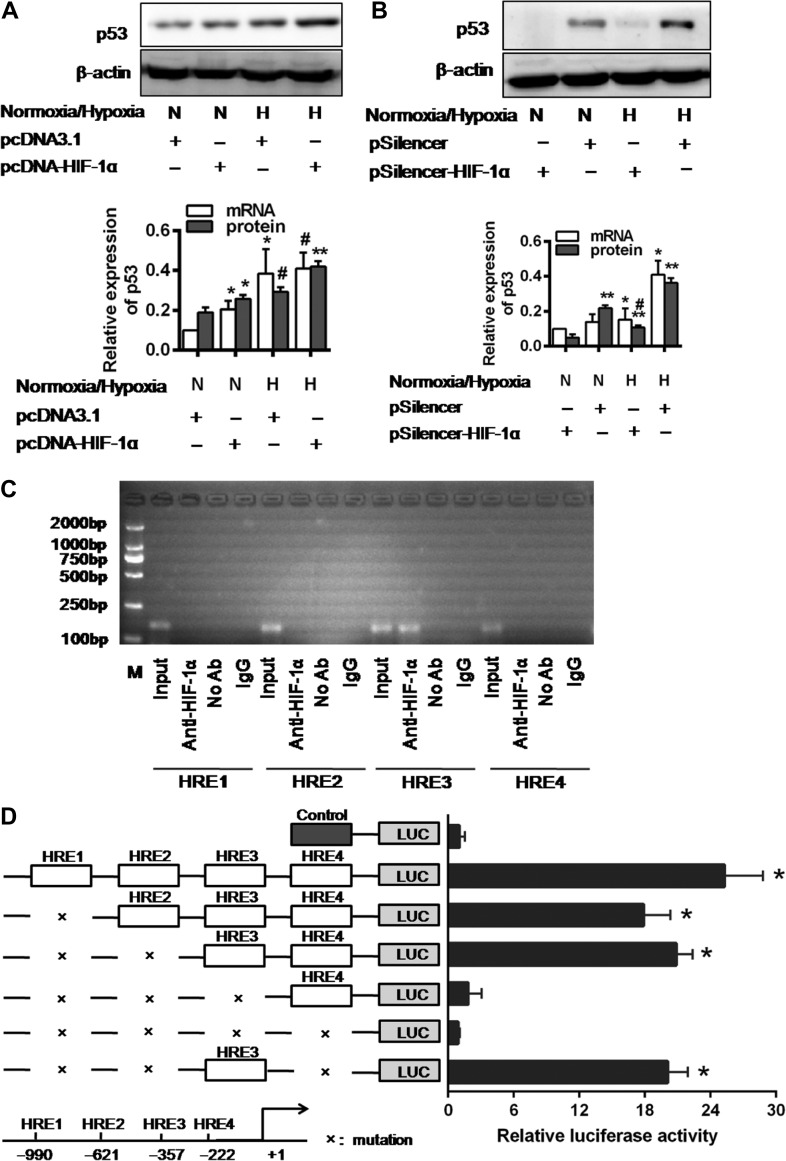
To determine whether HIF-1α is involved in the p53 upregulation in renal tubular cells, we employed gain-of-function and loss-of-function assays. HIF-1α transfection in the hypoxic HK-2 cells resulted in higher levels of p53 mRNA and protein expression than the levels in cells with HIF-1α transfection or hypoxia alone (Figure 4A). The HIF-1α silencing by siRNA effectively prevented hypoxia-induced p53 protein expression (Figure 4B).
Figure 4.
The expression and transcriptional activation of p53 were directly induced by HIF-1α. (A and B) p53 expression in pcDNA3.1 empty vector or pcDNA3.1-HIF-1α-transfected cells (A) and pSilencer3.1 empty vector or HIF-1α-siRNA-transfected cells (B) under normoxic or hypoxic conditions for 48 h. Histograms show relative levels normalized to the loading control β-actin. #P < 0.01, *P < 0.05, **P < 0.001 compared with the pcDNA3.1 empty vector and pSilencer3.1 empty vector-transfected cells, respectively (n = 3). (C) ChIP analysis of HIF-1α binding to the p53 promoter in HK-2 cells under hypoxic condition. The reaction controls include immunoprecipitations performed using a nonspecific IgG monoclonal antibody (IgG). PCR was performed using whole-cell genomic DNA (Input). The data are representative of three independent experiments. (D) Luciferase activity of the p53 promoter reporter gene. HK-2 cells were transfected with 20 ng reporter constructs and 1 mg pcDNA3.1-HIF-1α in combination with 0.2 ng pRL-TK vector and incubated for 24 h. The luciferase activities are reported as relative light units of firefly luciferase activity normalized to Renilla luciferase activity. Data shown are mean of three independent experiments. *P < 0.01 compared with control.
We further explored the effect of HIF-1α on p53 transcription. We first identified four sites of shared homology between p53 promotor and HIF-1α consensus binding sequence BDCGTV (B = C/T/G, D = A/G/T, V = G/C/A) using in silico analysis (Sun et al., 2009). HK-2 cells were transiently cotransfected with wild-type p53 promoter vector (from −1256 to +145 base pairs), a mutant vector or the pGL3-basic vector and HIF-1α. Luciferase activity was increased by 6.4 ± 1.89-fold in the HK-2 cells transfected with the p53 wild-type promoter vector (P < 0.01). Each HRE region was further investigated for its influence on p53 transcriptional activation. In contrast to a sharp reduction in luciferase activity when transfected with HRE3 mutant, the reporter vectors, containing mutations in the HRE1, HRE2, and/or HRE4 regions of the p53 promoter, elicited minimal changes in luciferase activity (Figure 4D). These results indicate that the HRE3 region contains the critical binding site for HIF-1α that determines HIF-1α-mediated p53 transcriptional activation.
These findings were further confirmed by a series of chromatin immunoprecipitation (ChIP) assays. The ChIP analyses of nuclei derived from HK-2 cells showed a dominant band of 204 base pairs containing the third potential binding site (−357 to −352) under hypoxia. No band was observed for the other sites and the control (Figure 4C). These results indicate the presence of a direct binding of HIF-1α and p53 promoter at the proximal HER3 (−357 to −352 region) that upregulates p53 transcription.
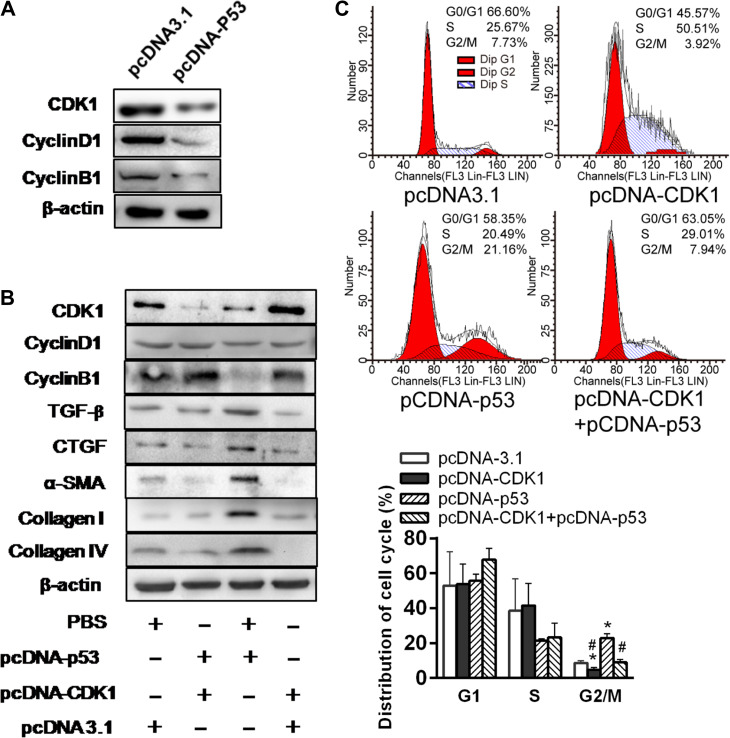
To elucidate the relation between p53 and CDK1 and cyclin B1/D1, we overexpressed p53 in the HK cells. p53 overexpression effectively suppressed CDK1 and ratio of cyclin D1/B1 (Figure 5A). Further, CDK1 overexpression in HK-2 cells could partially prevent the increases in TGF-β and CTGF and downstream effects on α-SMA, collagen I, and collagen IV (Figure 5B). Moreover, CDK1 overexpression in HK-2 cells reduced the proportion of the cells in G2/M phase, and the G2/M arrest was pronounced with p53 overexpression (Figure 5C). These results are consistent with a p53-induced G2/M arrest through modulating CDK1 pathway, contributing to tubular fibrogenesis.
Figure 5.
p53 suppresses expression of CDK1 and profibrotic proteins in HK-2 cells. (A) Western blotting analyses of CDK1, Cyclin D1, and Cyclin B1 expression in p53 overexpression plasmid or control vector-treated HK-2 cells under normoxia. (B) Western blotting analysis of protein expression in p53 and/or CDK1 overexpression plasmid-treated HK-2 cells under normoxia. Blots shown are representative of three independent experiments. (C) Cell cycle distribution in HK-2 cells transfected with pcDNA3.1 empty vector, pcDNA-CKD1, or/and pcDNA-p53 under normoxia was analyzed by flow cytometry (left). Changes in the percentage of proliferating cells in G2/M phase are shown (right).*P < 0.05 vs. empty vector-transfected cells; #P < 0.05 vs. pcDNA-p53-transfected cells.
p53 inhibition prevents G2/M arrest and fibrogenesis in UUO mice
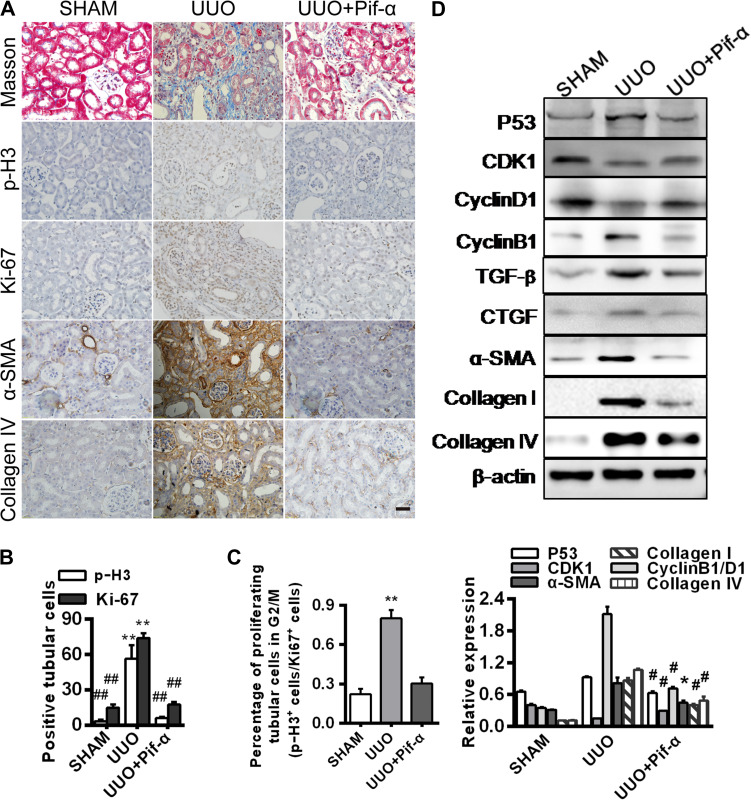
To verify the results generated from cell cultures, we examined the role of p53 in the G2/M arrest and fibrogenesis in vivo in the UUO mice (Higgins et al., 2007; Chevalier et al., 2009; Ucero et al., 2014). The p53 inhibitor PIF-α was intraperitoneally injected to the mice and the controls were injected with PBS. PIF-α administration markedly reduced positive p-H3 and Ki-67 staining and the p-H3/Ki-67 ratio, consistent with a diminution of G2/M arrest (Figure 6A–C). The profibrotic proteins and tubulointerstitial fibrosis were accordingly diminished with PIF-α administration in the UUO kidneys (Figure 6D).
Figure 6.
p53 inhibitor prevents hypoxia-induced G2/M arrest and fibrogenesis in vivo. Mouse kidneys were collected 14 days after surgery from three groups: sham, UUO, and UUO with PIF-α treatment on Days 3 and 10. (A) Immunohistochemistry for p-H3, Ki-67, α-SMA, and collagen IV expression. Masson’s trichrome staining shows fibrosis with blue color. Magnification, 400×. Scale bar, 50 μm. (B) Numbers (per 400× field) of Ki-67- or p-H3-positive cells (n = 3 mice in each group). **P < 0.01 vs. sham, ##P < 0.01 vs. UUO. (C) Percentage of proliferating cells in G2/M phase (p-H3+cells/Ki-67+cells). **P < 0.01 vs. sham. (D) Western blotting analyses of p53, CDK1, Cyclin D1, Cyclin B1, TGF-β, CTGF, α-SMA, collagen I, and collagen IV expression (top). The histogram shows relative levels normalized to β-actin (bottom). *P < 0.05, #P < 0.001 vs. sham. Error bars represent SD.
Discussion
In this study, we show a critical role of p53 in the genesis of cell cycle G2/M arrest and renal fibrosis during hypoxia in vitro and in vivo. Specifically, during hypoxia, p53 expression in renal tubular cells is transcriptionally upregulated by HIF-1α through a direct HIF-1α–HRE3 interaction, and the p53-driven G2/M arrest triggers activation of profibrogenic signaling molecules including TGF-β and CTGF, resulting in tubulointerstitial fibrosis.
p53 is critical to cell cycle regulation (Price et al., 2009), especially in the maintenance of the G2/M checkpoint (Morgan, 1997). During hypoxia, p53 induced G2/M arrest in the renal tubular cells is demonstrated in this study by (i) an increase in the percentage of G2/M cells with enhanced p-H3 expression and (ii) a concurrent downregulation of CDK1 and cyclin D1/B1 mRNA and protein expressions. Fibrogenesis was evidenced by the upregulation of profibrogenic factors and extracellular matrix protein expression, including TGF-β1, CTGF, α-SMA, collagen I, collagen IV, and fibronectin in the hypoxic HK-2 and RTPC cells, consistent with the prior report of profibrogenic phenotype of the G2/M-arrested renal tubular cells (Yang et al., 2010).
These results were further supported by the results from experiments with siRNA induced p53 silencing in cultured renal tubular cells and with p53 inhibitor (PIF-α) treatment of UUO mice. The hypoxia-induced cell cycle arrest and fibrogenic effects were blunted as p53 was silenced or blocked. Thus, both the cell culture and UUO mice experiments indicate that hypoxia-induced kidney fibrogenesis occurs in a p53-responsive manner.
We also explored the role of HIF-1α, a well-known master regulator of cellular adaptation to hypoxia (Baba et al., 2010; Semenza, 2011), in the hypoxia associated p53 elevation. HIF-1α clearly induced p53 upregulation and downstream profibrotic effects. Moreover, hypoxia upregulated p53 mRNA and protein expressions when HIF-1α was overexpressed; HIF-1α knockdown resulted in an opposite effect. Further ChIP and luciferase reporter experiments uncovered a direct binding site between a p53 promoter region (HRE3 −357 to −352) and Hif-1α that is capable of upregulating the p53 transcription and is responsive to hypoxia. Consistently, in vivo p53 inhibition by PIF-α in UUO mice prevented both G2/M arrest and the attendant profibrotic effects. We interpret these results as that hypoxia induces p53 upregulation through HIF-1α that deters the cell cycle progression (the G2/M arrest) which modifies the tubular cell phenotype, leading to fibrogenesis.
There are several limitations of this study that cannot be overlooked. First, although it is known that fibrotic CKD kidneys exhibit rarefication of peritubular microvessels signifying hypoxia (Inoue et al., 2011), most of the hypoxia-related studies have been conducted using remnant kidney models (Liu et al., 2017). We chose UUO model for our in vivo experiments because (i) it is a well-established renal fibrosis model (Mack and Yanagita, 2015) and (ii) prior studies have shown upregulations of HIF-1α and adenosine, key markers of tissue hypoxia (Eltzschig et al., 2004; Fredholm, 2007; Higgins et al., 2008), supporting the presence of kidney hypoxia in this model. Although tubular epithelial cells in vivo routinely encounter a plethora of external influences, we noted that the responses to p53 inhibition in this model were remarkably similar to those in cultured renal tubular cells exposed to hypoxia (Figure 6). Given the demonstrated kidney damage and peritubular microvascular rarefication, it appears that UUO is a reasonable model of kidney failure, tissue hypoxia, and fibrosis. Second, our results of elevated HIF-1α expression and its downstream effects, i.e. TGF-β1 activation, seem consistent with the assumption that persistent hypoxia induces renal fibrogenesis. TGF-β1 has been described in detail as a potent inducer of fibrogenesis in renal epithelial cells (Yoshino et al., 2007). That said, tubulointerstitial fibrosis can result from multiple pathways and myofibroblasts may be originated from multiple sources, i.e. epithelial–mesenchymal transition, endothelial–mesenchymal transition, pericytes, fibroblast reprogramming, and recently secretome that modifies local micro-environment to create a fibrogenic environment. To this end, our in vivo data show a clear antifibrotic effect of p53 inhibition which likely exerts its effects not only in the renal tubules but also in the other cellular components of the kidney. Thus, we should not rule out the effects of p53 inhibition on multiple kidney components that might have contributed to the overall antifibrotic outcome. Nonetheless, the combined in vivo and in vitro results of this study do support the existence of hypoxia-triggered and p53-responsive fibrogenic pathway, which could be one of many pathways leading to kidney fibrosis. Third, our results of HIF-1α-induced p53 upregulation and downstream profibrotic TGF-β1 activation provoke concern, as HIF-1α inducers, prolyl hydroxylase inhibitors, are being promoted as a potential treatment option for CKD-related anemia because HIF-1α is known to induce erythropoietin production (Kapitsinou et al., 2010; Gupta and Wish, 2017). Erythropoietin has previously been reported to reduce renal fibrosis in UUO rodents by inhibiting TGF-β1-mediated EMT (Park et al., 2007). We speculate that HIF-1α is likely capable of exerting multiple functions and its net functional outcome might be context dependent. Our results are clearly insufficient to give a full spectrum of HIF-1α functions. Lastly, although in our hands, in vitro and in vivo experiments generated consistent results of hypoxia-induced and HIF-1α-mediated p53 upregulation, yielding fibrogenesis in the kidney, the generalizability of these findings, especially in relation to human CKD, is limited and requires further investigation.
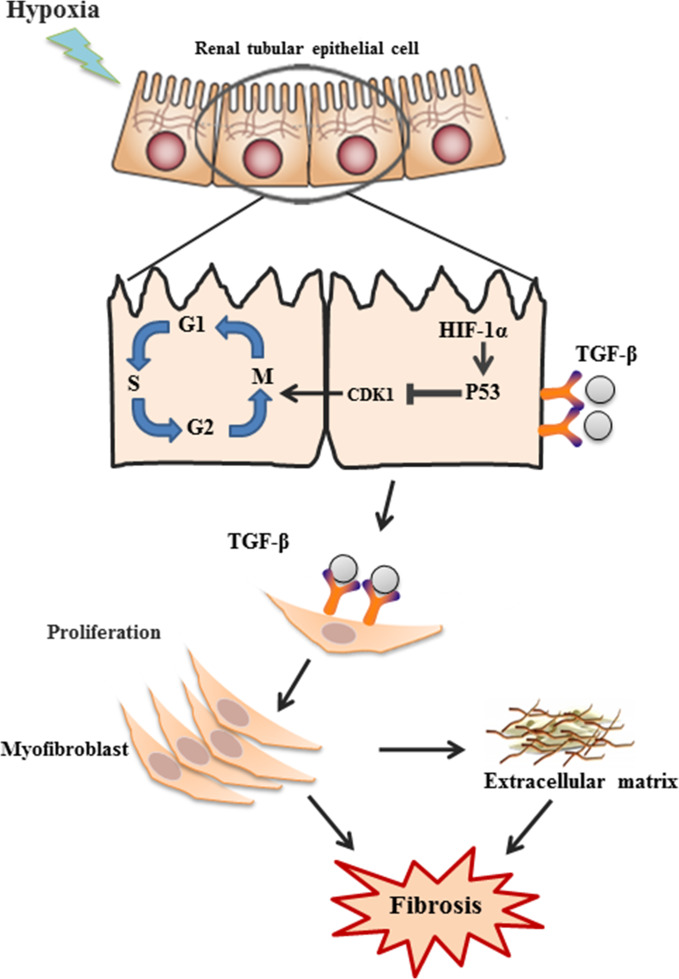
In summary, this study extended the existing body of knowledge by showing the presence of a hypoxia-induced fibrogenic pathway involving HIF-1α/p53/CDK1/TGF-β (Figure 7). The pivotal role of p53 in this process was demonstrated. Given rarefication of peritubular microvessels, hence hypoxia, is a general feature in CKD, and fibrosis is tightly linked to the progressive decline of kidney function, understanding the mechanisms underlying hypoxia-induced fibrosis is of critical importance in potential therapeutic targeting, which could lead to new treatment modalities to halt or retard CKD progression. Although further study is necessary, our data suggest that p53 could be considered a potential target.
Figure 7.
Schematics of hypoxia-induced fibrosis in renal tubular cells. Hypoxia induces G2/M phase arrest through activation of HIF1α–p53–CDK1 pathway, leading to upregulation of TGF-β1 and CTGF and downstream production of α-SMA, collagens, and fibronectin, and eventually renal fibrosis.
Materials and methods
Cell culture and treatment
Human and rat proximal tubular epithelial cell lines, HK-2 (Sun et al., 2009) and RPTC (Li et al., 2010), respectively, and NIH3T3 fibroblast cell line (Cell Bank of the Chinese Academy of Sciences) were cultured in DMEM (Gibco, Invitrogen) supplemented with 10% fetal calf serum (Gibco, Invitrogen) (Peng et al., 2012). The cells were cultured in hypoxic (1% O2, 5% CO2, 37°C) incubator (Precision Scientific) for 0, 24, or 48 h or under normoxic condition (21% O2, 5% CO2, 37°C). When indicated, cells were pretreated with either 100 μM PIF-α or vehicle (48 h). After washing, the cells continued in culture for additional 24 h (Dagher et al., 2012; Kapur et al., 2016).
Animal model
Male and female C57BL/6 J mice (n = 6/group, 48 in total) aged 8–11 weeks and weighing 20–25 g were obtained from the Fourth Military Medical University Laboratory Animal Center. All mouse work was performed in accordance with the animal use protocol approved by the Institutional Animal Care and User Committee of the Fourth Military Medical University.
For UUO model, mice were anesthetized with 5% sodium pentobarbitone (50 mg/kg) injected intraperitoneally. A 1.5-cm left upper quadrant incision was made to ligate the left ureter with silk suture. In the sham-operated mice, the left ureter was not ligated; the other steps were identical (Tang et al., 2015). Mice were injected intraperitoneally with PIF-α (Sigma, 2.2 mg/kg body weight) on Days 3 and 10 post-surgery. The sham groups were injected with the same volume of PBS (PIF-α solvent).
Quantitative RT-PCR
RT-PCR was conducted as previously described (Sun et al., 2009; Du et al., 2014). The primer sequences are listed in Table 1. Relative gene expression levels were determined by normalizing to β-actin using the 2−ΔΔCT method (Livak and Schmittgen, 2001). TGF-β1 and collagen protein concentrations were detected using commercial ELISA kits (Abcam).
Table 1.
Primer sequences
| Gene name | Forward (5′–3′) | Reverse (5′–3′) |
|---|---|---|
| Human Hif-1α | 5′-ACTTGGCAACCTTGGATTGGA-3′ | 5′-GCACCAAGCAGGTCATAGGT-3′ |
| Human p53 | 5′-TGACACGCTTCCCTGGATTG-3′ | 5′-ACCATCGCTATCTGAGCAGC-3′ |
| Human TGFB | 5′-GGGCTACCATGCCAACTTCT-3′ | 5′-GACACAGAGATCCGCAGTCC-3′ |
| Human CTGF | 5′-CACCCGGGTTACCAATGACA-3′ | 5′-TCCGGGACAGTTGTAATGGC-3′ |
| Human Col1A1 | 5′-GCGGACTTTGTTGCTGCTTGCAG-3′ | 5′-ATCTCCGGCTGGGCCCTTTCTT-3′ |
| Human Col4A1 | 5′-CAAGGGCTCGCCGGGTTCTG-3′ | 5′-CCGGTGTCACCACGACTGCC-3′ |
| Human ACTA2 | 5′-ATCACCAACTGGGACGACAT-3′ | 5′-GGCAACACGAAGCTCATTG-3′ |
| Human Fn | 5′-CCCTGGTGTCACAGAGGCTA-3′ | 5′-TGTATATTCGGTTCCCGGTTC-3′ |
| Human β-actin | 5′-TGGCACCCAGCACAATGAA-3′ | 5′-CTAAGTCATAGTCCGCCTAGAAGCA-3′ |
| Rat TGFB | 5′-CAACAATTCCTGGCGTTACCT-3′ | 5′-AAAGCCCTGTATTCCGTCTCC-3′ |
| Rat CTGF | 5′-GGAGAAAACACCCCACCGAA-3′ | 5′-CACACACCCAGCTCTTGCTA-3′ |
| Rat Col1A1 | 5′-GCAATGCTGAATCGTCCCAC-3′ | 5′-CAGCACAGGCCCTCAAAAAC-3′ |
| Rat Col4A1 | 5′-GATGGGCTGTGCAGATAGCA-3′ | 5′-CGGTCTGTGTGGCAACTTCT-3′ |
| Rat ACTA2 | 5′-GGATCAGCGCCTTCAGTTCT-3′ | 5′-GGGCTAGAAGGGTAGCACAT-3′ |
| Rat Fn | 5′-ACGGGAAGACCTACCACGTA-3′ | 5′-CACTGGGGTGTGGATTGACC-3′ |
| Rat β-actin | 5′-GGAGATTACTGCCCTGGCTCCTA-3′ | 5′-GACTCATCGTACTCCTGCTTGCTG-3′ |
Plasmid constructs and transfection and dual-luciferase reporter gene assay
The recombinant sense expression vector for HIF-1α and the siRNA expression vectors for HIF-1α were constructed as described previously (Sun et al., 2009). Human p53 was amplified by PCR using cRNA from hypoxic HK-2 cells and subcloned into the pcDNA3.1 expression vector. The p53 siRNA-specific targeting sequences were cloned into the pSilencer3.1-U6 neo siRNA expression vector (Genechem). A scrambled sequence was used as the control.
For the luciferase reporter experiments, a p53 promoter-driven luciferase reporter vector was constructed by inserting the wild-type sequence (from −1256 to +145 base pairs) or a sequence containing HRE1 mutations (CAAAGC mutated to CACCGC), HRE2 mutations (GGCGTG mutated to GGAATG), HRE3 mutations (CTCGTG mutated to CTAATG), and/or HRE4 mutations (GACGTA mutated to GAAATA a) of the p53 promoter into the pGL3-basic vector (Genechem). pcDNA3.1-HIF-1α and the reporter plasmid were constructed as described previously (Sun et al., 2009). The luciferase activity was quantified using the Dual-Luciferase Reporter Assay System (Promega). The results were expressed as the means of the ratio between the firefly and Renilla luciferase activity.
Immunohistochemistry and immunocytochemistry
Immunohistochemistry was performed using 3- to 5-μm-thick tissue sections mounted onto slides that were dewaxed, rehydrated, permeabilized, and blocked. The slides were incubated with primary antibodies, i.e. anti-HIF-1α (1:500, Chemicon), anti-p53 (1:500, Thermo Fisher Scientific), anti-Ki-67 (1:1000, Abcam), anti-p-H3 (1:1000, Abcam), anti-SMA (1:500, Abcam), anti-COL1A1 (1:40, Sangon Biotech. Co.), anti-COL4A1 (1:40, Sangon Biotech. Co.), and anti-fibronectin (1:600, Abcam), at 4°C overnight. The sections were then incubated with appropriate biotinylated secondary antibodies and visualized. Nonimmune goat IgG or rabbit IgG was used as the control. Immunocytochemistry was performed using an established protocol (Sun et al., 2009; Du et al., 2014).
Western blotting analysis
Western blotting was performed as detailed previously (Sun et al., 2009). Briefly, proteins from cell or kidney lysates were quantified using a BCA protein assay kit (Thermo Fisher Scientific). Then, 60 μg total protein lysates were electrophoresed on 10% SDS-polyacrylamide gels and blotted onto nitrocellulose membranes (Millipore). The membranes were then blocked, washed, and incubated with appropriate primary and secondary antibodies. Enhanced chemiluminescence (ZETA-LIFE) was used for detection.
MTT
The MTT Cell Proliferation Kit was purchased from the Beyotime Institute of Biotechnology. Experiments were carried out according to the manufacture’s recommendation. The absorbance at 540 nm was measured using a microplate reader (Thermo Fisher Scientific).
Flow cytometry and fluorescence-activated cell sorting
Cultured cells were exposed to serum-free medium (1 day) for synchronization. The cells were then harvested, washed in PBS, fixed in 70% ethanol (4°C), and incubated in 1 mg/ml DNase-free RNase A (Sigma-Aldrich) and 50 μg/ml propidium iodide (Sigma-Aldrich) at 37°C for 1 h. The cell cycle distribution was measured using a flow cytometer (BD, FACSCanto). Hoechst 33324 (Sigma, 10 μM) was used to stain live cells, and, through ultraviolet-MoFlo sorting (DakoCytomation High Speed MoFlo Sorter), the cells in G0/G1 or G2/M phase were isolated.
Statistical analysis
Each experiment was repeated at least three times. All statistical analyses were performed using one-way ANOVA with SPSS 19.0. Comparisons between groups were made using a two-tailed unpaired Student’s t-test. P < 0.05 was considered significant.
Acknowledgements
We thank the International Society of Nephrology (ISN) for its support of the Trio-ISN Renal Sister Center, which makes ongoing collaborative work possible. We also thank Dr Zheng Dong, Dr Di Wang, and Mr Gang Wang for providing us the kidney cell lines and technical support.
Funding
This work was supported by the National Natural Science Foundation of China (81670655, 81400699, and 81370789).
Conflict of interest
none declared.
References
- An W.G., Kanekal M., Simon M.C., et al. (1998). Stabilization of wild-type p53 by hypoxia-inducible factor 1α. Nature 392, 405–408. [DOI] [PubMed] [Google Scholar]
- Baba Y., Nosho K., Shima K., et al. (2010). HIF1A overexpression is associated with poor prognosis in a cohort of 731 colorectal cancers. Am. J. Pathol. 176, 2292–2301. [DOI] [PMC free article] [PubMed] [Google Scholar]
- Baumann K. (2014). Cell cycle: forming healthy attachments. Nat. Rev. Mol. Cell Biol. 15, 4. [DOI] [PubMed] [Google Scholar]
- Bechtel W., McGoohan S., Zeisberg E.M., et al. (2010). Methylation determines fibroblast activation and fibrogenesis in the kidney. Nat. Med. 16, 544–550. [DOI] [PMC free article] [PubMed] [Google Scholar]
- Canaud G., and Bonventre J.V. (2015). Cell cycle arrest and the evolution of chronic kidney disease from acute kidney injury. Nephrol. Dial. Transplant. 30, 575–583. [DOI] [PMC free article] [PubMed] [Google Scholar]
- Chang J.B., and Ferrell J.E. Jr. (2013). Mitotic trigger waves and the spatial coordination of the Xenopus cell cycle. Nature 500, 603–607. [DOI] [PMC free article] [PubMed] [Google Scholar]
- Chevalier R.L., Forbes M.S., and Thornhill B.A. (2009). Ureteral obstruction as a model of renal interstitial fibrosis and obstructive nephropathy. Kidney Int. 75, 1145–1152. [DOI] [PubMed] [Google Scholar]
- Crosio C., Fimia G.M., Loury R., et al. (2002). Mitotic phosphorylation of histone H3: spatio-temporal regulation by mammalian Aurora kinases. Mol. Cell. Biol. 22, 874–885. [DOI] [PMC free article] [PubMed] [Google Scholar]
- Dagher P.C., Mai E.M., Hato T., et al. (2012). The p53 inhibitor pifithrin-α can stimulate fibrosis in a rat model of ischemic acute kidney injury. Am. J. Physiol. Ren. Physiol. 302, F284–F291. [DOI] [PMC free article] [PubMed] [Google Scholar]
- Du R., Xia L., Ning X., et al. (2014). Hypoxia-induced Bmi1 promotes renal tubular epithelial cell-mesenchymal transition and renal fibrosis via PI3K/Akt signal. Mol. Biol. Cell 25, 2650–2659. [DOI] [PMC free article] [PubMed] [Google Scholar]
- Eltzschig H.K., Thompson L.F., Karhausen J., et al. (2004). Endogenous adenosine produced during hypoxia attenuates neutrophil accumulation: coordination by extracellular nucleotide metabolism. Blood 104, 3986–3992. [DOI] [PubMed] [Google Scholar]
- Fredholm B.B. (2007). Adenosine, an endogenous distress signal, modulates tissue damage and repair. Cell Death Differ. 14, 1315–1323. [DOI] [PubMed] [Google Scholar]
- Graeber T.G., Peterson J.F., Tsai M., et al. (1994). Hypoxia induces accumulation of p53 protein, but activation of a G1-phase checkpoint by low-oxygen conditions is independent of p53 status. Mol. Cell. Biol. 14, 6264–6277. [DOI] [PMC free article] [PubMed] [Google Scholar]
- Gupta N., and Wish J.B. (2017). Hypoxia-inducible factor prolyl hydroxylase inhibitors: a potential new treatment for anemia in patients with CKD. Am. J. Kidney Dis. 69, 815–826. [DOI] [PubMed] [Google Scholar]
- Hammond E.M., Denko N.C., Dorie M.J., et al. (2002). Hypoxia links ATR and p53 through replication arrest. Mol. Cell. Biol. 22, 1834–1843. [DOI] [PMC free article] [PubMed] [Google Scholar]
- Higgins D.F., Kimura K., Bernhardt W.M., et al. (2007). Hypoxia promotes fibrogenesis in vivo via HIF-1 stimulation of epithelial-to-mesenchymal transition. J. Clin. Invest. 117, 3810–3820. [DOI] [PMC free article] [PubMed] [Google Scholar]
- Higgins D.F., Kimura K., Iwano M., et al. (2008). Hypoxia-inducible factor signaling in the development of tissue fibrosis. Cell Cycle 7, 1128–1132. [DOI] [PMC free article] [PubMed] [Google Scholar]
- Hubert A., Paris S., Piret J.P., et al. (2006). Casein kinase 2 inhibition decreases hypoxia-inducible factor-1 activity under hypoxia through elevated p53 protein level. J. Cell Sci. 119, 3351–3362. [DOI] [PubMed] [Google Scholar]
- Inoue T., Kozawa E., Okada H., et al. (2011). Noninvasive evaluation of kidney hypoxia and fibrosis using magnetic resonance imaging. J. Am. Soc. Nephrol. 22, 1429–1434. [DOI] [PMC free article] [PubMed] [Google Scholar]
- Kapitsinou P.P., Liu Q., Unger T.L., et al. (2010). Hepatic HIF-2 regulates erythropoietic responses to hypoxia in renal anemia. Blood 116, 3039–3048. [DOI] [PMC free article] [PubMed] [Google Scholar]
- Kapur A., Felder M., Fass L., et al. (2016). Modulation of oxidative stress and subsequent induction of apoptosis and endoplasmic reticulum stress allows citral to decrease cancer cell proliferation. Sci. Rep. 6, 27530. [DOI] [PMC free article] [PubMed] [Google Scholar]
- LeBleu V.S., Taduri G., O’Connell J., et al. (2013). Origin and function of myofibroblasts in kidney fibrosis. Nat. Med. 19, 1047–1053. [DOI] [PMC free article] [PubMed] [Google Scholar]
- Lee S.J., No Y.R., Dang D.T., et al. (2013). Regulation of hypoxia-inducible factor 1α (HIF-1α) by lysophosphatidic acid is dependent on interplay between p53 and Kruppel-like factor 5. J. Biol. Chem. 288, 25244–25253. [DOI] [PMC free article] [PubMed] [Google Scholar]
- Li T., Kon N., Jiang L., et al. (2012). Tumor suppression in the absence of p53-mediated cell-cycle arrest, apoptosis, and senescence. Cell 149, 1269–1283. [DOI] [PMC free article] [PubMed] [Google Scholar]
- Li X., Pabla N., Wei Q., et al. (2010). PKC-δ promotes renal tubular cell apoptosis associated with proteinuria. J. Am. Soc. Nephrol. 21, 1115–1124. [DOI] [PMC free article] [PubMed] [Google Scholar]
- Liu Y. (2011). Cellular and molecular mechanisms of renal fibrosis. Nat. Rev. Nephrol. 7, 684–696. [DOI] [PMC free article] [PubMed] [Google Scholar]
- Liu M., Ning X., Li R., et al. (2017). Signalling pathways involved in hypoxia-induced renal fibrosis. J. Cell. Mol. Med. 21, 1248–1259. [DOI] [PMC free article] [PubMed] [Google Scholar]
- Livak K.J., and Schmittgen T.D. (2001). Analysis of relative gene expression data using real-time quantitative PCR and the 2−ΔΔCT Method. Methods 25, 402–408. [DOI] [PubMed] [Google Scholar]
- Mack M., and Yanagita M. (2015). Origin of myofibroblasts and cellular events triggering fibrosis. Kidney Int. 87, 297–307. [DOI] [PubMed] [Google Scholar]
- Mimura I., and Nangaku M. (2010). The suffocating kidney: tubulointerstitial hypoxia in end-stage renal disease. Nat. Rev. Nephrol. 6, 667–678. [DOI] [PubMed] [Google Scholar]
- Morgan D.O. (1997). Cyclin-dependent kinases: engines, clocks, and microprocessors. Annu. Rev. Cell Dev. Biol. 13, 261–291. [DOI] [PubMed] [Google Scholar]
- Nangaku M. (2006). Chronic hypoxia and tubulointerstitial injury: a final common pathway to end-stage renal failure. J. Am. Soc. Nephrol. 17, 17–25. [DOI] [PubMed] [Google Scholar]
- Obacz J., Pastorekova S., Vojtesek B., et al. (2013). Cross-talk between HIF and p53 as mediators of molecular responses to physiological and genotoxic stresses. Mol. Cancer 12, 93. [DOI] [PMC free article] [PubMed] [Google Scholar]
- Park S.H., Choi M.J., Song I.K., et al. (2007). Erythropoietin decreases renal fibrosis in mice with ureteral obstruction: role of inhibiting TGF-β-induced epithelial-to-mesenchymal transition. J. Am. Soc. Nephrol. 18, 1497–1507. [DOI] [PubMed] [Google Scholar]
- Peng J., Ramesh G., Sun L., et al. (2012). Impaired wound healing in hypoxic renal tubular cells: roles of hypoxia-inducible factor-1 and glycogen synthase kinase 3β/β-catenin signaling. J. Pharmacol. Exp. Ther. 340, 176–184. [DOI] [PMC free article] [PubMed] [Google Scholar]
- Price P.M., Safirstein R.L., and Megyesi J. (2009). The cell cycle and acute kidney injury. Kidney Int. 76, 604–613. [DOI] [PMC free article] [PubMed] [Google Scholar]
- Rocha S., Campbell K.J., Roche K.C., et al. (2003). The p53-inhibitor pifithrin-α inhibits firefly luciferase activity in vivo and in vitro. BMC Mol. Biol. 4, 9. [DOI] [PMC free article] [PubMed] [Google Scholar]
- Semenza G.L. (2011). Oxygen sensing, homeostasis, and disease. N. Engl. J. Med. 365, 537–547. [DOI] [PubMed] [Google Scholar]
- Sermeus A., and Michiels C. (2011). Reciprocal influence of the p53 and the hypoxic pathways. Cell Death Dis. 2, e164. [DOI] [PMC free article] [PubMed] [Google Scholar]
- Sun S., Ning X., Zhang Y., et al. (2009). Hypoxia-inducible factor-1α induces Twist expression in tubular epithelial cells subjected to hypoxia, leading to epithelial-to-mesenchymal transition. Kidney Int. 75, 1278–1287. [DOI] [PubMed] [Google Scholar]
- Tang J., Jiang X., Zhou Y., et al. (2015). Increased adenosine levels contribute to ischemic kidney fibrosis in the unilateral ureteral obstruction model. Exp. Ther. Med. 9, 737–743. [DOI] [PMC free article] [PubMed] [Google Scholar]
- Ucero A.C., Benito-Martin A., Izquierdo M.C., et al. (2014). Unilateral ureteral obstruction: beyond obstruction. Int. Urol. Nephrol. 46, 765–776. [DOI] [PubMed] [Google Scholar]
- Wouters A., Pauwels B., Lambrechts H.A., et al. (2009). Chemoradiation interactions under reduced oxygen conditions: Cellular characteristics of an in vitro model. Cancer Lett. 286, 180–188. [DOI] [PubMed] [Google Scholar]
- Wynn T.A. (2010). Fibrosis under arrest. Nat. Med. 16, 523–525. [DOI] [PMC free article] [PubMed] [Google Scholar]
- Yang L., Besschetnova T.Y., Brooks C.R., et al. (2010). Epithelial cell cycle arrest in G2/M mediates kidney fibrosis after injury. Nat. Med. 16, 535–543. [DOI] [PMC free article] [PubMed] [Google Scholar]
- Yoshino J., Monkawa T., Tsuji M., et al. (2007). Snail1 is involved in the renal epithelial-mesenchymal transition. Biochem. Biophys. Res. Commun. 362, 63–68. [DOI] [PubMed] [Google Scholar]
- Yu C.C., Woods A.L., and Levison D.A. (1992). The assessment of cellular proliferation by immunohistochemistry: a review of currently available methods and their applications. Histochem. J. 24, 121–131. [DOI] [PubMed] [Google Scholar]
- Zhang L., and Hill R.P. (2004). Hypoxia enhances metastatic efficiency by up-regulating Mdm2 in KHT cells and increasing resistance to apoptosis. Cancer Res. 64, 4180–4189. [DOI] [PubMed] [Google Scholar]
- Zhou C.H., Zhang X.P., Liu F., et al. (2015). Modeling the interplay between the HIF-1 and p53 pathways in hypoxia. Sci. Rep. 5, 13834. [DOI] [PMC free article] [PubMed] [Google Scholar]


