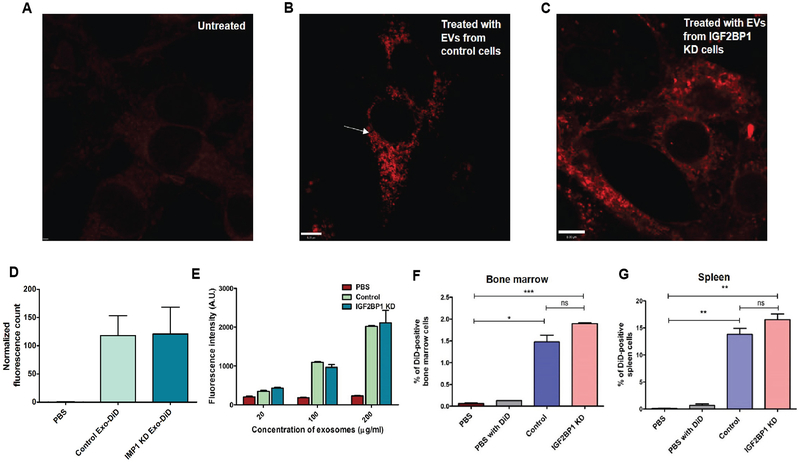
Figure 4.
Uptake of fluorescent DiD-labeled EVs isolated from control and IGF2BP1 knockdown cells. A, Fixed untreated control NIH3T3 cells viewed under STED confocal microscope. B-C, Fixed NIH3T3 cells viewed under STED confocal microscope to image uptake of DiD-labeled EVs following EV treatment for 24 h. B, Cells treated with control EVs, larger sized EVs are distinctly visible and marked with arrows. C, Cells treated with EVs from IGF2BP1 knockdown SW1 cells. D, Quantitative analyses of images acquired in STED microscope. E, Uptake of three different concentrations of EVs by recipient NIH3T3 cells. Fluorescence intensity of the cells was measured in a fluorescence spectrometer, after 24 hours of EV treatment. F, Graphical representation of flow cytometric analysis of bone marrow cells isolated from mice that received tail-vein injections of either PBS or DiD-PBS or DiD-labeled EVs isolated from control or IGF2BP1 knockdown SW1 cells, 24 hours prior to euthanization. G, Graphical representation of flow cytometric analysis of splenic cells isolated from the same mice.

