

Supplemental Digital Content is available in the text.
Keywords: Metals, Neurologic symptoms, Selenium, Mixtures
Background:
Metals have been shown to have a wide range of neurologic effects across the life course, but most studies consider neurodevelopment or neurodegenerative diseases in older adults. We investigated exposure to metals during adulthood in association with subclinical neurologic endpoints, considering the metals individually and as a mixture, and potential interactions among exposures.
Methods:
We measured blood levels of cadmium, lead, mercury, manganese, and selenium in 1007 Gulf state residents and estimated cross-sectional associations between ranked levels of blood metals and the presence of self-reported neurologic symptoms. Single pollutant models were mutually adjusted for other metals and we used quantile g-computation to evaluate associations with exposure to the combined mixture. In stratified analyses, we assessed heterogeneity by smoking and blood selenium.
Results:
The highest quartile of cadmium was associated with a higher prevalence of central nervous system symptoms (prevalence ratio [PR] = 1.50; 95% confidence interval [CI] = 1.13, 1.99), with stronger associations among nonsmokers (PR = 1.63; 95% CI = 1.11, 2.38) and those with low selenium (PR = 2.29, 95% CI = 1.50, 3.49). Selenium also modified associations between lead and peripheral nervous system symptoms, with increased symptoms in the low selenium group at all quartiles of exposure (P-trend = 0.07). Conversely, those with the highest co-exposure to mercury and selenium had reduced neurologic symptoms (PR = 0.73, 95% CI = 0.55, 0.96). Results of the mixture analysis were consistent with single chemical results.
Conclusions:
Cadmium exhibited the most consistent relationship with increased neurologic symptoms, though lead was an important exposure in subgroup analyses. Selenium may modify subclinical neurotoxic effects of metals at non-occupational levels in adults.
Introduction
Heavy metals, including cadmium, lead, and mercury, are known neurotoxicants.1 Tobacco smoke and diet are primary sources of exposure to cadmium in the United States, but vehicle and industrial emissions are also important.2–5 Lead exposure among adults occurs primarily from contaminated water (via corroded pipes), industrial emissions, traffic-related emissions, and contaminated soil and groundwater (which is absorbed by crops).6,7 Non-occupational exposure to mercury is derived mainly from seafood consumption, though it is also present in air and water at lower levels.8–10 Individuals working in the manufacturing, construction, chemical processing, and electronics recycling industries may also be occupationally exposed to these metals.1,11–13
Manganese and selenium, essential micronutrients for health maintenance, can also be toxic above certain levels. Exposure to these is mainly dietary, and both are naturally found in seafood, nuts, rice, whole grains, and some fruits and vegetables.14 The general population can also be exposed to manganese via traffic-related emissions, due to the use of manganese as an antiknock additive in gasoline.15 In mother-newborn pairs, both fetal cord blood manganese concentration and maternal blood manganese concentration were significantly associated with maternal exposure to ambient nitrogen dioxide, a surrogate for traffic emission, during pregnancy.16
These toxicants enter the bloodstream and weaken or cross the blood-brain barrier, accumulating in the central nervous system (CNS).17–19 Most of the evidence supporting metal-mediated neurotoxicity comes from experimental studies. Epidemiologic studies are less common and have yielded mixed results. Environmental and occupational cadmium exposure has been associated with cognitive impairment11,20 and altered neurobehavioral function21,22 in adults, as well as mechanisms underlying development of neurodegenerative diseases.23–25 In children, studies of cadmium exposure demonstrated adverse neurobehavioral and visual-motor effects.18 Lead’s developmental neurotoxicity and neurobehavioral effects in children are well known, but it is also associated with neurodegeneration, cognitive decline, Alzheimer’s disease, and psychological diseases.26–29 Mercury exposure can impair somatosensory function and psychomotor performance, causing movement disorders, tremors, memory loss, dementia, and depression.30,31 In children, mercury exposure has been associated with autism spectrum disorder and attention-deficit/hyperactivity disorder.32,33 While excessive occupational exposure to manganese is associated with symptoms of cognitive dysfunction and motor impairment that resemble Parkinson’s disease, there is now also growing concern over chronic low-level exposure (from contaminated water, pesticides, or airborne emissions) and neuroinflammation.15,34
Mechanisms underlying neurotoxicity of these metals remain uncertain, but oxidative stress leading to dopaminergic dysfunction is a relevant pathway.7,23,34,35 In some studies, the anti-oxidant selenium mitigates the harmful neurotoxic effects of heavy metals, including cognitive impairment and altered neonatal neurodevelopment.36–41 Selenium’s antagonism of metal toxicity may mitigate effects of oxidative stress through chelation of metals in the brain by selenoproteins.42,43
In this study, we investigated associations between blood levels of cadmium, lead, mercury, manganese, and selenium and neurologic symptoms in adult Gulf states residents. We considered exposure to each of the metals individually and assessed potential effect measure modification by selenium levels. Given that metals are potentially neurotoxic at lower levels than previously considered, particularly when simultaneous exposures are likely, and that these toxicants share exposure sources, we also assessed joint exposure to the combined metal mixture.43,44
Methods
Study design and participants
We used data from the Gulf Long-term Follow-up Study (GuLF Study), a prospective cohort of 32,608 individuals (ages 21 years and older) who participated in oil spill response activities and others who received safety training, but did not work on the response, following the 2010 Deepwater Horizon disaster. Participants enrolled between 2011 and 2013. A detailed description of this study is available elsewhere.45,46 Approximately 2–3 years after the disaster (May 2012 to July 2013), a convenience sample of GuLF Study participants living in the Gulf region (N = 1,055) were enrolled in the Chemical Biomonitoring Study (CBS), which was conducted to address community concerns about exposure to chemicals, as described elsewhere.47 Briefly, 11,193 GuLF Study participants who spoke English or Spanish and who lived in Florida, Alabama, Mississippi, Louisiana, or eastern Texas participated in a home visit exam. A sample of GuLF STUDY participants who had not yet completed the home visit by time the CBS started was selected to participate in the CBS based on eligibility criteria. We initially oversampled nonsmokers and women, but because of timing of the parent study, we ultimately invited all remaining home visit participants to participate. CBS participants provided an extra blood sample during the GuLF Study home visit that was used to measure metals. The Institutional Review Board of the National Institute of Environmental Health Sciences approved this study.
Blood biomarker measurement
Blood collection tubes containing potassium oxalate and sodium fluoride anticoagulant were used to collect 10 mL of blood for metal (cadmium, lead, total mercury, manganese, and selenium) measurement. Samples were stored in a 4 °C refrigerator before being shipped overnight on cold packs in biweekly batches to the Division of Laboratory Sciences, National Center for Environmental Health, CDC in Atlanta, Georgia. Metals were analyzed using equilibrium headspace solid-phase micro-extraction with benchtop gas chromatography/mass spectrometry following standard CDC procedures.48,49 Cotinine, a biomarker of exposure to tobacco smoke, was measured in serum that was stored in gas-phase nitrogen until analysis.46 Cotinine analysis was performed using liquid chromatography/mass spectrometry.50 Values below the limit of detection (LOD; cadmium, 0.16 ng/mL (88.5% ≥ LOD); lead, 0.25 µg/dL (99.8% ≥ LOD); total mercury, 0.16 ng/mL (97.7% ≥ LOD); manganese, 1.06 ng/mL (100% ≥ LOD); selenium, 30 ng/mL (100% ≥ LOD); cotinine, 0.015 ng/mL) were imputed as the LOD/√2, which is consistent with National Health and Nutrition Examination Survey procedures.
Neurologic symptoms
Health information, including neurologic symptoms, was collected via Computer Assisted Telephone Interview during the enrollment interview. Participants were asked to report how often they experienced dizziness, nausea, headaches, sweating, palpitations, tingling, numbness, blurred vision, stumbling while walking, and fatigue during the preceding 30 days. Frequency of symptoms was reported as: all of the time, most of the time, sometimes, rarely, or never. Symptoms were classified for analysis purposes as a binary indicator of the “presence” (all or most of the time) or “absence” (sometimes, rarely, or never) of occurrence. Based on results of a principal components analysis of all reported symptoms (data not shown), we identified two neurologic clusters: a CNS and a peripheral nervous system (PNS) cluster. The CNS cluster included dizziness, headache, nausea, sweating, and palpitations. The PNS cluster included tingling and numbness in the extremities, blurred vision, and stumbling while walking.
Covariate information
Covariates were selected using a directed acyclic graph (Supplemental Figure 1; http://links.lww.com/EE/A111).51 Covariate information was obtained during the enrollment interview. We adjusted all models for sex (male, female), age (<30, 30–45, >45 years), season of enrollment (winter, spring, summer, fall), race (white, black, other), employment status (currently working, not currently working), current alcohol consumption (any self-reported alcoholic drinks in the last year, no drinks in the last year), continuous serum cotinine (ng/mL), educational attainment (completed less than high school or general equivalency degree, completed high school/general equivalency degree, completed some college, college graduate), annual income (≤$20,000, $20,001–50,000, >$50,000), interval between enrollment and blood draw (days), and levels of co-occurring blood metals (quartiles of cadmium, lead, mercury, manganese, and selenium). We imputed the jointly defined sex-race-state-specific median income from the analytic population as a proxy for income when it was missing (n = 53). We report adjusted associations throughout the manuscript, though crude estimates are included in the supplemental material; http://links.lww.com/EE/A111.
Single chemical analysis
We restricted analyses to participants who had complete quantification of all five metals (n = 1,052). After excluding 32 participants missing neurologic symptom information and 13 individuals missing covariate information, we arrived at a final analytic sample of 1,007.
We separately examined associations between individual metal levels and the presence of any neurologic symptom, any CNS symptom, more than one CNS symptom, any PNS symptom, and more than one PNS symptom. We ranked measured blood values of each metal into quartiles for modeling. The lowest quartile for a given metal was the referent exposure category in all analyses. We used multivariate log-binomial regression to estimate prevalence ratios (PRs) and corresponding 95% confidence intervals (95% CIs) for the cross-sectional associations between blood metal levels and neurologic symptoms. We additionally evaluated effect measure modification by selenium in stratified analyses, separately estimating associations among participants with selenium levels less than or equal to the median concentration (198.4 ng/mL) (n = 505) and those with selenium exceeding the median (n = 502). For all models, we evaluated exposure-response relationships with Wald tests of linear trend by modeling exposure as an ordinal variable with integer scores for each quartile and reported corresponding P values (P-trend).
Given that tobacco smoke is a principal source of exposure to heavy metals, particularly cadmium and lead, we also examined adjusted associations for each metal among self-reported nonsmokers only (n = 709) and adjusting for continuous serum cotinine. We chose to define nonsmokers using self-reported smoking status because standard cotinine cutpoints did not appear appropriate based on the distribution of cotinine in this population. Indeed, we evaluated the distribution of cotinine and concluded that heightened population exposure to environmental tobacco smoke (ETS) limited our ability to clearly distinguish between subgroups of tobacco smoke exposure (i.e., nonsmokers, light smokers, and heavy smokers) using cotinine levels. To further examine the influence of exposure to tobacco smoke in the overall sample, we conducted separate analyses additionally adjusting for self-reported exposure to ETS (defined as living in a home with a regular smoker at enrollment), and sensitive cotinine thresholds to reflect active smoking (0 ng/mL vs. >0–10 ng/mL vs. > 10 ng/mL) and ETS (dichotomized at LOD, 0.015 ng/mL) exposure.52
We conducted separate sensitivity analyses evaluating heterogeneity by race using interaction terms between exposure and race (white vs. nonwhite), assessing the influence of seafood consumption on associations between blood mercury and neurologic symptoms, and stratifying on the median interval between date of symptom reporting and the blood draw (98 days).
Mixture analysis
We used quantile g-computation, a generalization of weighted quantile sum regression, to estimate associations between exposure to the combined metal mixture and neurologic symptoms.53,54 We selected quantile G-computation instead of weighted quantile sum because we wanted to estimate PRs (as opposed to odds ratios), explore possible interactions or departures from linearity with selenium, which is inversely associated with many health outcomes, and allow the direction of associations to vary among mixture components. This approach generates a weighted linear index of the body burden of total metals and estimates PRs and 95% CIs associated with ranked exposure to the mixture. To facilitate comparability to results from single chemical models, we used the same covariate adjustment set, modeled the combined association between the metal mixture and neurologic symptoms using a one-quartile change in exposure, and stratified results by selenium status relative to the median concentration. In addition to conducting mixture analyses stratified by selenium, we evaluated interaction terms between selenium and each component of the metal mixture separately.
The dataset was randomly divided into a training and validation dataset (50% training, 50% validation) and bootstrap sampling (n = 500) of the training dataset was used to estimate weights quantifying the relative importance of each component chemical in the exposure mixture. These weights, which are constrained from negative one to one, can be interpreted as the relative importance of each chemical component driving associations. Weights greater than zero indicate relative importance in positive associations, whereas weights less than zero indicate relative contribution to inverse associations. Positive weights, contributing to direct positive effects, sum to one and negative weights, contributing to inverse effects, sum to negative one. For this metal mixture with four components, weights of 0.25 indicate balanced contributions by each chemical component in the same direction. Because selenium was treated as a potential modifier it was not included as a mixture component.
We conducted all statistical analyses apart from quantile g-computation in SAS 9.4 (Cary, NC). We used the R package qgcomp for mixture analyses.55 All tests were two-sided with α = 0.05.
Results
Almost half of participants (48%) reported experiencing at least one neurologic symptom, with 32% of participants reporting one CNS symptom and 15% reporting multiple CNS symptoms. PNS symptoms were reported by 29% and 19% of participants for single and multiple PNS symptoms, respectively (data not shown).
Characteristics of the study population are shown in Table 1. Participants who reported neurologic symptoms had higher rates of smoking (34% vs. 25%) and were more likely to be nonwhite (57% vs. 43%) and less likely to have attended college (33% vs. 49%) than those who did not report symptoms. We observed higher levels of blood cadmium (geometric mean [GM] = 0.50 vs. 0.37 ng/mL; P-value for difference in means <.0001) and lead (GM = 1.38 vs. 1.24 µg/dL; P = 0.01), and lower mercury (0.94 vs. 1.12 ng/mL; P = 0.004), among participants who reported neurologic symptoms than those who did not (Supplemental Table 1; http://links.lww.com/EE/A111). The distribution of blood metals did not vary by oil spill response and cleanup status for any of the metals. Not surprisingly, self-reported smokers had higher levels of cadmium (GM = 1.03 vs. 0.29 ng/mL; P < 0.0001) and lead (1.56 vs. 1.21 µg/dL; P < 0.0001) than nonsmokers, and participants who reported weekly seafood consumption had higher levels of mercury (1.28 vs. 0.84 ng/mL; P <0.0001), lead (1.39 v s1.24 µg/dL; P = 0.01), and selenium (203.2 vs. 197.4 ng/mL; P = 0.001) than those who did not report consuming seafood. Most metals were not correlated with each other, though we did observe modest Spearman rank correlations between cadmium and lead (r = 0.32), mercury and selenium (r = 0.25), and mercury and lead (r = 0.24) (Supplemental Table 2; http://links.lww.com/EE/A111).
Table 1.
Demographic characteristics of participants by neurologic symptom reporting (any vs. none) (N = 1,007).
| Any neurologic symptoms (n = 480) | No neurologic symptoms (n = 527) | |||
|---|---|---|---|---|
| Demographics | N | % | N | % |
| Male | 348 | 73 | 405 | 77 |
| Age < 30 years | 85 | 18 | 123 | 23 |
| 30–45 years | 197 | 41 | 191 | 36 |
| >45 years | 198 | 41 | 213 | 40 |
| White | 210 | 44 | 303 | 58 |
| Black | 229 | 48 | 194 | 37 |
| Other | 41 | 9 | 30 | 6 |
| <High school education | 125 | 26 | 92 | 17 |
| High school diploma/GED | 197 | 41 | 181 | 34 |
| Some college | 129 | 27 | 166 | 32 |
| College graduate or more | 29 | 6 | 88 | 17 |
| Employed | 222 | 46 | 315 | 60 |
| Annual income <$20,000 | 233 | 49 | 198 | 38 |
| $20,000–50,000 | 177 | 37 | 193 | 37 |
| >$50,000 | 70 | 15 | 136 | 26 |
| Blood draw in winter | 186 | 39 | 183 | 35 |
| Spring | 86 | 18 | 113 | 21 |
| Summer | 105 | 22 | 122 | 23 |
| Fall | 103 | 21 | 109 | 21 |
| Current self-reported smoking | 165 | 34 | 133 | 25 |
| Consumes alcohol | 301 | 63 | 382 | 72 |
| Consumes seafooda | 51 | 13 | 52 | 11 |
| Worked on DWH oil spill ≥ 1 day | 427 | 89 | 431 | 82 |
aMissing reported seafood consumption for 72 participants who experienced neurologic symptoms and 66 participants who did not experience neurologic symptoms.
DWH indicates Deepwater Horizon; GED, general equivalency degree.
A comparison of unadjusted and adjusted PR’s (Supplemental Table 3; http://links.lww.com/EE/A111) indicates that adjustment for covariates tended to modestly attenuate estimates for cadmium, lead, and mercury, slightly strengthened estimates for selenium, and had negligible impact on estimates for manganese. The following results are all covariate-adjusted. In the overall sample, blood cadmium was positively associated with CNS symptoms (Figure 1 and Supplemental Table 3; http://links.lww.com/EE/A111). The (adjusted) risk estimate for the highest quartile of cadmium and any CNS symptom was PR = 1.50 (95% CI = 1.13, 1.99; P-trend = 0.01), and all quartiles of exposure for multiple CNS symptoms were PRQ2 = 1.79 (95% CI = 1.10, 2.91), PRQ3 = 1.68 (95% CI = 1.02, 2.79), and PRQ4 = 1.78 (95% CI = 1.06, 3.01) (P-trend = 0.04), both of which had significant linear exposure-response relationships. The magnitude of the cadmium association was higher when we restricted to nonsmokers (Figure 2). Blood lead was associated with PNS symptoms among nonsmokers (PRQ2 = 1.34, 95% CI = 0.93, 1.93; PRQ3 = 1.44, 95% CI = 0.99, 2.08; PRQ4 = 1.47, 95% CI 0.95, 2.28; P-trend = 0.08). Neither blood mercury nor selenium was associated with neurologic symptoms overall or in the nonsmoking subgroup (Supplemental Table 3; http://links.lww.com/EE/A111). Manganese was not independently associated with symptoms overall. The trend for manganese and multiple CNS symptoms among nonsmokers was significant (P-trend = 0.01), but associations were suggestive and difficult to interpret (Supplemental Table 3; http://links.lww.com/EE/A111).
Figure 1.

Associations between quartiles of blood cadmium, lead, and mercury and neurologic symptoms (n = 1,007). All models adjusted for sex, age, season, race, employment, alcohol, serum cotinine (ng/mL), education, income, duration of interval between enrollment and blood draw (days), and co-occurring blood metals (cadmium, lead, mercury, manganese, and selenium).
Figure 2.

Associations between quartiles of blood cadmium, lead, and mercury and neurologic symptoms among self-reported nonsmokers (n = 709). All models adjusted for sex, age, season, race, employment, alcohol, serum cotinine (ng/mL), education, income, duration of interval between enrollment and blood draw (days), and co-occurring blood metals (cadmium, lead, mercury, manganese, and selenium).
Selenium status (divided at the median concentration) modified associations between cadmium and lead and neurologic endpoints. Among those with selenium below the median, blood cadmium was positively associated with any neurologic (PRQ2 = 1.39, 95% CI = 1.05, 1.85; PRQ3 = 1.22, 95% CI = 0.91, 1.63; PRQ4 = 1.35, 95% CI = 1.02, 1.79; P-trend = 0.09), CNS (PRQ2 = 1.61, 95% CI = 1.05, 2.48; PRQ3 = 1.65, 95% CI = 1.08, 2.53; PRQ4 = 2.29, 95% CI = 1.50, 3.49; P-trend<0.0001), and multiple CNS symptoms (PRQ2 = 3.90, 95% CI = 1.12, 13.58; PRQ3 = 3.91, 95% CI = 1.10, 13.85; PRQ4 = 4.07, 95% CI = 1.21, 1366; P-trend = 0.001) at nearly all exposure quartiles, whereas there was no relationship between cadmium and neurologic symptoms in the group with higher selenium (Figure 3A). Similarly, blood lead was suggestively associated with a higher prevalence of neurologic symptoms (PRQ2 = 1.30, 95% CI = 0.99, 1.69; PRQ3 = 1.35, 95% CI = 1.01, 1.80; PRQ4 = 1.35, 95% CI = 0.98, 1.87; P-trend = 0.07), and more strongly associated with PNS effects specifically (PRQ2 = 1.80, 95% CI = 1.23, 2.64; PRQ3 = 1.70, 95% CI = 1.07, 2.68; PRQ4 = 1.68, 95% CI = 1.01, 2.79; P-trend = 0.07), among those with selenium below the median (Figure 3B). Associations with blood lead were not evident in the higher selenium subgroup. While blood mercury levels were not associated with neurologic symptoms in the higher selenium subgroup, we observed a possible inverse association among those jointly exposed to higher selenium and the highest quartile of mercury for any neurologic (PRQ4 = 0.73, 95% CI = 0.55, 0.96; P-trend = 0.05), any CNS (PRQ4 = 0.60, 95% CI = 0.39, 0.92; P-trend = 0.01), and multiple PNS symptoms (PRQ4 = 0.41, 95% CI = 0.19, 0.90; P-trend = 0.02) (Figure 3C).
Figure 3.
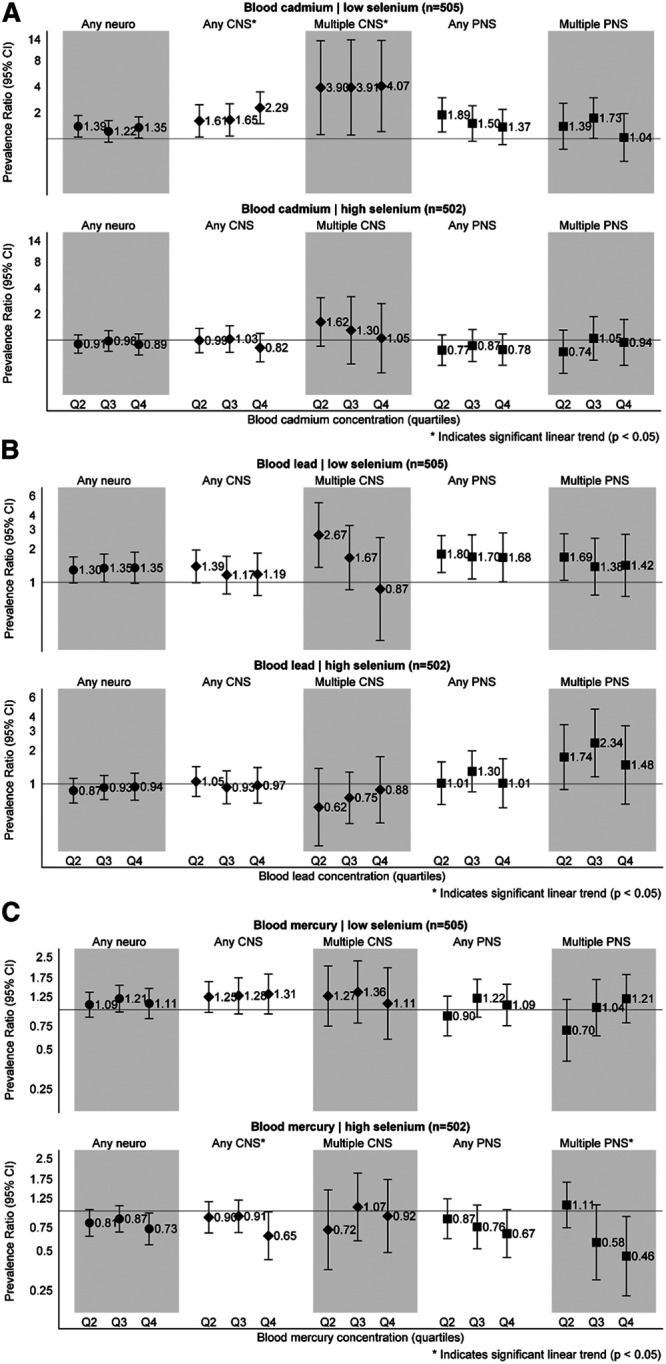
A, Associations between quartiles of blood cadmium and neurologic symptoms by selenium status. All models adjusted for sex, age, season, race, employment, alcohol, serum cotinine, education, income, duration of interval between enrollment and blood draw (days), and co-occurring blood metals (lead, mercury, and manganese). B, Associations between quartiles of blood lead and neurologic symptoms by selenium status. All models adjusted for sex, age, season, race, employment, alcohol, serum cotinine, education, income, duration of interval between enrollment and blood draw (days), and co-occurring blood metals (cadmium, mercury, and manganese). C, Associations between quartiles of blood mercury and neurologic symptoms by selenium status. All models adjusted for sex, age, season, race, employment, alcohol, serum cotinine, education, income, duration of interval between enrollment and blood draw (days), and co-occurring blood metals (cadmium, lead, and manganese).
Results from mixture analyses of joint exposure to cadmium, lead, mercury, and manganese, stratified by selenium status, were largely consistent with single chemical analyses. In the low selenium group, a one-quartile increase in exposure to the combined metal mixture was associated with neurologic symptoms (PR = 1.23, 95% CI = 1.07, 1.42), with larger effect sizes for any CNS symptoms (PR = 1.48, 95% CI = 1.23, 1.79) and multiple PNS symptoms (PR = 1.39, 95% CI = 1.05, 1.82) (Table 2). Cadmium had the heaviest total mixture weights across all outcomes, with the strongest contributions to CNS symptoms, followed by lead and manganese, whose weights were primarily concentrated in PNS symptoms. Among those with median or higher selenium, there was an inverse relationship between a quartile-increase in metal exposure and any neurologic (PR = 0.83, 95% CI = 0.71, 0.7), any CNS (PR = 0.80, 95% CI = 0.64, 0.99), and any PNS symptom (PR = 0.78, 95% CI = 0.62, 0.98), with mercury most frequently weighted higher than other metals. Negative weights (indicating inverse effects) in the low selenium stratum were associated with scaled regression coefficients approximating zero, suggesting their influence in the overall mixture effect is negligible. Interaction terms with selenium were consistently significant for both cadmium and manganese, and occasionally for mercury, though we did not detect a statistically significant interaction between selenium and lead (data not shown).
Table 2.
Associations between a one-quartile change in the combined metal mixture and neurologic symptoms, stratified by selenium level (N = 1,007).
| Symptoms | Prev. (%) | PR (95% CI) | Mixture weightsa | |||
|---|---|---|---|---|---|---|
| Cd | Pb | Hg | Mn | |||
| Selenium < median (n = 505) | ||||||
| Any neuro | 48 | 1.23 (1.07, 1.42) | 0.25 | 0.49 | 0.05 | 0.22 |
| Any CNS | 32 | 1.48 (1.23, 1.79) | 0.70 | 0.07 | 0.01 | 0.22 |
| Multiple CNS | 15 | 1.33 (0.91, 1.94) | 0.70 | −0.50 | −0.50 | 0.30 |
| Any PNS | 29 | 1.24 (1.00, 1.55) | 0.28 | 0.43 | 0.10 | 0.19 |
| Multiple PNS | 18 | 1.39 (1.05, 1.82) | 0.15 | 0.22 | 0.09 | 0.53 |
| Selenium ≥ median (n = 502) | ||||||
| Any neuro | 48 | 0.83 (0.71, 0.97) | −0.18 | −0.06 | −0.54 | −0.22 |
| Any CNS | 32 | 0.80 (0.64, 0.99) | −0.28 | −0.03 | −0.61 | −0.08 |
| Multiple CNS | 16 | 0.82 (0.57, 1.19) | −0.08 | −0.29 | −0.28 | −0.36 |
| Any PNS | 29 | 0.78 (0.62, 0.98) | −0.37 | −0.08 | −0.36 | −0.19 |
| Multiple PNS | 19 | 0.86 (0.62, 1.21) | −0.08 | −0.30 | −0.44 | −0.18 |
All models adjusted for sex, age, season, race, employment, alcohol, serum cotinine, education, income, and duration of interval between enrollment and blood draw (days).
aPositive mixture weights indicate contributions to increased neurologic symptoms and sum to positive one; negative weights contribute to decreased neurologic symptoms and sum to negative one.
In sensitivity analyses of the full analytic sample, neither self-reported exposure to ETS nor different thresholds of measured blood cotinine levels appeared to influence associations between any of the blood metals and neurologic outcomes (data not shown). We did not detect heterogeneity of exposure-outcome associations in analyses stratified by race or median interval between symptom reporting and blood draw (data not shown). Neither recent (previous 24 hours) nor typical (weekly) seafood consumption modified associations between mercury and neurologic symptoms whether we conditioned analyses via stratification or adjustment (data not shown), though these analyses were limited by smaller sample sizes due to missing information on recent (missing n = 138) and typical (missing n = 178) seafood consumption - resulting in model non-convergence for some symptom clusters.
Discussion
In this study, we examined cross-sectional associations between blood levels of metals and neurologic symptoms among adult Gulf states residents, considering each metal when co-adjusting for other metals as well as the combined metal mixture. Blood selenium modified associations between cadmium, lead, and mercury and neurologic symptoms. Increasing blood cadmium was associated with increased prevalence of CNS effects overall, with stronger associations among nonsmokers and those with lower blood selenium. Blood lead levels were associated with PNS effects in subgroup analyses of nonsmokers and those with lower blood selenium. Although blood mercury was not associated with neurologic symptoms overall, we observed a suggestive inverse interaction between higher levels of selenium and the highest quartile of mercury. We did not observe independent neurologic effects of manganese or selenium. Results from mixture analyses were consistent with single chemical analyses. Among those with lower selenium, positive associations for all outcomes were driven by cadmium and lead. In the higher selenium group, mercury drove inverse associations. Our results suggest that selenium modifies subclinical neurotoxic effects of metals in adults.
Our primary findings include increased neurologic symptoms in association with blood cadmium and lead, which are correlated exposures in this population. Associations were stronger among nonsmokers, suggesting that shared exposure to these metals, potentially from ETS, traffic-related air pollution, or industrial emissions, may impact neurologic health. The associations we observed between cadmium and CNS symptoms (dizziness, headache, nausea, sweating, and palpitations) are corroborated by reports of cadmium-associated headache and vertigo, olfactory dysfunction, Parkinsonian-like symptoms, slowing of vasomotor functioning, and decreased equilibrium.18 Other studies have demonstrated cadmium-associated CNS effects in adults, including deficits in attention, memory, visuomotor function, behavioral regulation, and processing speed.11,20–22 Our findings of associations between environmental blood lead levels and increased PNS symptoms (including tingling and numbness in the extremities, blurred vision, and stumbling while walking) are consistent with previous literature relating lead to other neurologic endpoints. For example, in a cohort of elderly men, higher bone lead levels were associated with reduced olfactory function, a marker of prodromal Parkinson’s disease, and a separate case-control study of men and women found that higher bone lead increased risk of Parkinson’s.56,57 Several epidemiologic studies have demonstrated that chronic occupational exposure to lead can elicit neurotoxic sensory and motor effects, as well as Parkinson’s disease.58
The correlation between blood levels of mercury and selenium in this population may be attributable to seafood, shellfish, and fish consumption.14 We did not observe evidence of mercury-related neurotoxicity, even though mercury is a known neurotoxin. Rather, those with the highest blood mercury and selenium co-exposures, likely seafood and shellfish consumers, were less likely to report neurologic symptoms. This inverse association may be explained by selenium’s ability to interact with mercury and reduce toxicity by altering the tissue distribution of metals.14 Although mercury exposure from seafood consumption can cause a shift toward oxidative stress and neuroinflammation, nearly 90% of fish eaten in the United States has a high enough selenium to mercury ratio such that the benefits of selenium negate the risk of mercury toxicity.59,60 Dietary fish are also rich in the omega-3 fatty acids eicosapentaenoic acid and docosahexaenoic acid, which are known to support neurodevelopment and neurologic health. Omega-3 fatty acid supplementation may be beneficial to cognition, Alzheimer’s disease onset, and Alzheimer’s disease neuropathology.61,62 These beneficial nutrients may, in part, explain the apparent neuroprotective association we observed among those with the highest blood selenium and mercury levels—an exposure profile that is potentially reflective of a healthier overall diet and lifestyle. Although limitations in the data inhibited our ability to fully examine the impact of seafood intake on these associations, this area merits further investigation.
An evolving body of research suggests that metal-induced neurotoxicity operates through oxidative stress, causing neuroinflammation. Oxidative DNA damage may lead to inhibition of paraoxonase 1 (PON1) activity via epigenetic modification or other pathways.63,64 Experimental research in vitro and in vivo and epidemiologic studies demonstrate that metals can negatively modulate activity of PON1, which exerts antioxidant and anti-inflammatory effects. In humans, cadmium and lead have consistently demonstrated inhibition of PON1 activity and mercury suggestively reduces PON1 activity, whereas selenium is positively associated with PON1 activity and expression.63 Lower circulating levels of PONs have been associated with neurodegenerative diseases, including Alzheimer’s and Parkinson’s.65 In children, methylation levels of PON1 in cord blood were inversely associated with cognitive test scores years later.66
Selenium status modified associations between neurologic symptoms and cadmium, lead, and mercury levels, suggesting that selenium may help counteract the oxidative stress and inflammation that contribute to neurotoxicity. Several in vitro and rodent studies demonstrate that selenium enhances antioxidant capacity and protects against neurotoxicity of these metals, attenuating depressive symptoms, anxiety, and memory impairment.67,68 Experimental studies in rats showed that selenium prevented mercury-induced neuronal degeneration in the cerebrum and striatum and that selenium supplementation aids in chelation of metals through the CNS.69,70 In epidemiologic studies, selenium supplementation has not been successful in treating Alzheimer’s disease or dementia, but it may help prevent disease onset by sustaining cognitive function.71,72 Indeed, people living with mild cognitive impairment and Alzheimer’s have significantly lower antioxidant levels and activity than their neurologically healthy counterparts.73
We implemented a novel mixture method to model the more realistic exposure scenario in which people are exposed to multiple metals simultaneously, potentially via shared dietary or ambient exposure sources. Using quantile G-computation, we assessed the relationship between joint exposure to the entire metal mixture and neurologic symptoms, allowing for potential interactions among mixture components. Previous research suggests that concomitant exposure to multiple metals elicits neurotoxicity even when individual metals are at levels where effects are not observed.43,64 This synergistic neurotoxicity was observed in a mixture of lead, cadmium, arsenic, and mercury in vitro and among children in relation to dopaminergic disruption, with both studies reporting multiple interactions among the mixture components.74,75 Similarly, co-exposure to lead and manganese in children was associated with neurodevelopmental deficiencies, with evidence of a synergistic interaction in the doubly exposed.76 Although we did not observe higher magnitude of associations when comparing the overall mixture effect estimates to analogous single chemical analyses, we did observe evidence of interactions between selenium and cadmium, mercury, and manganese. Overall, results between mixture analyses and single pollutant models are generally consistent, with both approaches identifying the same metals as potentially neurotoxic at these levels.
This study has several strengths, including the use of validated biomarkers to measure exposure to a range of toxic metals. Blood cadmium is a validated marker of recent exposure, and may also reflect long-term cadmium body burden after chronic low-level exposure.77,78 Blood lead level is generally considered to reflect contemporaneous environmental exposure to lead.79,80 Total blood mercury reflects recent (up to 2 months) exposure, correlates well with seafood consumption, and consequently is an accepted marker of exposure to methylmercury, the neurotoxic species of mercury, in most populations.10 Blood selenium is an accepted biomarker for long-term selenium intake, though blood selenium levels may not reflect CNS levels.81–84 Blood manganese mainly reflects dietary intake in non-occupationally exposed populations, and may not adequately capture other sources of exposure such as traffic-related air pollution.85 Although the present study relies on a single blood measurement for exposure ascertainment, these are validated biomarkers that have been well-studied in relation to neurologic, and other outcomes.
The large sample size, particularly for a biomarker-based study, allowed us to adjust for potentially confounding exposures (including other metals in the mixture) in single chemical analyses without appreciable losses in precision. We were also able to conduct analyses stratified by selenium status and restrict to nonsmokers. Additionally, all models were adjusted for serum cotinine, an objective, validated biomarker of tobacco smoke exposure.86 Including cotinine in models may have attenuated effect estimates because cigarettes and ETS are principal sources of exposure to metals, particularly cadmium and lead. As such, our attempts to adequately account for confounding by tobacco smoke likely adjusted for some sources of the exposures of interest. Given that the range range of metal exposure levels observed in this population is similar to general-population levels, the use of sensitive, sub-clinical endpoints was appropriate. Although some of the neurologic symptoms we evaluated are not necessarily specific to neurotoxicity, we hypothesize that these outcomes analyzed in clusters may represent early indications of neurotoxicity. Much of the literature examining associations between toxic metals and neurologic health focuses either on childhood neurodevelopment or neurodegeneration in elderly populations. The present study is unique because we evaluated these relationships in a relatively healthy adult population. Finally, we applied a novel, flexible mixtures approach to consider simultaneous exposure to all five metals.
This study is limited by the cross-sectional design, preventing causal interpretation of exposure-outcome relationships. Symptoms were ascertained before blood specimens were obtained, with 50% of participants contributing blood samples within 14 weeks of symptom reporting. However, we adjusted all models for the interval between symptom reporting and the blood draw, and sensitivity analyses stratified by duration of this interval did not reveal differences in exposure-outcome associations between those with longer and shorter intervals. Further, blood levels of metals tend to be valid representations of exposure windows that exceed this interval, suggesting that the measured levels in blood may accurately reflect exposure at the time of enrollment/symptom reporting. Another potential limitation is unmeasured confounding by other neuroactive exposures (including metals not measured in this sample) or dietary factors, such as fatty amino acid intake. Similarly, more complete information characterizing seafood intake would allow for thorough examination of the impact of seafood consumption on observed associations with each metal, particularly those related to mercury and selenium. Finally, while self-reported symptoms are a sensitive and relevant endpoint, future analyses of the relationship between metals and neurotoxicity would be improved by evaluating objectively ascertained neurologic impairment.
In both single chemical and mixture analyses, we found that increasing levels of blood cadmium and lead were associated with a higher prevalence of CNS and PNS symptoms, respectively. While manganese and selenium were not consistently independently associated with outcomes, selenium modified associations between cadmium, lead, and mercury with neurologic endpoints. These findings indicate that general population levels of metals may be related to subclinical neurotoxicity and future studies should consider effect heterogeneity by concomitant exposures such as selenium.
Supplementary Material
Footnotes
Published online 4 December 2020
This research was supported by the Intramural Research Program of the National Institutes of Health (NIH) and the National Institute of Environmental Health Sciences/NIH (Z01-ES049030).
The authors declare that they have no conflicts of interest with regard to the content of this report.
The data and computer code are not available for replication because the data are not publicly available.
Supplemental digital content is available through direct URL citations in the HTML and PDF versions of this article (www.environepidem.com).
References
- 1.Aschner M, Costa L. Schousboe A. Neurotoxicity of Metals. Advances in Neurobiology. 2017. Springer International [Google Scholar]
- 2.Adams SV, Newcomb PA, Shafer MM, et al. Sources of cadmium exposure among healthy premenopausal women. Sci Total Environ. 2011; 409:1632–1637 [DOI] [PMC free article] [PubMed] [Google Scholar]
- 3.Hoffmann K, Krause C, Seifert B. The German Environmental Survey 1990/92 (GerES II): primary predictors of blood cadmium levels in adults. Arch Environ Health. 2001; 56:374–379 [DOI] [PubMed] [Google Scholar]
- 4.Jung SY, Kim S, Lee K, et al. Association between secondhand smoke exposure and blood lead and cadmium concentration in community dwelling women: the fifth Korea National Health and Nutrition Examination Survey (2010-2012). BMJ Open. 2015; 5:e008218. [DOI] [PMC free article] [PubMed] [Google Scholar]
- 5.Filippini T, Michalke B, Malagoli C, et al. Determinants of serum cadmium levels in a Northern Italy community: a cross-sectional study. Environ Res. 2016; 150:219–226 [DOI] [PubMed] [Google Scholar]
- 6.Brink LL, Talbott EO, Sharma RK, et al. Do US ambient air lead levels have a significant impact on childhood blood lead levels: results of a national study. J Environ Public Health. 2013; 2013:278042. [DOI] [PMC free article] [PubMed] [Google Scholar]
- 7.Chen LC, Lippmann M. Effects of metals within ambient air particulate matter (PM) on human health. Inhal Toxicol. 2009; 21:1–31 [DOI] [PubMed] [Google Scholar]
- 8.Nielsen SJ, Kit BK, Aoki Y, Ogden CL. Seafood consumption and blood mercury concentrations in adults aged ≥20 y, 2007-2010. Am J Clin Nutr. 2014; 99:1066–1070 [DOI] [PMC free article] [PubMed] [Google Scholar]
- 9.Vianna ADS, Matos EP, Jesus IM, Asmus CIRF, Câmara VM. Human exposure to mercury and its hematological effects: a systematic review. Cad Saude Publica. 2019; 35:e00091618. [DOI] [PubMed] [Google Scholar]
- 10.Basu N, Horvat M, Evers DC, Zastenskaya I, Weihe P, Tempowski J. A state-of-the-science review of mercury biomarkers in human populations worldwide between 2000 and 2018. Environ Health Perspect. 2018; 126:106001. [DOI] [PMC free article] [PubMed] [Google Scholar]
- 11.Hart RP, Rose CS, Hamer RM. Neuropsychological effects of occupational exposure to cadmium. J Clin Exp Neuropsychol. 1989; 11:933–943 [DOI] [PubMed] [Google Scholar]
- 12.Clarkson TW, Magos L. The toxicology of mercury and its chemical compounds. Crit Rev Toxicol. 2006; 36:609–662 [DOI] [PubMed] [Google Scholar]
- 13.Koh DH, Locke SJ, Chen YC, Purdue MP, Friesen MC. Lead exposure in US worksites: a literature review and development of an occupational lead exposure database from the published literature. Am J Ind Med. 2015; 58:605–616 [DOI] [PMC free article] [PubMed] [Google Scholar]
- 14.Bates CJ, Prentice A, Birch MC, Delves HT. Dependence of blood indices of selenium and mercury on estimated fish intake in a national survey of British adults. Public Health Nutr. 2007; 10:508–517 [DOI] [PubMed] [Google Scholar]
- 15.Lucchini R, Placidi D, Cagna G, et al. Manganese and developmental neurotoxicity. Adv Neurobiol. 2017; 18:13–34 [DOI] [PMC free article] [PubMed] [Google Scholar]
- 16.Lin YY, Hwang YH, Chen PC, et al. Contribution of gestational exposure to ambient traffic air pollutants to fetal cord blood manganese. Environ Res. 2012; 112:1–7 [DOI] [PubMed] [Google Scholar]
- 17.Glaser V, Nazari EM, Müller YM, et al. Effects of inorganic selenium administration in methylmercury-induced neurotoxicity in mouse cerebral cortex. Int J Dev Neurosci. 2010; 28:631–637 [DOI] [PubMed] [Google Scholar]
- 18.Wang B, Du Y. Cadmium and its neurotoxic effects. Oxid Med Cell Longev. 2013; 2013:1–12 [DOI] [PMC free article] [PubMed] [Google Scholar]
- 19.Yokel RA. Blood-brain barrier flux of aluminum, manganese, iron and other metals suspected to contribute to metal-induced neurodegeneration. J Alzheimers Dis. 2006; 10:223–253 [DOI] [PubMed] [Google Scholar]
- 20.Ciesielski T, Bellinger DC, Schwartz J, Hauser R, Wright RO. Associations between cadmium exposure and neurocognitive test scores in a cross-sectional study of US adults. Environ Health. 2013; 12:13. [DOI] [PMC free article] [PubMed] [Google Scholar]
- 21.Struempler RE, Larson GE, Rimland B. Hair mineral analysis and disruptive behavior in clinically normal young men. J Learn Disabil. 1985; 18:609–612 [DOI] [PubMed] [Google Scholar]
- 22.Viaene MK. Neurobehavioural effects of occupational exposure to cadmium: a cross sectional epidemiological study. Occup Environ Med. 2000; 57:19–27 [DOI] [PMC free article] [PubMed] [Google Scholar]
- 23.Branca JJV, Morucci G, Pacini A. Cadmium-induced neurotoxicity: still much ado. Neural Regen Res. 2018; 13:1879–1882 [DOI] [PMC free article] [PubMed] [Google Scholar]
- 24.Kwakye GF, Jiménez JA, Thomas MG, et al. Heterozygous huntingtin promotes cadmium neurotoxicity and neurodegeneration in striatal cells via altered metal transport and protein kinase C delta dependent oxidative stress and apoptosis signaling mechanisms. Neurotoxicology. 2019; 70:48–61 [DOI] [PubMed] [Google Scholar]
- 25.Sheykhansari S, Kozielski K, Bill J, et al. Redox metals homeostasis in multiple sclerosis and amyotrophic lateral sclerosis: a review. Cell Death Dis. 2018; 9:348. [DOI] [PMC free article] [PubMed] [Google Scholar]
- 26.Dórea JG. Environmental exposure to low-level lead (Pb) co-occurring with other neurotoxicants in early life and neurodevelopment of children. Environ Res. 2019; 177:108641. [DOI] [PubMed] [Google Scholar]
- 27.Caito S, Aschner M. Developmental neurotoxicity of lead. Adv Neurobiol. 2017; 18:3–12 [DOI] [PubMed] [Google Scholar]
- 28.Agency for Toxic Substances and Disease Registry (ATSDR). Toxicological Profile for Lead. 2007. Atlanta, GA: U.S. Department of Health and Human Services, Public Health Service [Google Scholar]
- 29.Horton CJ, Weng HY, Wells EM. Association between blood lead level and subsequent Alzheimer’s disease mortality. Environ Epidemiol. 2019; 3:e045. [DOI] [PMC free article] [PubMed] [Google Scholar]
- 30.Oliveira CS, Piccoli BC, Aschner M, Rocha JBT. Chemical Speciation of Selenium and Mercury as Determinant of Their Neurotoxicity. 2017. Springer International Publishing; 53–83 [DOI] [PubMed] [Google Scholar]
- 31.Choi BH. The effects of methylmercury on the developing brain. Prog Neurobiol. 1989; 32:447–470 [DOI] [PubMed] [Google Scholar]
- 32.Kern JK, Geier DA, Sykes LK, Haley BE, Geier MR. The relationship between mercury and autism: a comprehensive review and discussion. J Trace Elem Med Biol. 2016; 37:8–24 [DOI] [PubMed] [Google Scholar]
- 33.Skalny AV, Simashkova NV, Klyushnik TP, et al. Assessment of serum trace elements and electrolytes in children with childhood and atypical autism. J Trace Elem Med Biol. 2017; 43:9–14 [DOI] [PubMed] [Google Scholar]
- 34.Peres TV, Schettinger MR, Chen P, et al. “Manganese-induced neurotoxicity: a review of its behavioral consequences and neuroprotective strategies”. BMC Pharmacol Toxicol. 2016; 17:57. [DOI] [PMC free article] [PubMed] [Google Scholar]
- 35.Farina M, Aschner M. Methylmercury-induced neurotoxicity: focus on pro-oxidative events and related consequences. Adv Neurobiol. 2017; 18:267–286 [DOI] [PubMed] [Google Scholar]
- 36.Glaser V, Moritz B, Schmitz A, et al. Protective effects of diphenyl diselenide in a mouse model of brain toxicity. Chem Biol Interact. 2013; 206:18–26 [DOI] [PubMed] [Google Scholar]
- 37.Kiełczykowska M, Kocot J, Paździor M, Musik I. Selenium - a fascinating antioxidant of protective properties. Adv Clin Exp Med. 2018; 27:245–255 [DOI] [PubMed] [Google Scholar]
- 38.Lakshmi BV, Sudhakar M, Prakash KS. Protective effect of selenium against aluminum chloride-induced Alzheimer’s disease: behavioral and biochemical alterations in rats. Biol Trace Elem Res. 2015; 165:67–74 [DOI] [PubMed] [Google Scholar]
- 39.Soudani N, Troudi A, Amara IB, Bouaziz H, Boudawara T, Zeghal N. Ameliorating effect of selenium on chromium (VI)-induced oxidative damage in the brain of adult rats. J Physiol Biochem. 2012; 68:397–409 [DOI] [PubMed] [Google Scholar]
- 40.Rinaldi P, Polidori MC, Metastasio A, et al. Plasma antioxidants are similarly depleted in mild cognitive impairment and in Alzheimer’s disease. Neurobiol Aging. 2003; 24:915–919 [DOI] [PubMed] [Google Scholar]
- 41.Yang X, Bao Y, Fu H, Li L, Ren T, Yu X. Selenium protects neonates against neurotoxicity from prenatal exposure to manganese. PLoS One. 2014; 9:e86611. [DOI] [PMC free article] [PubMed] [Google Scholar]
- 42.Obulesu M, Venu R, Somashekhar R. Lipid peroxidation in Alzheimer’s disease: emphasis on metal-mediated neurotoxicity. Acta Neurol Scand. 2011; 124:295–301 [DOI] [PubMed] [Google Scholar]
- 43.Schofield K. The metal neurotoxins: an important role in current human neural epidemics? Int J Environ Res Public Health. 2017; 14:1511. [DOI] [PMC free article] [PubMed] [Google Scholar]
- 44.Järup L. Hazards of heavy metal contamination. Br Med Bull. 2003; 68:167–182 [DOI] [PubMed] [Google Scholar]
- 45.Kwok RK, Engel LS, Miller AK, et al. ; GuLF STUDY Research Team. The GuLF STUDY: a prospective study of persons involved in the Deepwater Horizon oil spill response and clean-up. Environ Health Perspect. 2017; 125:570–578 [DOI] [PMC free article] [PubMed] [Google Scholar]
- 46.Engel LS, Kwok RK, Miller AK, et al. The Gulf Long-Term Follow-Up Study (GuLF STUDY): biospecimen collection at enrollment. J Toxicol Environ Health A. 2017; 80:218–229 [DOI] [PMC free article] [PubMed] [Google Scholar]
- 47.Werder EJ, Sandler DP, Richardson DB, Emch ME, Kwok RK, Engel LS. Determinants of environmental styrene exposure in Gulf coast residents. J Expo Sci Environ Epidemiol. 2019; 29:831–841 [DOI] [PMC free article] [PubMed] [Google Scholar]
- 48.Blount BC, Kobelski RJ, McElprang DO, et al. Quantification of 31 volatile organic compounds in whole blood using solid-phase microextraction and gas chromatography-mass spectrometry. J Chromatogr B Analyt Technol Biomed Life Sci. 2006; 832:292–301 [DOI] [PubMed] [Google Scholar]
- 49.Chambers DM, McElprang DO, Waterhouse MG, Blount BC. An improved approach for accurate quantitation of benzene, toluene, ethylbenzene, xylene, and styrene in blood. Anal Chem. 2006; 78:5375–5383 [DOI] [PubMed] [Google Scholar]
- 50.Moyer TP, Charlson JR, Enger RJ, et al. Simultaneous analysis of nicotine, nicotine metabolites, and tobacco alkaloids in serum or urine by tandem mass spectrometry, with clinically relevant metabolic profiles. Clin Chem. 2002; 48:1460–1471 [PubMed] [Google Scholar]
- 51.Greenland S, Pearl J, Robins JM. Causal diagrams for epidemiologic research. Epidemiology. 1999; 10:37–48 [PubMed] [Google Scholar]
- 52.Torres S, Merino C, Paton B, Correig X, Ramirez N. Biomarkers of exposure to secondhand and thirdhand tobacco smoke: recent advances and future perspectives. Int J Environ Res Public Health. 2018; 15:2693. [DOI] [PMC free article] [PubMed] [Google Scholar]
- 53.Keil AP, Buckley JP, O’Brien KM, Ferguson KK, Zhao S, White AJ. A quantile-based g-computation approach to addressing the effects of exposure mixtures. Environ Health Perspect. 2020; 128:047004. [DOI] [PMC free article] [PubMed] [Google Scholar]
- 54.Carrico C, Gennings C, Wheeler DC, Factor-Litvak P. Characterization of weighted quantile sum regression for highly correlated data in a risk analysis setting. J Agric Biol Environ Stat. 2015; 20:100–120 [DOI] [PMC free article] [PubMed] [Google Scholar]
- 55.Keil AP. qgcomp: Quantile G-Computation. 2019 [Google Scholar]
- 56.Grashow R, Sparrow D, Hu H, Weisskopf MG. Cumulative lead exposure is associated with reduced olfactory recognition performance in elderly men: the Normative Aging Study. Neurotoxicology. 2015; 49:158–164 [DOI] [PMC free article] [PubMed] [Google Scholar]
- 57.Weisskopf MG, Weuve J, Nie H, et al. Association of cumulative lead exposure with Parkinson’s disease. Environ Health Perspect. 2010; 118:1609–1613 [DOI] [PMC free article] [PubMed] [Google Scholar]
- 58.Bjorklund G, Stejskal V, Urbina MA, Dadar M, Chirumbolo S, Mutter J. Metals and Parkinson’s disease: mechanisms and biochemical processes. Curr Med Chem. 2018; 25:2198–2214 [DOI] [PubMed] [Google Scholar]
- 59.Karimi R, Vacchi-Suzzi C, Meliker JR. Mercury exposure and a shift toward oxidative stress in avid seafood consumers. Environ Res. 2016; 146:100–107 [DOI] [PMC free article] [PubMed] [Google Scholar]
- 60.Ralston NVC, Kaneko JJ, Raymond LJ. Selenium health benefit values provide a reliable index of seafood benefits vs. risks. J Trace Elem Med Biol. 2019; 55:50–57 [DOI] [PubMed] [Google Scholar]
- 61.Canhada S, Castro K, Perry IS, Luft VC. Omega-3 fatty acids’ supplementation in Alzheimer’s disease: a systematic review. Nutr Neurosci. 2018; 21:529–538 [DOI] [PubMed] [Google Scholar]
- 62.Morris MC, Brockman J, Schneider JA, et al. Association of seafood consumption, brain mercury level, and APOE ε4 status with brain neuropathology in older adults. JAMA. 2016; 315:489–497 [DOI] [PMC free article] [PubMed] [Google Scholar]
- 63.Costa LG, Cole TB, Garrick JM, Marsillach J, Furlong CE. Aschner M, Costa L. Metals and paraoxonases. Neurotoxicity of Metals. 2017; 18Springer International Publishing; 85–111 [DOI] [PubMed] [Google Scholar]
- 64.Wright RO, Baccarelli A. Metals and neurotoxicology. J Nutr. 2007; 137:2809–2813 [DOI] [PubMed] [Google Scholar]
- 65.Li HL, Liu DP, Liang CC. Paraoxonase gene polymorphisms, oxidative stress, and diseases. J Mol Med (Berl). 2003; 81:766–779 [DOI] [PubMed] [Google Scholar]
- 66.Cardenas A, Rifas-Shiman SL, Agha G, et al. Persistent DNA methylation changes associated with prenatal mercury exposure and cognitive performance during childhood. Sci Rep. 2017; 7:288. [DOI] [PMC free article] [PubMed] [Google Scholar]
- 67.Batool Z, Agha F, Tabassum S, Batool TS, Siddiqui RA, Haider S. Prevention of cadmium-induced neurotoxicity in rats by essential nutrients present in nuts. Acta Neurobiol Exp (Wars). 2019; 79:169–183 [PubMed] [Google Scholar]
- 68.Branca JJV, Morucci G, Maresca M, et al. Selenium and zinc: two key players against cadmium-induced neuronal toxicity. Toxicol In Vitro. 2018; 48:159–169 [DOI] [PubMed] [Google Scholar]
- 69.Sakamoto M, Yasutake A, Kakita A, et al. Selenomethionine protects against neuronal degeneration by methylmercury in the developing rat cerebrum. Environ Sci Technol. 2013; 47:2862–2868 [DOI] [PubMed] [Google Scholar]
- 70.Wang M, Fu H, Xiao Y, et al. Effects of low-level organic selenium on lead-induced alterations in neural cell adhesion molecules. Brain Res. 2013; 1530:76–81 [DOI] [PubMed] [Google Scholar]
- 71.Loef M, Schrauzer GN, Walach H. Selenium and Alzheimer’s disease: a systematic review. J Alzheimers Dis. 2011; 26:81–104 [DOI] [PubMed] [Google Scholar]
- 72.Kryscio RJ, Abner EL, Caban-Holt A, et al. Association of antioxidant supplement use and dementia in the Prevention of Alzheimer’s Disease by Vitamin E and Selenium Trial (PREADViSE). JAMA Neurol. 2017; 74:567–573 [DOI] [PMC free article] [PubMed] [Google Scholar]
- 73.Viña J, Lloret A, Ortí R, Alonso D. Molecular bases of the treatment of Alzheimer’s disease with antioxidants: prevention of oxidative stress. Mol Aspects Med. 2004; 25:117–123 [DOI] [PubMed] [Google Scholar]
- 74.Zhou F, Xie J, Zhang S, et al. Lead, cadmium, arsenic, and mercury combined exposure disrupted synaptic homeostasis through activating the Snk-SPAR pathway. Ecotoxicol Environ Saf. 2018; 163:674–684 [DOI] [PubMed] [Google Scholar]
- 75.de Burbure C, Buchet JP, Leroyer A, et al. Renal and neurologic effects of cadmium, lead, mercury, and arsenic in children: evidence of early effects and multiple interactions at environmental exposure levels. Environ Health Perspect. 2006; 114:584–590 [DOI] [PMC free article] [PubMed] [Google Scholar]
- 76.Claus Henn B, Schnaas L, Ettinger AS, et al. Associations of early childhood manganese and lead coexposure with neurodevelopment. Environ Health Perspect. 2012; 120:126–131 [DOI] [PMC free article] [PubMed] [Google Scholar]
- 77.Järup L, Akesson A. Current status of cadmium as an environmental health problem. Toxicol Appl Pharmacol. 2009; 238:201–208 [DOI] [PubMed] [Google Scholar]
- 78.Lauwerys RR, Bernard AM, Roels HA, Buchet JP. Cadmium: exposure markers as predictors of nephrotoxic effects. Clin Chem. 1994; 407 pt 21391–1394 [PubMed] [Google Scholar]
- 79.Fang F, Peters TL, Beard JD, et al. Blood lead, bone turnover, and survival in amyotrophic lateral sclerosis. Am J Epidemiol. 2017; 186:1057–1064 [DOI] [PMC free article] [PubMed] [Google Scholar]
- 80.Hu H, Payton M, Korrick S, et al. Determinants of bone and blood lead levels among community-exposed middle-aged to elderly men. The normative aging study. Am J Epidemiol. 1996; 144:749–759 [DOI] [PubMed] [Google Scholar]
- 81.Longnecker MP, Stram DO, Taylor PR, et al. Use of selenium concentration in whole blood, serum, toenails, or urine as a surrogate measure of selenium intake. Epidemiology. 1996; 7:384–390 [DOI] [PubMed] [Google Scholar]
- 82.Solovyev N, Berthele A, Michalke B. Selenium speciation in paired serum and cerebrospinal fluid samples. Anal Bioanal Chem. 2013; 405:1875–1884 [DOI] [PubMed] [Google Scholar]
- 83.Vinceti M, Mandrioli J, Borella P, Michalke B, Tsatsakis A, Finkelstein Y. Selenium neurotoxicity in humans: bridging laboratory and epidemiologic studies. Toxicol Lett. 2014; 230:295–303 [DOI] [PubMed] [Google Scholar]
- 84.Vinceti M, Solovyev N, Mandrioli J, et al. Cerebrospinal fluid of newly diagnosed amyotrophic lateral sclerosis patients exhibits abnormal levels of selenium species including elevated selenite. Neurotoxicology. 2013; 38:25–32 [DOI] [PMC free article] [PubMed] [Google Scholar]
- 85.Baker MG, Simpson CD, Stover B, et al. Blood manganese as an exposure biomarker: state of the evidence. J Occup Environ Hyg. 2014; 11:210–217 [DOI] [PMC free article] [PubMed] [Google Scholar]
- 86.Kim S. Overview of cotinine cutoff values for smoking status classification. Int J Environ Res Public Health. 2016; 13:1236. [DOI] [PMC free article] [PubMed] [Google Scholar]
Associated Data
This section collects any data citations, data availability statements, or supplementary materials included in this article.