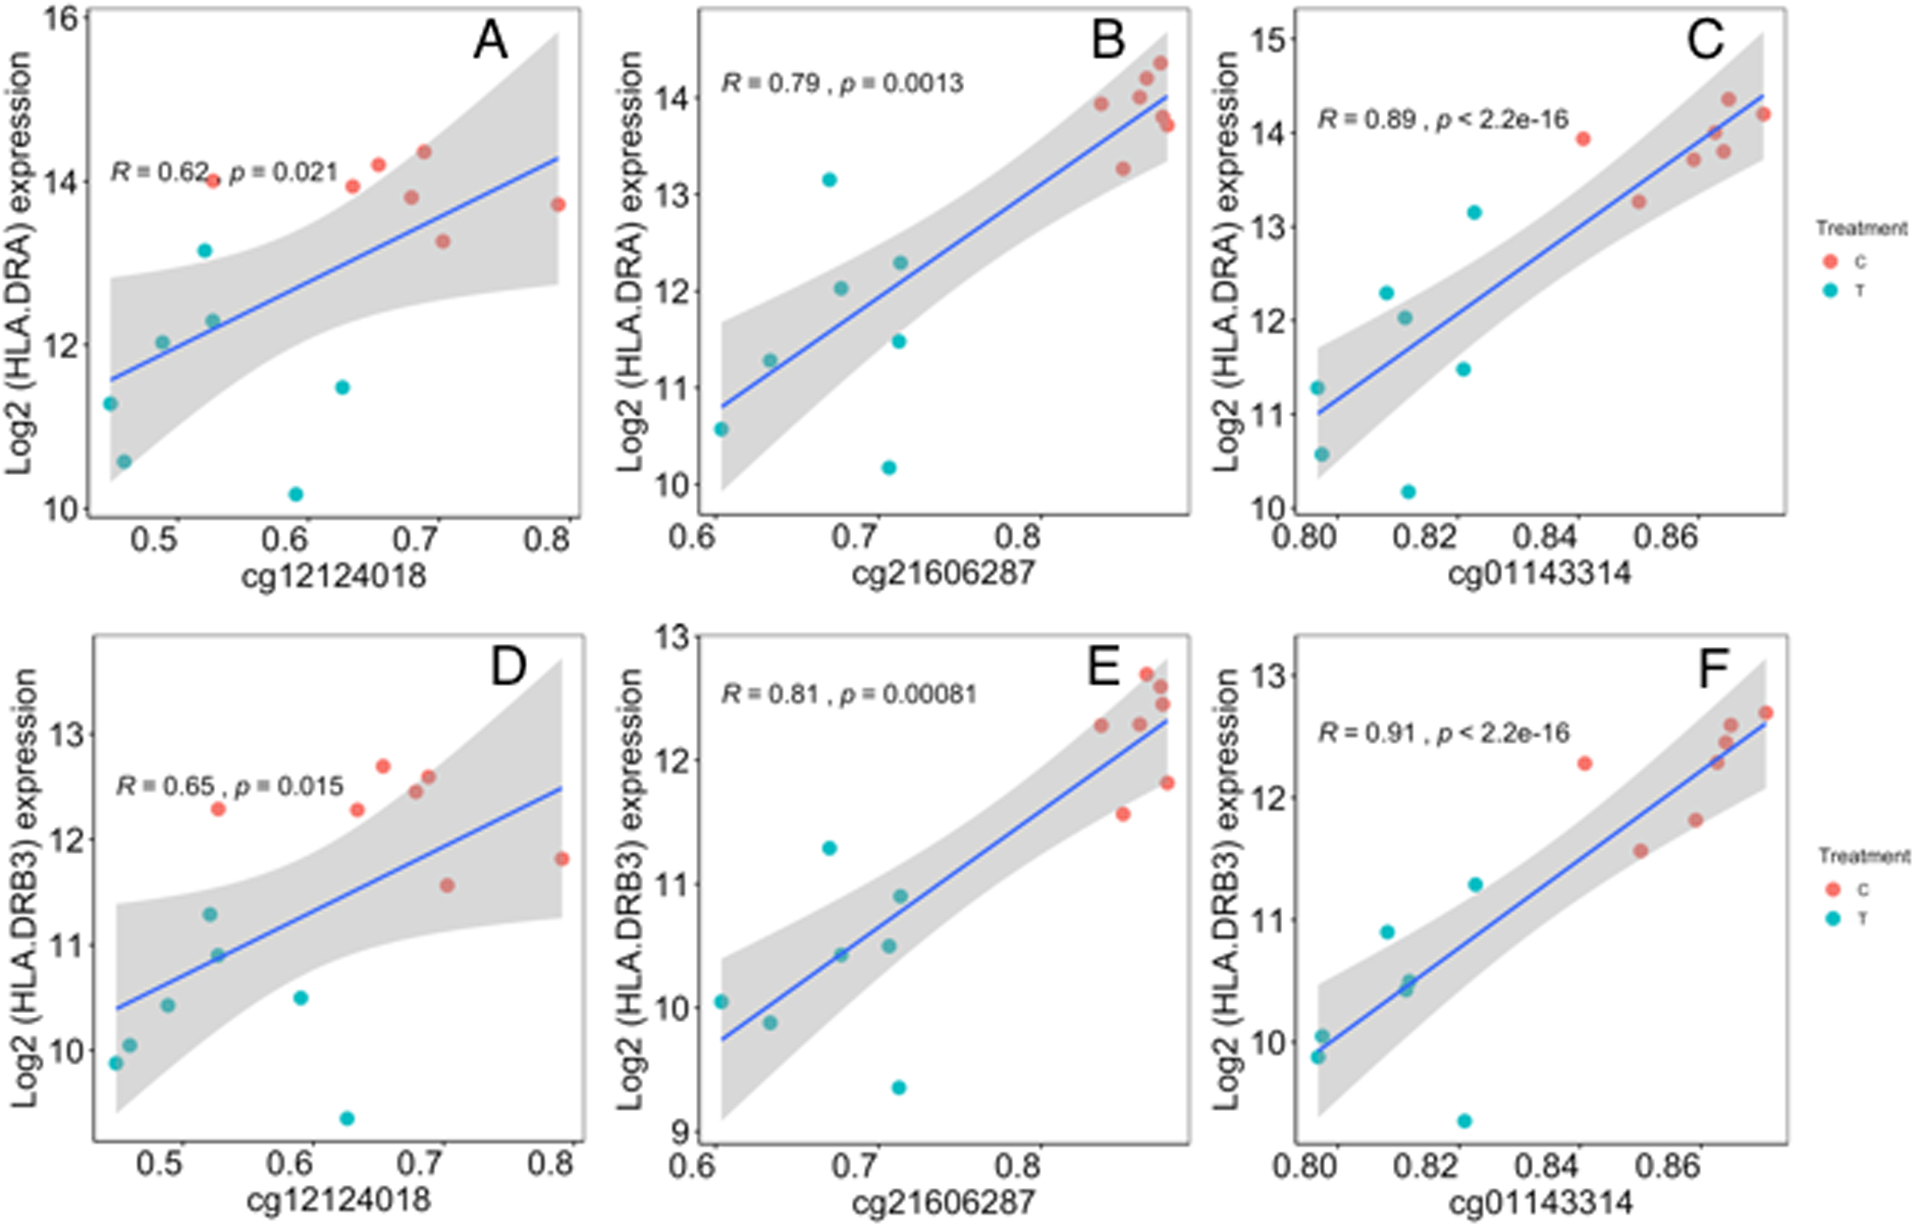
Fig 4. CFB Exon 8 CpGs methylation shows strong correlation to HLA-DRA and HLA-DRB3 gene expression.

Correlation coefficients and linear regression p values were determined for CpGs in exon 8 (cg12124018, cg21606287, cg01143314) associated with gene expression of HLA-DRA (Figure 6A-C) and HLA-DRB3 (Figure 6D-F). Correlations were calculated using the Spearman rank correlation method. Linear regression lines and its 95% confidence intervals is indicated by the blue lines and gray bands, respectively.
