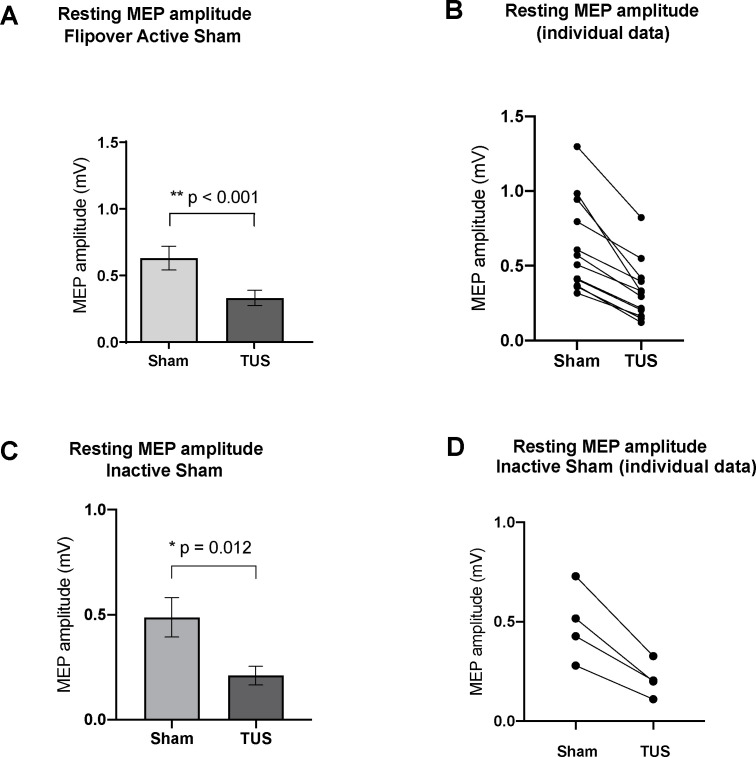
Figure 4. Effect of baseline ultrasound versus active and inactive sham on TMS-induced resting motor-evoked potential (MEP) amplitudes as measured by FDI EMG.
(A) Baseline parameters (PRF = 1000 Hz, DC = 30%, SD = 0.5 s) suppressed mean MEP voltage compared to active sham, or powered transducer pointing upward (p<0.001, paired t-test) N = 12. (B) Individual MEP values by participant by condition (C) Baseline parameters suppressed mean MEP voltage compared to inactive sham, or unpowered transducer pointing toward the scalp (p=0.012, paired t-test) N = 4. (d) Individual MEP values by participant by condition. Error bars represent standard error.

