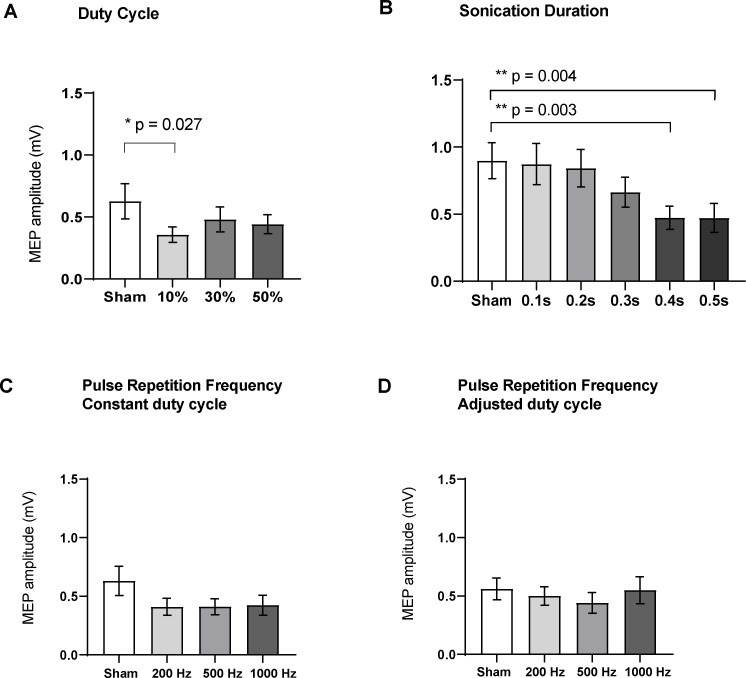
Figure 5. Effects of ultrasound parameters on TMS-induced resting peak-to-peak motor-evoked potential (MEP) amplitudes as measured by FDI EMG (N = 16).
Means of MEPs were plotted across the different sub-experiments which varied different parameters (A) Duty cycle (p=0.015; RM one-way ANOVA), 10% DC suppressed MEPs compared to sham (p=0.027, paired t-test). (B) Sonication duration had an effect proportional to the length of sonication (p<0.001; RM one-way ANOVA), with significant suppression compared to sham with 0.4 s (p=0.003), and 0.5 s (p=0.004). (C) Varying the pulse repetition frequency with fixed DC (p=0.08; RM one-way ANOVA) or (D) adjusted DC to keep constant burst duration (p=0.31; RM one-way ANOVA) did not have a significant effect. Error bars represent standard error. Asterisks are indicative of a significant post-hoc two-tailed paired t-test, and p-values are adjusted with the Holm-Bonferroni method (α = 0.05).


