

Abstract
Purpose.
To determine the liver expression of cytochrome P450 (CYPs) and uridine 5’-diphosphate-glucuronosyltransferases (UGTs), the major phase I and II metabolism enzymes responsible for clearance and detoxification of drugs, xenobiotic and endogenous substances.
Methods.
A validated isotope label-free method was established for absolute and simultaneous quantification of 9 CYPs (1A2, 2A6, 2B6, 2C8, 2C9, 2C19, 2D6, 2E1 and 3A4) and 5 UGTs (1A1, 1A4, 1A6, 1A9 and 2B7) in human liver microsomes using LC-MS/MS.
Results.
The LC-MS/MS method displayed excellent dynamic range (at least 250-fold) and high sensitivity for each of the signature peptides with acceptable recovery, accuracy and precision. The protein expression profile of CYP and UGT isoforms were then determined in match microsomes samples prepared from patients with HBV-positive human hepatocellular carcinoma (HCC). In the tumor microsomes, the average absolute amounts of 8 major CYP isoforms (except CYP2C19) and 3 UGT isoforms (UGT1A1, UGT1A4 and UGT2B7) were decreased significantly (p<0.05), whereas UGT1A6 and UGT1A9 levels were unchanged (p>0.05). In addition, among isoforms with altered expression, 6 of 8 CYP isoforms and all three UGT isoforms were much more variable in tumor microsomes. Lastly, the importance of CYP3A4 was greatly diminished whereas the importance of UGT1A6 was enhanced in tumor microsomes.
Conclusion.
The use of an isotope label-free absolute quantification method for the simultaneous determination of 9 CYPs and 5 UGTs in human liver microsomes reveals that expression levels of CYPs and UGTs in human liver are severely impact by HCC, which could impact drug metabolism, disposition and pharmacotherapy.
Keywords: cytochrome P450, UDP-glucuronosyltransferases, absolute quantification, LC-MS/MS, human hepatocellular carcinoma
1. INTRODUCTION
Human liver plays a critically important role in metabolism, where both endogenous and exogenous substances are converted to polar products more amendable for excretion, usually through specialized enzymatic systems such as cytochrome P450 (CYPs) and uridine 5’-diphospho-glucuronosyltransferases (UGTs). In a typical human liver, where 18 CYP families were predicted according to sequence homology, 11 isoforms are mainly expressed, including CYP1A2, CYP2A6, CYP2B6, CYP2C8/9/18/19, CYP2D6, CYP2E1, and CYP3A4/5 [1]. These 11 CYP isoforms are responsible for 70–80% of all phase I metabolism of 90% of marketed drugs [2–3]. UGTs are responsible for glucuronidation, a major part of phase II metabolism, which serves as an essential clearance and detoxification mechanism for many drugs and low molecular weight endogenous compounds such as bilirubin, hydroxysteroids, and fatty acids. Human UGTs are classified into four families (UGT1, UGT2, UGT3 and UGT8), and the main UGT proteins expressed in the human liver are UGT1A1, UGT1A3, UGT1A4, UGT1A6, UGT1A9, and UGT2B7 [4].
Liver cancer is a common cause of cancer death throughout the world. Among primary liver cancers, hepatocellular carcinoma (HCC) represents the major histological subtype, accounting for 70% to 85% of the total liver cancer cases. Chronic infection with hepatitis B virus (HBV) is a major public health concern for many parts of Asia including China [5]. In addition to problems associated with viral infection, HBV infection is the most well established risk factor for HCC as approximately 53% of the HCC cases were found attributable to HBV [6]. In China, more than 90% of the HCC patients are also diagnosed with HBV infection [7–8], which are usually treated with both anti-cancer and anti-HBV drugs. In contrast, most of the liver cancer patients in developed countries are the result of liver cirrhosis, primarily from alcoholism and other ailments. Alarmingly, the liver cancer incidence in the developed countries is rising although the same incidence rate is decreasing in Asia, primarily because of HBV immunization effort [9].
Many liver diseases such as cirrhosis have a major impact on mRNA expression of CYPs and UGTs [10–12], and the expression pattern of CYP genes in HBV-positive liver was also identified by oligonucleotide microarray [13]. However, the absolute amounts of CYP and UGT isoforms express in liver with HBV-positive HCC has not been reported yet. Because a significant portion of liver cancer patients with HBV is expected to use many chemotherapeutic drugs and antiviral agents, which are subjected to phase I and phase II metabolism, establishment of these enzymes’ expression levels may help guide the use of drugs in these patients. Therefore, absolute quantification values of CYP or UGT protein amounts in liver samples obtained from surgically resected liver lobes are highly desirable in order to get a more precise and better description of their expression levels in tumor and surrounding tissues.
2. MATERIALS AND METHODS
2.1. Chemicals and reagents
Ammonium bicarbonate, dithiothreitol, iodoacetamide, ammonium hydroxide were purchased from Sigma-Aldrich Co. (St. Louis, MO). TPCK (L-1-tosylamido-2-phenylethyl chloromethyl ketone) – treated trypsin was purchased from Promega (Madison, WI). Insect Cell Control Supersomes™ was purchased from BD Biosciences (Woburn, MA). Solid-phase extraction (SPE) cartridges (C18 50mg, 3ml) were purchased from J.T.Baker (Philipsburg, NJ). Acetonitrile, methanol, and water (LC-MS grade) were purchased from Merck (Darmstadt, Germany). All other chemicals were used as received.
2.2. Human liver samples
Approvals for tissue collection and studies were obtained from the Nan Fang Hospital Research Ethics Committee. All subjects, who also tested positive with hepatitis B virus (HBV), had undergone surgery for Hepatocellular carcinoma (HCC) resection at Affiliated NangFang Hospital of Southern Medical University, Guangzhou, China. HCC tissues and matched pericarcinomatous tissues (tissue removed from the tumor, which was an approximate distance of 3 cm from the tumor lesions) were obtained from 15 Chinese subjects (aged between 37 and 75 years; 52±11 years, mean±SD) (Table I). All specimens were confirmed by pathological examination and clinicopathological parameters, and were classified into five grades (grade cannot be assessed, well differentiated, moderately differentiated, poorly differentiated and undifferentiated) according to the AJCC Cancer Staging Manual [36]. Only the moderately and/or poorly differentiated cases were selected in the present study. Tissues were kept in ice-cold saline immediately after resection. Healthy tissue surrounding primary tumor was isolated carefully and used in preparation of liver microsomes right away (30min usually).
Table I.
Human liver donor details and tissue histology
| Tissue Code | Gender | Age (years) | HBV Infection | Histology and Histological Gradea | AFPb (μg/L) | Volumec (cm3) |
|---|---|---|---|---|---|---|
| A05231 | Male | 59 | + | HCC (M) | 5.7 | 136.3 |
| A10211 | Male | 53 | + | HCC (M) | Unknown | 32.3 |
| A06151 | Male | 51 | + | HCC (M/P) | 2.1 | 94.6 |
| A06161 | Male | 43 | + | HCC (M/P) | >1000H | 58.2 |
| A07271 | Male | 43 | + | HCC (M) | >1000H | 56.5 |
| A09301 | Male | 36 | + | HCC (M/P) | 502.1H | 119.1 |
| A10141 | Male | 40 | + | HCC (M/P) | >1000H | 111.4 |
| A10261 | Male | 65 | + | HCC (M) | >1000H | 107.4 |
| A11101 | Male | 42 | + | HCC (M) | 181.6 | 364.8 |
| A11161 | Male | 40 | + | HCC (M) | 4.5 | 32.9 |
| A12221 | Male | 55 | + | HCC (M) | Unknown | Unknown |
| B03022 | Male | 59 | + | HCC (M) | >1000 | 364.8 |
| B03221 | Male | 74 | + | HCC (M) | Unknown | 496.0 |
| B03281 | Male | 58 | + | HCC (M) | >1000 | 139.7 |
| B04051 | Male | 39 | + | HCC (M) | 2.9 | 253.1 |
HCC, Hepatocellular carcinoma; M, Moderately differentiated; P, Poorly differentiated
AFP, Alpha-fetoprotein; H, high
Tumor volume was determined by two-dimensional Volume using the formula: length * width2/2, length and width of tumor were diagnosed by US or CT.
Reference human liver microsomes (rHLMs-pooled) were purchased from BD Biosciences. These microsomes were derived from a pool of 22 Caucasian donors, 1 Hispanic and 1 African American (average age: 48±14 years). Commercial source microsomes, which were easily available to different laboratories, were usually employed as the reference human liver microsomes. One type of the rHLMs-pooled (43 Caucasian donors, 4 Hispanic, 1 African American and 2 Asian, average age: 53±13) purchased from XenoTech, L.L.C was used by Kawakami [14] for quantifying CYP isoforms. Another rHLMs-pooled (48 Caucasian donors, 4 Hispanic, 3 African American and 5 unknown race, average age: 47±14) purchased from BD Bioscience were used by Fallon [15] when developing a method to absolutely quantify UGT enzyme isoforms. These rHLMs-pooled purchased from commercial source were prepared according to reproducible standard operation procedures to produce batches with comparable qualities.
2.3. Selection of signature peptides for CYPs and UGTs quantification
Peptides, previously used to quantify CYP1A2, CYP2A6, CYP2B6, CYP2C8, CYP2C9, CYP2C19, CYP2D6, CYP2E1, CYP3A4/3A43, CYP3A43 [14] and UGT1A1, UGT1A6 [16], UGT1A4, UGT1A9 [17] and UGT2B7 [18], were selected as the signature peptides for quantitative analysis of human CYPs and UGTs simultaneously (Table II). The absolute expression amount of CYP3A4 was calculated indirectly by substracting amounts of CYP3A43 from total amounts of CYP3A4/3A43. A universal internal standard peptide (GYLPNPALQR) was designed for the quantification of these proteins. All the signature peptides were synthesized by APeptide Co., Ltd. (Shanghai, China) and their purity (>95%) was determined using HPLC-UV (with a detection wavelength of 220nm) analysis and ESI-TOF MS analysis. Stock solutions of signature peptide of UGT1A6 were prepared in acetonitrile-ammonium bicarbonate (50 mM) (40:60, v/v), while the other peptides were in acetonitrile-water-acetic acid (40:60:0.1, v/v/v). The net peptide content in each stock solution was determined by using quantitative amino acid analysis reported previously [38–39], with some minor modifications. Peptides were hydrolysed at 110 °C for 22hr using 6 M hydrochloric acid containing 0.1% phenol. Well-recovered amino acids including phenylalanine, leucine, isoleucine (except for the peptide bonds involving isoleucine and valine), proline, threonine and tyrosine were chosen to quantify the amount of peptide, while other amino acids were not used for quantification because of the complete or partial destruction and partial cleavage of some particular peptide bonds [40]. All stock solutions were stored, in 100 μl aliquots, at −80°C in polypropylene vials until use.
Table II.
Sequences and MRM transitions of signature peptides for quantifying CYP and UGT isofroms
| Isoforms | Peptides Sequence | Mass | Quantitative Ions | Qualitative Ions | |||||||||
|---|---|---|---|---|---|---|---|---|---|---|---|---|---|
| MRM Transition | Ion Seriesa | DP | CE | CXP | MRM Transition | Ion Series | DP | CE | CXP | ||||
| CYP1A2 | Y244LPNPALQR252 | 1071.3 | 536.4 > 398.2 | y3° | 90 | 20 | 20 | 536.4 > 795.9 | y7 | 90 | 25 | 20 | |
| 536.4 > 584.6 | y5 | 90 | 25 | 15 | 536.4 > 277.3 | b2 | 90 | 20 | 15 | ||||
| CYP2A6 | G162TGGANIDPTFFLSR176 | 1552.7 | 777.0 > 867.1 | y7 | 50 | 40 | 40 | 777.0 > 441.2 | b10* | 50 | 35 | 20 | |
| 777.0 > 982.1 | y8 | 50 | 35 | 45 | 777.0 > 554.1 | b7* | 50 | 30 | 25 | ||||
| CYP2B6 | G110YGVIFANGNR120 | 1167.3 | 585.0 > 792.5 | y7 | 50 | 20 | 30 | 585.0 > 679.2 | y6 | 50 | 20 | 30 | |
| 585.0 > 278.2 | b3 | 50 | 30 | 15 | 585.0 > 377.5 | b4 | 50 | 20 | 15 | ||||
| CYP2C8 | G98NSPISQR105 | 875.9 | 429.5 > 390.4 | y3 | 50 | 25 | 20 | 429.5 > 302.9 | y2 | 50 | 23 | 25 | |
| 429.5 > 503.4 | y4 | 50 | 25 | 20 | 429.5 > 599.8 | y5 | 50 | 20 | 40 | ||||
| CYP2C9 | G98IFPLAER105 | 902.7 | 451.8 > 585.4 | y5 | 90 | 18 | 30 | 451.8 > 318.1 | b3 | 90 | 15 | 15 | |
| 451.8 > 366.8 | y6++ | 90 | 15 | 15 | 451.8 > 488.3 | y4 | 90 | 25 | 20 | ||||
| CYP2C19 | G98HFPLAER105 | 926.92 | 463.8 > 195.2 | b2 | 50 | 25 | 12 | 463.8 > 342.2 | b3 | 50 | 25 | 20 | |
| 463.8 > 585.2 | y5 | 50 | 25 | 30 | 463.8 > 732.3 | y6 | 50 | 22 | 35 | ||||
| CYP2D6 | D381IEVQGFR388 | 963.1 | 482.3 > 735.3 | y6 | 50 | 20 | 35 | 482.3 > 378.9 | y3 | 50 | 20 | 25 | |
| 482.3 > 507.3 | y4 | 50 | 17 | 30 | 482.3 > 606.3 | y5 | 50 | 17 | 35 | ||||
| CYP2E1 | G113IIFNNGPTWK123 | 1246.4 | 623.9 > 538.7 | y9++ | 50 | 20 | 35 | 623.9 > 284.1 | b3 | 50 | 20 | 15 | |
| 623.9 > 963.1 | y8 | 50 | 25 | 45 | 623.9 > 816.7 | y7 | 50 | 25 | 35 | ||||
| CYP3A4/3A43 | L331QEEIDAVLPNK342 | 1368.6 | 684.7 > 242.0 | b2 | 50 | 30 | 20 | 684.7 > 358.6 | y3 | 50 | 25 | 15 | |
| 684.7 > 1127.6 | y10 | 50 | 25 | 45 | 684.7 > 471.2 | y4 | 50 | 30 | 25 | ||||
| CYP3A43 | F337ALTNIK343 | 806.0 | 404.0 > 191.0 | a2 | 90 | 20 | 12 | 404.0 > 588.3 | y5 | 90 | 19 | 27 | |
| 404.0 > 219.0 | b2 | 90 | 18 | 14 | 404.0 > 659.3 | y6 | 90 | 20 | 32 | ||||
| UGT1A1 | T78YPVPFQR85 | 1007.2 | 504.1 > 372.3 | y6++ | 50 | 16 | 15 | 504.1 > 547.4 | y4 | 50 | 26 | 25 | |
| 504.1 > 237.0 | a2 | 50 | 20 | 20 | 504.1 > 743.7 | y6 | 50 | 18 | 15 | ||||
| UGT1A4 | V92TLGYTQGFFETEHLLK108 | 1983.3 | 662.0 > 201.1 | b2 | 90 | 25 | 13 | 662.0 > 296.3 | b3° | 90 | 25 | 13 | |
| 662.0 > 892.2 | y15++ | 90 | 25 | 38 | 662.0 > 835.6 | y14++ | 90 | 25 | 37 | ||||
| UGT1A6 | D44IVEVLSDR52 | 1045.2 | 523.5 > 490.1 | y4 | 50 | 20 | 27 | 523.5 > 718.5 | y6 | 50 | 20 | 26 | |
| 523.5 > 229.1 | b2 | 50 | 25 | 12 | 523.5 > 817.4 | y7 | 50 | 23 | 35 | ||||
| UGT1A9 | A92FAHAQWK99 | 958.1 | 320.4 > 191.0 | a2 | 90 | 15 | 13 | 320.4 > 335.2 | y5++ | 90 | 18 | 15 | |
| 320.4 > 370.8 | y6++ | 90 | 13 | 16 | 320.4 > 444.3 | y3* | 90 | 14 | 18 | ||||
| UGT2B7 | T41ILDELIQR49 | 1100.3 | 550.7 > 187.4 | a2 | 90 | 27 | 10 | 550.7 > 773.6 | y6 | 90 | 20 | 25 | |
| 550.7 > 215.1 | b2 | 90 | 20 | 15 | 550.7 > 886.0 | y7 | 90 | 22 | 14 | ||||
| ISb | GYLPNPALQR | 1128.3 | 565.0 > 221.1 | b2 | 90 | 26 | 14 | 565.0 > 398.2 | y3° | 90 | 22 | 20 | |
| 565.0 > 454.9 | y8++ | 90 | 22 | 18 | 565.0 > 584.2 | y5 | 90 | 31 | 27 | ||||
2.4. Instruments and conditions
All samples were analyzed by using a triple quadruple mass spectrometer (5500 QTrap, AB Sciex, Foster City, CA) coupled to a Waters Acquity UPLC system (Waters, Milford, MA, USA). The liquid chromatography separation was carried out on an Acquity UPLC HSS T3 column (1.8μm, 2.1×100 mm). Sample volume of 10μl was injected to the column and flow rate was 0.5 ml/min. Sample rack and column temperatures were maintained at 10°C and 40°C, respectively. Mobile phase A was high purity HPLC-grade water with 0.1% (v/v) acetic acid, whereas mobile phase B was 100% acetonitrile with 0.1 % (v/v) acetic acid. A linear gradient was used to achieve the chromatographic separation, starting from 5% B and progressing to 30% B over a period of 14 min and regressing to 5% B in 2 minutes for column equilibration.
Quantification was performed in positive ion scheduled MRM mode on an API 5500 Qtrap triple quadruple mass spectrometer equipped with a TurboIonSpray™. The instrument settings were as follows: ionspray voltage, 1500 V; temperature, 500°C; ion source gas 1 and 2 were both 30 psi; MRM detection window, 60 sec and target scan time, 1.3 sec. Compound-dependent parameters were listed in Table II. For each peptide, four sets of MRM transitions were selected for use in quantification, as shown in Table II, two most abundant fragments of which were used for quantification and to get a high sensitivity, while another two were selected as qualitative ions to get a high selectivity. The precursor-to-product transition for the UGT1A9 and UGT1A4 prototypic peptide represents the triply charged parent ion (3H+) to the singly or doubly charged product ions while the transitions for all other analyzed peptides represents the doubly charged parent ions (2H+). The ion counts in the chromatograms were determined using data acquisition software supplied by AB Sciex (Analyst software 1.5.3). Measured peptide concentrations were converted to protein levels (pmol/mg microsomal protein) based on the standards used in the analysis.
2.5. Preparation of human liver microsomes
Liver microsomes of 15 donors (nHLMs-individual) were processed using standard differential centrifugation procedures, which is essentially the same as described previously [19], with some minor modifications. Briefly, the liver tissues were perfused and washed with ice-cold buffer (8 mM KH2PO4, 5.6 mM Na2HPO4, 1.5 mM EDTA, 1 M dithiothreitol (DTT), and 0.28 mM phenylmethylsulfonyl fluoride (PMSF, a protease inhibitor)). The tissues were then dissected and homogenized in 50 mM phosphate buffer (pH 7.4) containing 250 mM sucrose, 1 mM EDTA and 0.28 mM PMSF. The homogenate was centrifuged at 12,000×g for 15 min at 4°C. After the pellet was discarded, the supernatant was centrifuged at 110,000×g for 1 h at 4°C. The microsomal pellets were resuspended in 250 mM sucrose and immediately stored (10 mg to 50 mg of protein/ml) at −80°C. The total protein concentrations were measured according to the Bradford method (Bio-Rad, Hercules, CA), using bovine serum albumin (BSA) as the standard. A portion of 15 human liver microsomes were also pooled together, named as nHLM-pooled, based on equivalent protein amount to ensure the mixture represent the average of 15 individuals.
2.6. Tryptic digestion and sample preparation
120 μg of microsomal protein from nHLMs-individuals or nHLMs-pooled, tHLMs-individuals or tHLMs-pooled, Supersomes™ or rHLM-pooled purchased from BD biosciences were digested with the protocol used previously [20] with some minor modifications. Samples in 50 mM ammonium bicarbonate digestion buffer (90 μl) were denatured and reduced by heating at 95°C for 10 min in the presence of DTT (spiked, 5mM final concentration)). This was followed by alkylation with iodoacetamide (10 mM) for 30 min, which was conducted away from light exposure. The mixture (final volume, 124 μl) was then digested with trypsin at 37°C for 4 h using the optimized ratio (1:50) of trypsin to protein. The reaction was stopped by acidification with trifluoroacetic acid (final concentration: 0.2% trifluoroacetic acid), followed by addition of 20 μl of internal standard (50nM) working solution. Following centrifugation at 800 g for 10 min, the supernatants were evaporated under nitrogen. To prepare solid phase extraction (SPE) for sample cleaning, 1 ml of 0.1% trifluoroacetic acid was added to a SPE cartridge (C18, J.T. Baker, Philipsburg, NJ) that was conditioned with 100% acetonitrile and distilled water. After samples were loaded into conditioned SPE and washed with 1 ml of 0.1% trifluoroacetic acid, analytes were then eluted with 1ml acetonitrile-water-trifluoroacetic acid (60:40:0.1, v/v/v). The eluent was evaporated to dryness under nitrogen at room temperature, and samples were reconstituted with 200 μl methanol-water-acetic acid (30:70:0.1, v/v/v) and centrifuged for 30 min at 18,000g. The resulting supernatant was used for direct injection into the LC-MS/MS.
2.7. Method validation
2.7.1. Calibration curve
Calibration curves were prepared according to section 2.6 by using Insect Cell Control Supersomes™ as matrix. Briefly, prior to the digestion, the signature peptides were carefully added to the control Supersomes™. Calibration curves were constructed by plotting peak area ratios of each MRM selected versus the concentrations of signature peptides spiked. A weighting factor 1/x was applied. The lower limit of detection (LLOQ) was defined based on a signal-to-noise ratio of at least 10:1. All the target isoforms of CYPs and UGTs, in units of pmol/mg (microsomal) protein, were extrapolated from the curves for unknown samples.
2.7.2. Assay precision and accuracy
Precision and accuracy of quantification were assessed by analyzing standard samples in three different concentrations (2.3, 18.8 and 150 nM for CYP2C9; 1.6, 12.5 and 100nM for CYP2E1; 0.9, 7.5 and 60nM for other CYP/UGT signature peptides), prepared in the same way as described in 2.7.1. Intra-day precision was determined by six independent replicates from a single sample preparation. Inter-day precision was determined by 18 replicates resulting from three preparations. Their measured concentrations were calculated from each calibration curve. Precision was expressed as the relative standard deviation (%RSD), which represents the standard deviation (SD) of the samples replicates over their mean values at each concentration, whereas accuracy was determined as the percentage of deviations of the measured concentrations from their nominal values.
2.7.3. Matrix effect
External standard addition method was used to determine the effects of matrix, which is based on the addition of known amounts of peptide standard to sample matrices. Eight liver microsomes, randomly selected from 15 subjects, were spiked with equal amount of signature peptides that correspond to selected CYP and UGT isoforms. The spiked amount of each peptide was determined based on the average protein amount of the isoforms in these selected samples. The accuracy of the standard addition was calculated by the following equation.
Whereas Cmesured is the measured amount after spiking with the additional standard peptides; CHLM is the amount of analytes originally contained in human liver microsomes, which was determined in section 3.4; Cspiked is the amount of spiked analytes.
2.7.4. Extraction recovery
The extraction recovery of the signature peptides was determined by comparing (a) the peak areas obtained from blank matrices spiked with analytes before the extraction with (b) those from samples to which analytes were added after the extraction. All samples were analyzed in triplicates at three concentration levels.
2.8. Data analysis
Shapiro-Wilk test of normality was used to check the distribution shape of the data, using the SPSS Statistics 20.0 software. Paired-samples T-test and one way ANOVA with Dunnett T3 post-hoc test were employed to analyze normally distributed data. For non-normally distributed data, Mann-Whitney U test and Kruskal-Wallis one way ANOVA rank test with multiple Mann-Whitney U tests (post-hoc) were used. Correlation analyses were performed using Pearson product-moment correlation. A p-value of <0.05 was considered to be the minimum level of statistical significance (two-tailed) for all the statistical analyses. The sample size and statistical power was estimated by using PASS Sample Size 11.0 software.
3. RESULTS
3.1. Method Development
It was necessary for use to develop and validate a modified method for current study because published methods did not meet our needs due to a variety of reasons (e.g., some of the peptides did not produce good signal in our system). We first constructed calibration curve using control insect Supersomes as the matrices since mammalian liver microsomes produced major interference (results not shown). By varying the concentration range for each of the signature peptides based on the average expression levels of corresponding UGT or CYP isoforms in the rHLMs-pooled, we were able to achieve at least a 250-fold dynamic range for each of the peptides using a “scheduled” MRM analysis approach. The correlation coefficients (r2) of all targeted signature peptides were better than 0.990 when using 1/x weighing. The LLOQ was defined as the quantitation limit of the quantitative ion with lower sensitivity, based on a signal-to-noise ratio of at least 10:1 (but no more than 20:1). The LLOQ of these peptides varied from 0.1 to 0.6 nM (Table III).
Table III. Precision and accuracy for the determination of CYP and UGT isoforms.
Intra- and inter-day precision and accuracy were determined by measuring standard samples at three concentration levels (Low, Mid, High): 2.3, 18.8 and 150 nM for CYP2C9; 1.6, 12.5 and 100nM for CYP2E1; and 0.9, 7.5 and 60 nM for other signature peptides, respectively.
| Isoforms | LLOQ [nM] | Accuracy | Intra-day Precision | Inter-day Precision | ||||||||
|---|---|---|---|---|---|---|---|---|---|---|---|---|
| [%Deviation] | [%RSD] | [%RSD] | ||||||||||
| Low | Mid | High | Low | Mid | High | Low | Mid | High | ||||
| CYP1A2 | 0.1 | 10.4 | 10.9 | 5.2 | 2.6 | 4.4 | 6.5 | 4.8 | 4.0 | 4.1 | ||
| CYP2A6 | 0.1 | 8.3 | 14.5 | 14.2 | 7.1 | 4.6 | 6.2 | 6.8 | 5.5 | 5.1 | ||
| CYP2B6 | 0.2 | 18.2 | 16.0 | 12.0 | 7.5 | 11.3 | 11.3 | 9.2 | 7.2 | 7.3 | ||
| CYP2C8 | 0.4 | 16.3 | 12.9 | 6.1 | 5.1 | 10.4 | 6.6 | 9.9 | 10.7 | 4.9 | ||
| CYP2C9 | 0.1 | 17.0 | 18.0 | 5.0 | 3.5 | 6.3 | 6.2 | 5.7 | 4.5 | 3.9 | ||
| CYP2C19 | 0.6 | 27.9 | 25.6 | 22.9 | 13.4 | 7.6 | 5.7 | 10.3 | 5.8 | 5.0 | ||
| CYP2D6 | 0.1 | 19.4 | 12.4 | 7.4 | 3.1 | 7.1 | 7.1 | 5.4 | 6.5 | 4.9 | ||
| CYP2E1 | 0.3 | −0.5 | 9.8 | 18.4 | 9.7 | 19.2 | 6.0 | 12.8 | 21.5 | 10.3 | ||
| CYP3A4/3A43 | 0.2 | 12.7 | 18.0 | 16.2 | 3.9 | 4.0 | 6.2 | 8.8 | 7.1 | 5.8 | ||
| CYP3A43 | 0.1 | 5.0 | 13.0 | 8.7 | 4.0 | 4.6 | 6.5 | 6.0 | 4.5 | 5.0 | ||
| UGT1A1 | 0.1 | 28.4 | 11.3 | 7.6 | 4.0 | 5.1 | 5.9 | 5.6 | 4.6 | 4.6 | ||
| UGT1A4 | 0.1 | −9.6 | 13.0 | 29.5 | 8.7 | 5.6 | 8.1 | 16.4 | 10.0 | 10.2 | ||
| UGT1A6 | 0.4 | 18.4 | 7.2 | 15.1 | 8.7 | 6.4 | 6.8 | 10.3 | 10.9 | 8.0 | ||
| UGT1A9 | 0.1 | 5.3 | 14.3 | 12.6 | 6.9 | 6.5 | 6.1 | 11.2 | 10.9 | 9.6 | ||
| UGT2B7 | 0.1 | 12.6 | 14.0 | 7.6 | 4.5 | 5.7 | 7.4 | 6.5 | 9.5 | 9.7 | ||
The above samples were all processed using SPE and the mean recovery values of most signature peptides were determined to be greater than 70% at three concentration levels. The extraction efficiency was a bit lower for CYP2B6 and CYP2E1 with an acceptable range of 55%−65% (Table IV). These results suggested that this SPE protocol could be used for samples clean-up of trypsin-mediated protein digestion. Since properties of analytes varied and only one extraction procedure was used for all 15 signature peptides, it was not surprising that recovery of a few of these signature peptides were not always in the ideal range of 70%−130%.
Table IV.
Extraction recovery of signature peptides for quantifying CYP and UGT isoforms
| Isoforms | Recovery (%) (mean±SD, n=3) | ||
|---|---|---|---|
| Low | Mid | High | |
| CYP1A2 | 83.8±2.2 | 87.3±4.2 | 84.2±6.3 |
| CYP2A6 | 71.5±2.8 | 81.1±3.0 | 81.7±5.5 |
| CYP2B6 | 58.7±2.4 | 55.4±7.7 | 59.6±5.0 |
| CYP2C8 | 80.1±2.5 | 94.5±11.3 | 83.3±6.7 |
| CYP2C9 | 82.6±2.6 | 88.6±4.4 | 85.0±6.0 |
| CYP2C19 | 78.4±0.9 | 86.6±7.0 | 78.5±6.3 |
| CYP2D6 | 82.6±1.8 | 89.4±6.7 | 84.1±6.5 |
| CYP2E1 | 63.5±4.5 | 55.3±14.5 | 77.1±1.9 |
| CYP3A4/3A43 | 77.2±1.2 | 82.2±2.2 | 83.0±6.0 |
| CYP3A43 | 80.4±1.2 | 83.8±3.2 | 82.7±6.9 |
| UGT1A1 | 81.2±2.6 | 81.5±3.7 | 74.6±5.3 |
| UGT1A4 | 82.7±1.5 | 96.8±5.9 | 79.5±8.3 |
| UGT1A6 | 83.3±5.6 | 81.2±6.4 | 89.0±5.3 |
| UGT1A9 | 73.4±3.6 | 73.9±6.9 | 80.4±5.0 |
| UGT2B7 | 82.0±1.2 | 86.1±7.2 | 82.3±7.7 |
3.2. Method Validation.
Intra- and inter-day precision and accuracy of the above developed method were determined by measuring validation samples at three concentration levels (2.3, 18.8 and 150 nM for CYP2C9; 1.6, 12.5 and 100nM for CYP2E1; and 0.9, 7.5 and 60nM for other CYP/UGT signature peptides, respectively). The precision and accuracy are shown in Table III. Inaccuracy values, as represented by % deviation (smaller is better), were lower than 20% at three tested concentration levels for most signature peptides but the accuracy was less (29.5% at maximum) for the signature peptides of CYP2C19, UGT1A1 and UGT1A4. Imprecision values, as represented by %RSD (smaller is better), in both intra- and inter-day determinations were below 21.5% in samples at all three concentration levels.
Currently, isotope-labeled peptides were commonly used to overcome the matrix effects for protein quantification. An alternative to isotope-labeled peptides is the use of the standard addition method to measure the matrix effects. In this study, eight samples were randomly selected as test samples to evaluate the accuracy and matrix effect. Pre-determined amount of external standard peptides were carefully added to these eight samples, and the total amounts of each signature peptide in the samples were then determined. Spiked amount of peptides were calculated by subtracting the amount of peptides originally contained in human liver microsomes from that in the spiked samples. Then the calculated amounts of spiked peptides were compared with their pre-determined (i.e., externally added) amounts (Figure 1). As shown in Table V, the inaccuracy values of most target peptides were lower than 18%, but inaccuracy of CYP2A6, CYP2C9 and CYP2D6 in one of eight samples were slightly higher than 18% (22%, 24% and 27%, respectively). The results showed that accuracies of these determinations were in acceptable ranges [37], suggesting that the matrix effect could be accounted for, by using the current method of analysis (i.e., standard addition).
Fig. 1.

Overlaps of three MRM chromatograms of a digested individual human liver microsomes, standard calibrant and the digested HLMs spiked with the calibrant.
Table V. Validation for LC-MS/MS quantification of protein amount of CYPs and UGTs using standard addition method.
The accuracies of eight individuals were analyzed.
| Isoforms | Amount in nHLMs (mean ± SD, n=8) [pmol / sample] | Spiked Amount of Peptide [pmol / sample] | Calculated Amount of Spiked Peptide [pmol / sample] | Inaccuracy [%Deviation] |
|---|---|---|---|---|
| CYP1A2 | 2.5±0.5 | 2.9 | 2.9±0.2 | −11% ~ 8% |
| CYP2A6 | 2.5±1.4 | 3.9 | 3.6±0.3 | −22% ~ 2% |
| CYP2B6 | 0.1±0.05 | 0.8 | 0.7±0.05 | −15% ~ 4% |
| CYP2C8 | 6.7±3.8 | 9.4 | 9.1±0.6 | −15% ~ 4% |
| CYP2C9 | 10.1±5.1 | 13.4 | 11.6±1.0 | −24% ~ −3% |
| CYP2C19 | 0.5±1.0 | 2.2 | 2.4±0.1 | −1% ~ 16% |
| CYP2D6 | 1.5±0.9 | 2.3 | 2.0±0.2 | −27% ~ −4% |
| CYP2E1 | 8.4±2.1 | 22.1 | 21±1.6 | −17% ~ 4% |
| CYP3A4/3A43 | 7.0±5.0 | 11.4 | 11.5±0.9 | −9% ~ 11% |
| CYP3A43 | <0.01±0.0 | 1.0 | 1.0±0.1 | −1% ~ 13% |
| UGT1A1 | 1.4±0.5 | 3.4 | 3.3±0.2 | −16% ~ 1% |
| UGT1A4 | 4.3±1.8 | 14.6 | 14.1±1.0 | −13% ~ 7% |
| UGT1A6 | 1.2±0.7 | 3.7 | 3.4±0.1 | −18% ~ −4% |
| UGT1A9 | 2.0±1.1 | 7.5 | 7.1±0.5 | −14% ~ 3% |
| UGT2B7 | 2.8±1.5 | 5.4 | 5.8±0.4 | −7% ~ 16% |
To establish a reliable and efficient sample preparation, the length (10–60min) of protein denaturation by heat and the amount of trypsin used (1:20–1:100) were optimized, and a 10 min denaturation at 95°C and trypsinization with ration of 1:50 (trypsin to protein) was found to give the best results (data has been reported) [20]. Optimum digestion time was also determined by comparing recombinant CYP enzymes digested for 2–16 hours, and the result showed that 4 hours was the optimum digestion time (Figure 8). The same optimum digestion time was reported previously when optimizing for UGT enzymes [15]. It is worth noting that trypsinization is assumed to be 100% for quantifying proteins by using LC-MS/MS. Other than optimizing the conditions for trypsinization (duration of tryptic digestion and trypsin concentration), it is difficult to examine the efficiency of the reaction. It is also assumed that there are no protein losses during denaturation and reduction. Since the signature peptides were added prior to digestion and SPE to compensate for possible peptide losses during these steps, loss of peptide would mean under calculation of protein concentration.
Fig. 8.
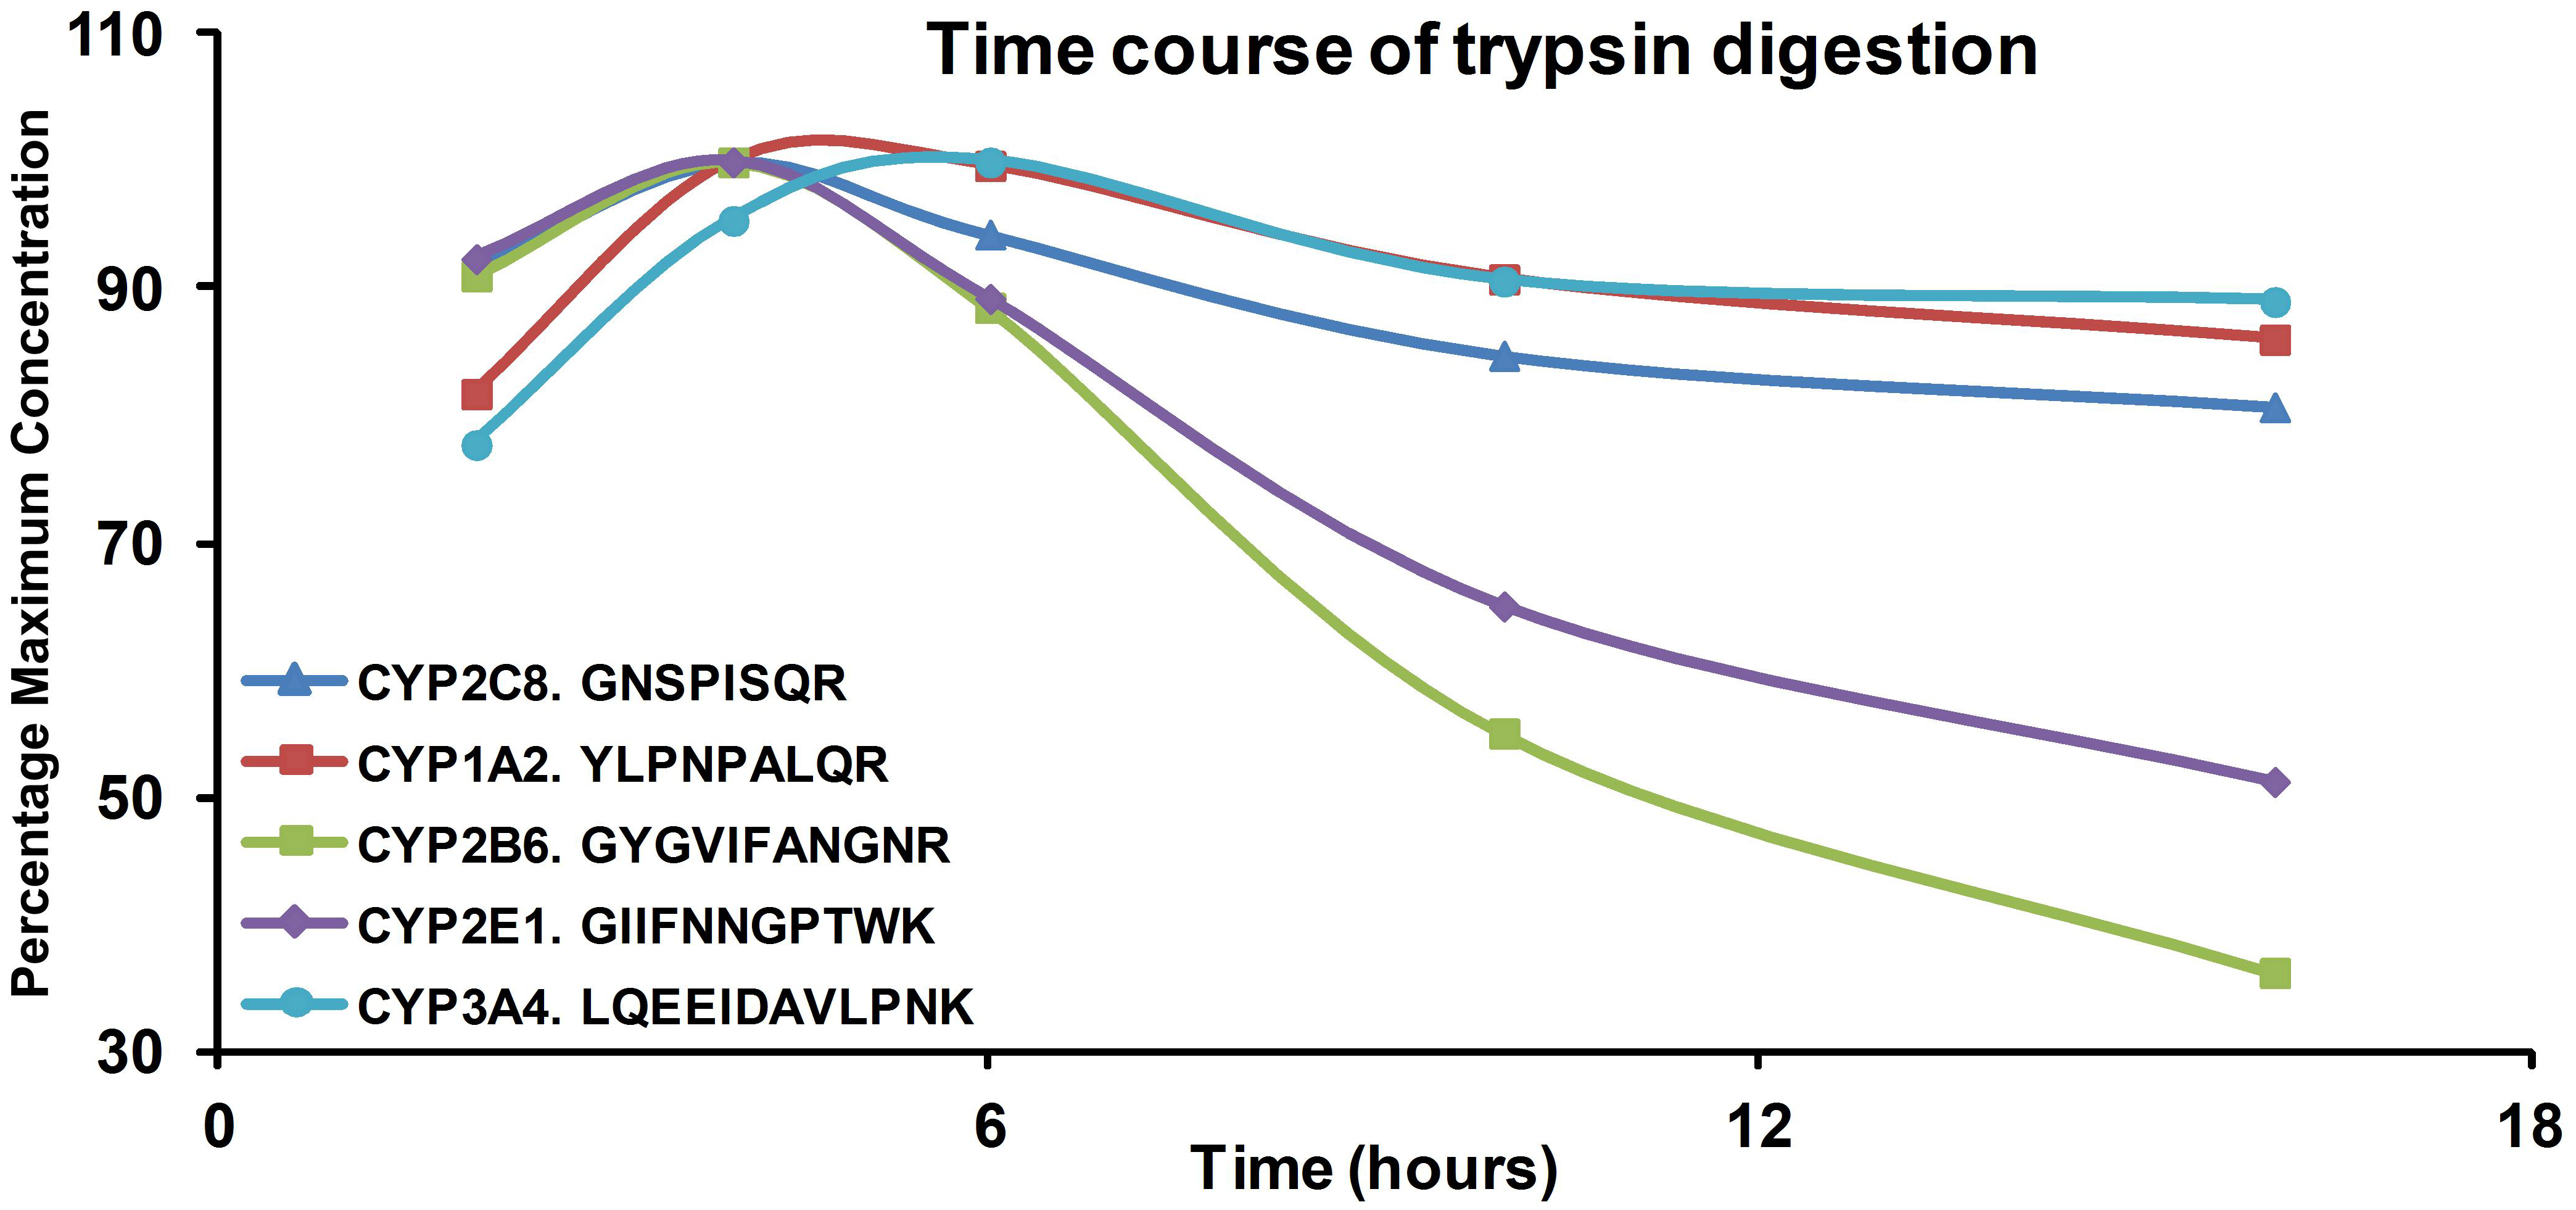
Digestion time profiles for signature peptides of CYP isoforms in recombinant CYP enzymes. Values shown represent percentages of the maximum concentration for each peptide.
3.3. Enzyme expression profiles of CYPs and UGTs in reference human liver microsomes
Protein expression levels of 9 CYPs and 5 UGTs were determined in reference human liver microsomes (rHLMs-pooled, purchased from BD Biosciences). As shown in Table VI, CYP2E1 and UGT1A4 showed the highest expression levels of the measured CYP and UGT enzymes with a protein amount of 95.6 and 28.2 pmol/mg protein, respectively. CYPs in rHLMs-pooled were expressed in the following order: CYP2E1 > CYP2C9 > CYP2C8 > CYP3A4 > CYP2A6 > CYP1A2 > CYP2D6 > CYP2B6 > CYP2C19, while the sequence for UGTs was UGT1A4 > UGT1A1 > UGT2B7 > UGT1A9 > UGT1A6. The previously reported ranks of the expression level of these CYP or UGT isoforms were comparable with the order above (Table VII), suggesting that our method of analysis was as accurate and precise as previously published methods.
Table VI. Protein expression levels of CYPs and UGTs in human liver microsomes prepared from pericarcinomatous tissues of donors with HBV-related HCC.
The protein amount of each isoform was determined in microsomes from 15 donors. Each value represents the mean±S.D. (n=15).
| Isoforms | rHLMs-pooled | nHLMs-pooled | Protein Amount in nHLMs-individual | |||||
|---|---|---|---|---|---|---|---|---|
| Mean | S.D. | Max | Min | Max/Min | 95% CIe | |||
| pmol/mg protein | ||||||||
| CYP1A2 | 16.1 (5%)a | 30.8 | 39.4 (7%) | 13.0 | 59.1 | 11.5 | 5.1 | 32.3~46.6 |
| CYP2A6 | 30.7 (10%) | 20.4 | 30.5 (6%) | 21.9 | 76.1 | 6.5 | 11.8 | 18.3~42.6 |
| CYP2B6 | 5.5 (2%) | 1.7 | 1.9 (0.4%) | 1.3 | 4.2 | <0.4d | >11.1 | 1.2~2.7 |
| CYP2C8 | 43.0 (13%) | 69.5 | 91.1 (17%) | 57.2 | 254.7 | 30.2 | 8.4 | 59.5~122.8 |
| CYP2C9 | 67.4 (21%) | 111.5 | 149.6 (28%) | 72.9 | 350.0 | 55.9 | 6.3 | 109.3~190.0 |
| CYP2C19 | 4.9 (2%) | 4.9 | 7.3 (1%) | 13.2 | 50.0 | <1.2 | >41.7 | 1.2~14.6 |
| CYP2D6 | 15.0 (5%) | 14.1 | 21.0 (4%) | 13.8 | 55.5 | 3.5 | 15.8 | 13.4~28.7 |
| CYP2E1 | 95.6 (30%) | 92.1 | 108.3 (20%) | 48.0 | 212.6 | 39.1 | 5.4 | 81.7~134.9 |
| CYP3A4c | 42.6 (13%) | 72.8 | 89.6 (17%) | 68.8 | 287.7 | 20.4 | 14.1 | 51.5~127.7 |
| UGT1A1 | 21.7 {23%}b | 22.0 | 23.1 {15%} | 8.4 | 39.0 | 9.4 | 4.2 | 18.5~27.7 |
| UGT1A4 | 28.2 {30%} | 54.4 | 56.5 {36%} | 36.0 | 126.4 | 12.6 | 10.0 | 36.6~76.4 |
| UGT1A6 | 12.0 {13%} | 12.2 | 14.7 {9%} | 10.2 | 41.0 | 3.9 | 10.4 | 9.1~20.4 |
| UGT1A9 | 12.6 {13%} | 22.7 | 24.4 {16%} | 19.1 | 61.5 | 3.7 | 16.7 | 13.8~35.0 |
| UGT2B7 | 21.0 {22%} | 32.3 | 37.2 {24%} | 26.4 | 103.2 | 2.7 | 38.6 | 22.6~51.9 |
Percentage of total amount of nine CYP isofomrs.
Percentage of total amount of five UGT isoforms.
As CYP3A43 expressed lower than the LLOQ (< 0.2 pmol/ mg microsomal protein) in all samples, the protein expression level of CYP3A4 was regarded as the same value with CYP3A4/3A43.
When the protein amount was lower than the LLOQ, the value was taken as the amount of LLOQ.
95% CI represents the 95% confidence interval.
Table VII.
Comparison of CYP and UGT isoform amounts in multiple reference human liver microsomes
| Isoforms | Amounts in rHLMs reported by other authors | present study | ||
|---|---|---|---|---|
| Kawakami [16] | Fallon [24] | Harbourt [28] | ||
| CYP1A2 | 17.7 (7)a | 16.6 (6) | ||
| CYP2A6 | 49.2 (4) | 30.7 (5) | ||
| CYP2B6 | 6.86 (8) | 5.5 (8) | ||
| CYP2C8 | 29.3 (5) | 43.0 (3) | ||
| CYP2C9 | 80.2 (1) | 67.4 (2) | ||
| CYP2C19 | 3.64 (9) | 4.9 (9) | ||
| CYP2D6 | 11.5 (6) | 15.0 (7) | ||
| CYP2E1 | 51.3 (3) | 95.6 (1) | ||
| CYP3A4 | 64.0 (2) | 42.6 (4) | ||
| UGT1A1 | 31.7 {3}b | 29.1 | 21.7 {2} | |
| UGT1A4 | 41.8 {2} | 6.2 | 28.2 {1} | |
| UGT1A6 | 7.8 {5} | 6.4 | 12.0 {5} | |
| UGT1A9 | 21.8 {4} | 22.2 | 12.6 {4} | |
| UGT2B7 | 67.7 {1} | 21.0 {3} | ||
Rank-orders of the expression level of each isoform of CYP enzymes.
Rank-orders of the expression level of each isoform of UGT enzymes.
3.4. Enzyme expression profiles of CYPs and UGTs in microsomes prepared from pericarcinomatous tissues of HCC patients
The expression levels of CYPs and UGTs were similarily determined in nHLMs-individual and nHLMs-pooled prepared from pericarcinomatous tissues. As shown in Table VIII, All the isoforms of CYPs and UGTs could be quantified in 15 samples of nHLMs-individual, except for CYP2B6 (undetectable in 4 samples) and CYP2C19 (undetectable in 10 samples). When comparing the average protein amounts of CYP and UGT isoforms in pericarcinomatous tissues of 15 individuals (Table VI), we found that CYP2C9 (149.6±72.9 pmol/mg microsomal protein) and UGT1A4 (56.5±36.0 pmol/mg microsomal protein) showed the highest expression levels. Overall, CYPs were expressed in the following rank-order: CYP2C9 (rank 1), CYP2E1, CYP2C8, CYP3A4, CYP1A2, CYP2A6, CYP2D6, CYP2C19, CYP2B6 (rank 9). We compared the expression level of each CYP isoform against other 8 isoform and the results were summarized in Table IX. Among the most important drug metabolizing enzymes such as CYP2C9, CYP3A4, CYP2D6 and CYP2C19, CYP2C9 was expressed at significantly higher level than CYP1A2, 2A6, 2D6, 2C19 and 2B6. CYP3A4 was expressed at significant higher level than CYP2D6, 2C19 and 2B6. CYP2D6 was expressed at significantly lower level than CYP2C9, 2E1, 2C8 and 3A4. CYP2C19 was also expressed at significantly lower level than CYP2C9, 2E1, 2C8 and 3A4.
Table VIII.
Summary of nine CYPs and UGTs expression level in pericarcinomatous tissues and tumor tissues of 15 individuals with HBV-related HCC
| Isoforms | N+a | T+b | N/Tc | N/Td (Avg.) | N/Te (pooled) | ||||
|---|---|---|---|---|---|---|---|---|---|
| <1 | =1 | >1 | >3 | >10 | |||||
| CYP1A2 | 15 (100%) | 8 (53%) | 0 | 0 | 0 | 3 (20%) | 12 (80%) | 20.5 | 28.5 |
| CYP2A6 | 15 (100%) | 6 (40%) | 2 (13%) | 0 | 1 (7%) | 3 (20%) | 9 (60%) | 3.4 | 1.7 |
| CYP2B6 | 11 (73%) | 1 (7%) | 0 | 5 (33%) | 0 | 0 | 10 (67%) | 4.2 | >4.3 |
| CYP2C8 | 15 (100%) | 12 (80%) | 0 | 0 | 2 (13%) | 3 (20%) | 10 (67%) | 7.5 | 8.5 |
| CYP2C9 | 15 (100%) | 15 (100%) | 0 | 0 | 3 (20%) | 5 (33%) | 7 (47%) | 6.2 | 8.2 |
| CYP2C19 | 5 (33%) | 0 (0%) | 0 | 10 (67%) | 0 | 0 | 5 (33%) | >6.8 | >4.6 |
| CYP2D6 | 15 (100%) | 15 (100%) | 0 | 0 | 3 (20%) | 9 (60%) | 3 (20%) | 4.7 | 4.7 |
| CYP2E1 | 15 (100%) | 13 (87%) | 0 | 1 (7%) | 3 (20%) | 1 (7%) | 10 (67%) | 3.7 | 5.8 |
| CYP3A4 | 15 (100%) | 8 (53%) | 0 | 0 | 1 (7%) | 3 (20%) | 11 (73%) | 18.2 | 16.7 |
| UGT1A1 | 15 (100%) | 15 (100%) | 0 | 1 (7%) | 3 (20%) | 10 (67%) | 1 (7%) | 2.5 | 3.3 |
| UGT1A4 | 15 (100%) | 13 (87%) | 0 | 1 (7%) | 3 (20%) | 5 (33%) | 6 (40%) | 4.2 | 4.2 |
| UGT1A6 | 15 (100%) | 15 (100%) | 7 (47%) | 5 (33%) | 2 (14%) | 1 (7%) | 0 | 0.6 | 0.5 |
| UGT1A9 | 15 (100%) | 15 (100%) | 3 (20%) | 4 (27%) | 3 (20%) | 5 (33%) | 0 | 1.8 | 1.9 |
| UGT2B7 | 15 (100%) | 15 (100%) | 0 | 0 | 3 (20%) | 3 (20%) | 9 (60%) | 6.6 | 6.9 |
Number (percentage) of positive samples prepared from pericarcinomatous tissues in which the target protein can be detected.
Number (percentage) of positive samples prepared from tumor tissues in which the target protein can be detected.
Number (percentage) of patients with certain fold change (<1,=1,>1,>3 or >10-fold) of protein amount in their tumor tissues compared with matched pericarcinomatous tissues.
Variations in average expression levels of CYPs or UGTs in 15 tumor tissues compared with pericarcinomatous tissues.
Variations in expression levels of CYPs or UGTs in tHLMs-pooled compared nHLMs-pooled.
Table IX.
Comparison of the average expression level of each CYP isoform in 15 donors against other eight isoforms
| CYP | 2A6 | 2B6 | 2C8 | 2C9 | 2C19 | 2D6 | 2E1 | 3A4 | ||||||||||||||||
|---|---|---|---|---|---|---|---|---|---|---|---|---|---|---|---|---|---|---|---|---|---|---|---|---|
| N | Ta | N | T | N | T | N | T | N | T | N | T | N | T | N | T | |||||||||
| 1A2 | -b | - | 0.02c | - | - | - | 0.02 | 0.03 | - | - | - | - | - | - | - | - | ||||||||
| 2A6 | - | - | - | - | 0.01 | - | - | - | - | - | 0.02 | - | - | - | ||||||||||
| 2B6 | 0.01 | 0.01 | 0.01 | 0.01 | - | - | - | 0.01 | 0.01 | 0.01 | 0.01 | - | ||||||||||||
| 2C8 | - | - | 0.01 | 0.01 | 0.02 | - | - | - | - | - | ||||||||||||||
| 2C9 | 0.01 | 0.01 | 0.01 | - | - | - | - | - | ||||||||||||||||
| 2C19 | - | 0.01 | 0.01 | 0.01 | 0.01 | - | ||||||||||||||||||
| 2D6 | 0.01 | - | 0.04 | - | ||||||||||||||||||||
| 2E1 | - | - | ||||||||||||||||||||||
N denotes HLMs prepared from pericarcinomatous tissue; T denotes HLMs prepared from tumor tissue.
no statistically significant difference (p>0.05).
p value was shown when a significant difference was observed.
The expression levels of measured UGT isoforms were rank-ordered as UGT1A4 (rank 1), UGT2B7, UGT1A9, UGT1A1, UGT1A6 (rank 5). UGT1A4 was expressed at significantly higher level than UGT1A1 and 1A6 (Table X).
Table X.
Comparison of the average expression levels of each UGT isoform in 15 donors against other four isoforms
| UGT | 1A4 | 1A6 | 1A9 | 2B7 | |||||||
|---|---|---|---|---|---|---|---|---|---|---|---|
| N | Ta | N | T | N | T | N | T | ||||
| 1A1 | 0.03c | -b | - | - | - | - | - | - | |||
| 1A4 | 0.01 | - | - | - | - | - | |||||
| 1A6 | - | - | - | 0.01 | |||||||
| 1A9 | - | - | |||||||||
N denotes HLMs prepared from pericarcinomatous tissue; T denotes HLMs prepared from tumor tissue.
no statistically significant difference (p>0.05).
p value was shown when a significant difference was observed.
Among the measured CYPs isoforms, the greatest inter-individual variability in protein expression levels was observed for CYP2C19 (more than 41.7-fold). Expression levels of CYP2A6, CYP2B6, CYP2D6 and CYP3A4 varied over 10-fold, while CYP1A2, CYP2E1, CYP2C9 and CYP2C8 varied from 5.1 to 8.4 fold among 15 individuals. Among the five UGTs isoforms, UGT2B7 exhibited the greatest inter-individual differences in protein expression level, with a 38.6-fold difference between the donors, followed by UGT1A9, UGT1A6 and UGT1A4 with a variability of 16.7-, 10.4- and 10.0-folds, respectively. In contrast, expression level of UGT1A1 was more stable, with a 4.2-fold difference between individuals (Table VI). The variability of protein expression of the 5 UGT isforms determined in the present study is comparable with the mRNA expression reported previously [21].
An approach to validate the quantification results was to compare the average of individual samples with pooled microsomes (equal amount of protein from each individual) derived from these individuals (equal values were expected). Two samples of nHLM-pooled, prepared as a mixture of all of the 15 HLMs samples made with pericarcinomatous tissues gave results nearly identical to the average of the individual microsomes with the exception of CYP1A2, which fell out of the 95% confidence interval (Table VI).
3.5. Protein expression profiles of CYPs and UGTs in microsomes prepared from tumor tissues of HCC patients
Protein expression levels of CYPs and UGTs were also determined in 15 HCC tumor microsomes. As shown in Table VIII, CYP2C9, CYP2D6, UGT1A1, UGT1A6, UGT1A9 and UGT2B7 were unequivoclly expressed in all tumor sample of HCC. CYP2A6 (6/15), CYP1A2 (8/15), CYP3A4 (8/15), CYP2C8 (12/15), CYP2E1 (13/15) and UGT1A4 (13/15) could be detected in 40–87% of all the tumors, while CYP2C19 was mostly not detectable (lower than 1.1 pmol/mg microsomal protein), and CYP2B6 could be detected in only 1 of the 15 samples.
When comparing the average protein amounts of 9 CYP and 5 UGT isoforms in tumor tissues of 15 individuals (Table XI), we found that CYP2E1 (29.6±48.9 pmol/mg microsomal protein) and UGT1A6 (21.8±74.1 pmol/mg microsomal protein) showed the highest expression levels. Overall, CYPs were expressed in the following rank-order: CYP2E1 (rank 1), CYP2C9, CYP2C8, CYP2A6, CYP3A4, CYP2D6, CYP1A2, CYP2B6 (rank 8). The expression level of measured UGT isoforms were rank-ordered as UGT1A6 (rank 1), UGT1A9, UGT1A4, UGT1A1, UGT2B7 (rank 5). We compared the expression level of each CYP or UGT isoform against other isoforms (Table IX and X). The results showed that CYP2C19 was expressed at significantly lower level CYP2E1, 2C9, 2C8 and 2D6. CYP2C9 was expressed at significantly higher level than CYP2B6 and 1A2 in tumor tissue. UGT2B7 was expressed lower than UGT1A6 significantly. No significant difference was observed between other isoforms because of the high inter-subject variations of protein level in tumor tissues. As shown in Table XI, among the measured CYPs isoforms, expression levels of CYP2D6 and CYP2B6 varied 18.8- and over 3.6-fold, respectively. The other isoforms varied more than 25-fold among 15 individuals. Among the five UGT isoforms, UGT1A4 exhibited the greatest inter-individual differences in protein expression level, with more than 240-fold difference between the donors, followed by UGT2B7, UGT1A1, UGT1A9 and UGT1A6 with a variability of 112.5, 28.1, 24.0, and 20.7 fold, respectively. Two samples of tHLM-pooled, prepared as a mixture of 15 HLMs of tumor tissues were also determined and the results were similar to the average amounts in 15 tumor tissues (Table XI).
Table XI. Protein expression levels of CYPs and UGTs in human liver microsomes prepared from tumor tissues of donors with HBV-related HCC.
The protein amount of each isoform was determined in microsomes from 15 donors. Each value represents the mean±S.D. (n=15).
| Isoforms | tHLMs-pooled | Protein Amount in tHLMs-individual | |||||
|---|---|---|---|---|---|---|---|
| Mean | S.D. | Max | Min | Max/Min | 95% CIe | ||
| pmol/mg protein | |||||||
| CYP1A2 | 1.1 | 1.9 (2%)a | 2.8 | 9.0 | <0.1 | >78.0d | 0.3~3.5 |
| CYP2A6 | 12.1 | 8.9 (10%) | 18.9 | 60.7 | <0.2 | >379.5 | 0.0~19.4 |
| CYP2B6 | <0.4 | 0.5 (1%) | 0.2 | 1.4 | <0.4 | >3.6 | 0.3~0.6 |
| CYP2C8 | 8.2 | 12.1 (14%) | 20.8 | 83.3 | <0.6 | >137.9 | 0.5~23.6 |
| CYP2C9 | 13.7 | 24.3 (28%) | 33.3 | 128.7 | 0.3 | 429.0 | 5.9~42.7 |
| CYP2C19 | <1.1 | <1.1 (—) | 0.0 | <1.1 | <1.1 | — | — |
| CYP2D6 | 3.0 | 4.5 (5%) | 3.3 | 12.6 | 0.7 | 18.8 | 2.6~6.3 |
| CYP2E1 | 15.9 | 29.6 (34%) | 48.9 | 172.1 | <0.5 | >315.1 | 2.6~56.8 |
| CYP3A4c | 4.4 | 5.0 (6%) | 5.4 | 16.9 | <0.2 | >70.3 | 1.9~7.9 |
| UGT1A1 | 6.8 | 9.1 {14%}b | 8.4 | 27.7 | 1.0 | 28.1 | 4.5~13.8 |
| UGT1A4 | 13.1 | 13.5 {21%} | 16.2 | 52.6 | <0.2 | >241.7 | 4.5~22.5 |
| UGT1A6 | 22.1 | 23.1 {36%} | 21.8 | 74.1 | 3.6 | 20.7 | 11.0~35.2 |
| UGT1A9 | 12.0 | 13.3 {21%} | 11.8 | 37.5 | 1.6 | 24.0 | 6.7~19.8 |
| UGT2B7 | 4.7 | 5.6 {9%} | 8.2 | 30.9 | 0.3 | 112.5 | 1.0~10.1 |
Percentage of total amount of nine CYP isofoms.
Percentage of total amount of five UGT isoforms.
As CYP3A43 expressed lower than the LLOQ (< 0.2 pmol/ mg microsomal protein) in all samples, the protein expression level of CYP3A4 was regarded as the same value with CYP3A4/3A43.
When the protein amount was lower than the LLOQ, the value was taken as the amount of LLOQ.
95% CI represents the 95% confidence interval.
3.6. Comparision of CYP and UGT isoform amounts in tumors and machted pericarcinomatous tissues
The expression levels of 9 CYPs in tumor microsomes were compared against those in pericarcinomatous microsomes from the same individuals. As shown in Table VI and Table XI and Figure 2A, the expression level of the most important drug metabolizing CYP isoform CYP3A4 was drastically decreassed (from 89.6 to 5.0 pmol/mg protein, 18 fold) in every subject (Table VIII and Figure 3). The result of this decrease was that it went from a signficant contributor to overall CYP expression (17%) in pericarcinomatour tissue (Table VI) to minor contributor in overall CYP expression (6%) in tumor tissue (Table XI). Similarly, another important CYP isoform for drug metabolism, CYP2D6 was also significantly decreased in every subject but only by a more modest extent (4.7 fold) (Table VIII and Figure 3).
Fig. 2.
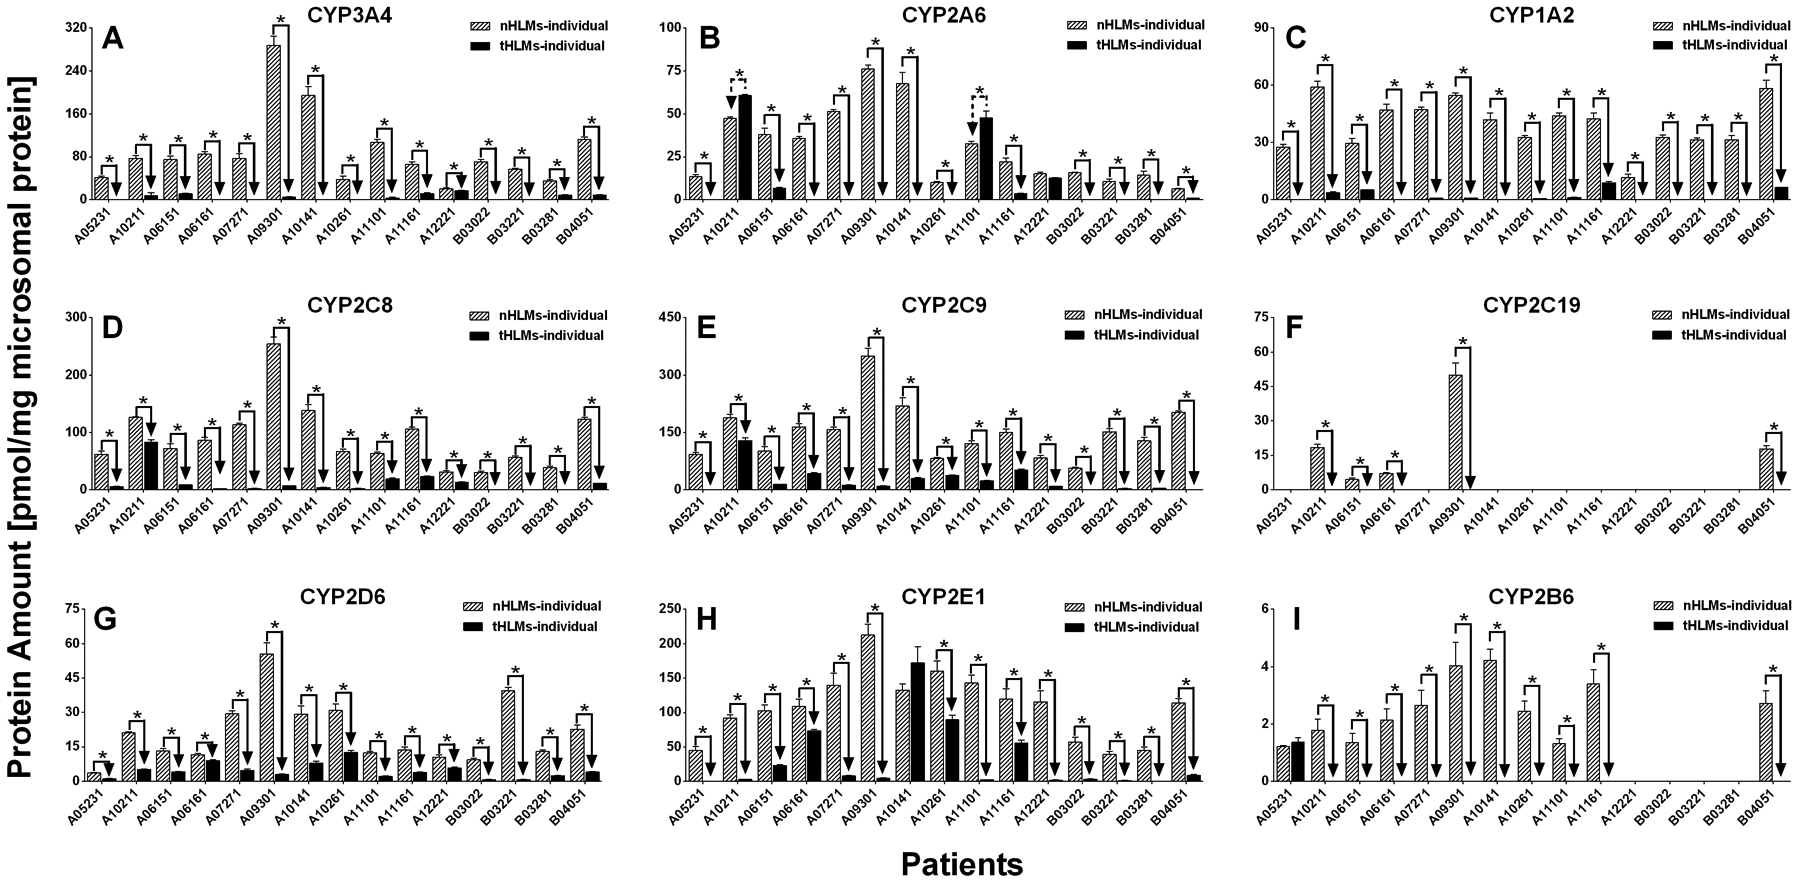
(A-I) Protein expression level of nine CYP isoforms in human liver microsomes prepared from tumor tissues (tHLMs-individual) and matched pericarcinomatous tissues (nHLMs-individual) of 15 patients with HCC. Each data point represents the average of two determinations using two MRM transitions, and data are presented as mean±SD. Paired-samples T-test was used for data analysis. “*” denotes statistical significance (p<0.05).
Fig. 3.

Average expression levels of nine CYPs in 15 tumor tissues and pericarcinomatous tissues. The error bar represents the mean±SD calculated from the protein amount of each isoform in 15 donors. Mann-Whitney U test was used for data analysis. “*” denotes statistical significance (p<0.05).
Among the most abundantly expressed CYP isoforms (i.e., top 3) which are CYP2C9 (most abundantly expressed), CYP2E1 (second most) and CYP2C8 (third most), all of them were expressed at significantly lower levels in tumors than in matched pericarcinomatous tissues of all 15 donors (except for CYP2E1 level in one matched pair, which showed no decrease). The difference was 6.2 fold for CYP2C9, 3.7 fold for CYP2C8, and 7.5 fold for CYP2C8 (Table VIII and Figure2–3).
Among the CYP isoforms most attributable to the carcinogenesis processes CYP1A2 CYP2E1, CYP2A6 and CYP3A4, CYP1A2 expression was drastically decreased by more than 20 fold with about 50% of the subjects (7 of 15) with level below LLOQ. This decrease is simialr to that of decrease in CYP3A4. In contract, CYP2A6 was decreased by more modest 3.4 fold and 2 in 15 subjects showed a increased level (p<0.05). This smaller decrease was similar to that of CYP2E1 (3.7 fold decrease) (Table VIII and Figure 2–3).
The expression level of examined UGTs in tumors and pericarcinomatous tissue from the same individuals were also compared. As shown in Table VIII and Figure 4, UGT2B7, UGT1A1 and UGT1A4 were expressed significantly lower in tumors of almost all subjects (14 or 15 out of 15 donors), and greater than 3-fold decrease were observed in more than 73% of subjects. On the other hand, expression levels of UGT1A9 were suppressed in 8 tumor tissues, overexpressed in 3 tumor tissues, and similarly expressed in 4. Furthermore, UGT1A6 was suppressed in 3 subjects, overexpressed in 7, and similarly expressed in 5. The amount of UGT1A9 was significantly decreased in pooled liver microsoms prepared form tumor tissues, while UGT1A6 was significantly increased (Figure 6B). However, there was no statistical difference between the average expression level, in 15 individuals, of UGT1A6 or UGT1A9 in tumor and pericarcinomatous tissues (Figure 5). This negative results may caused by the insufficient sample size (statistical power < 0.3), suggesting that a larger scale research should be performed to study the expression levels of UGT1A6 and UGT1A9 in HCC.
Fig. 4.

(A-E) Protein expression level of five UGT isoforms in human liver microsomes prepared from tumor tissues (tHLMs-individual) and matched pericarcinomatous tissues (nHLMs-individual) of 15 patients with HCC. Each data point represents the average of two determinations using two MRM transitions, and data are presented as mean±SD. Paired-samples T-test was used for data analysis. “*” denotes statistical significance (p<0.05).
Fig. 6.
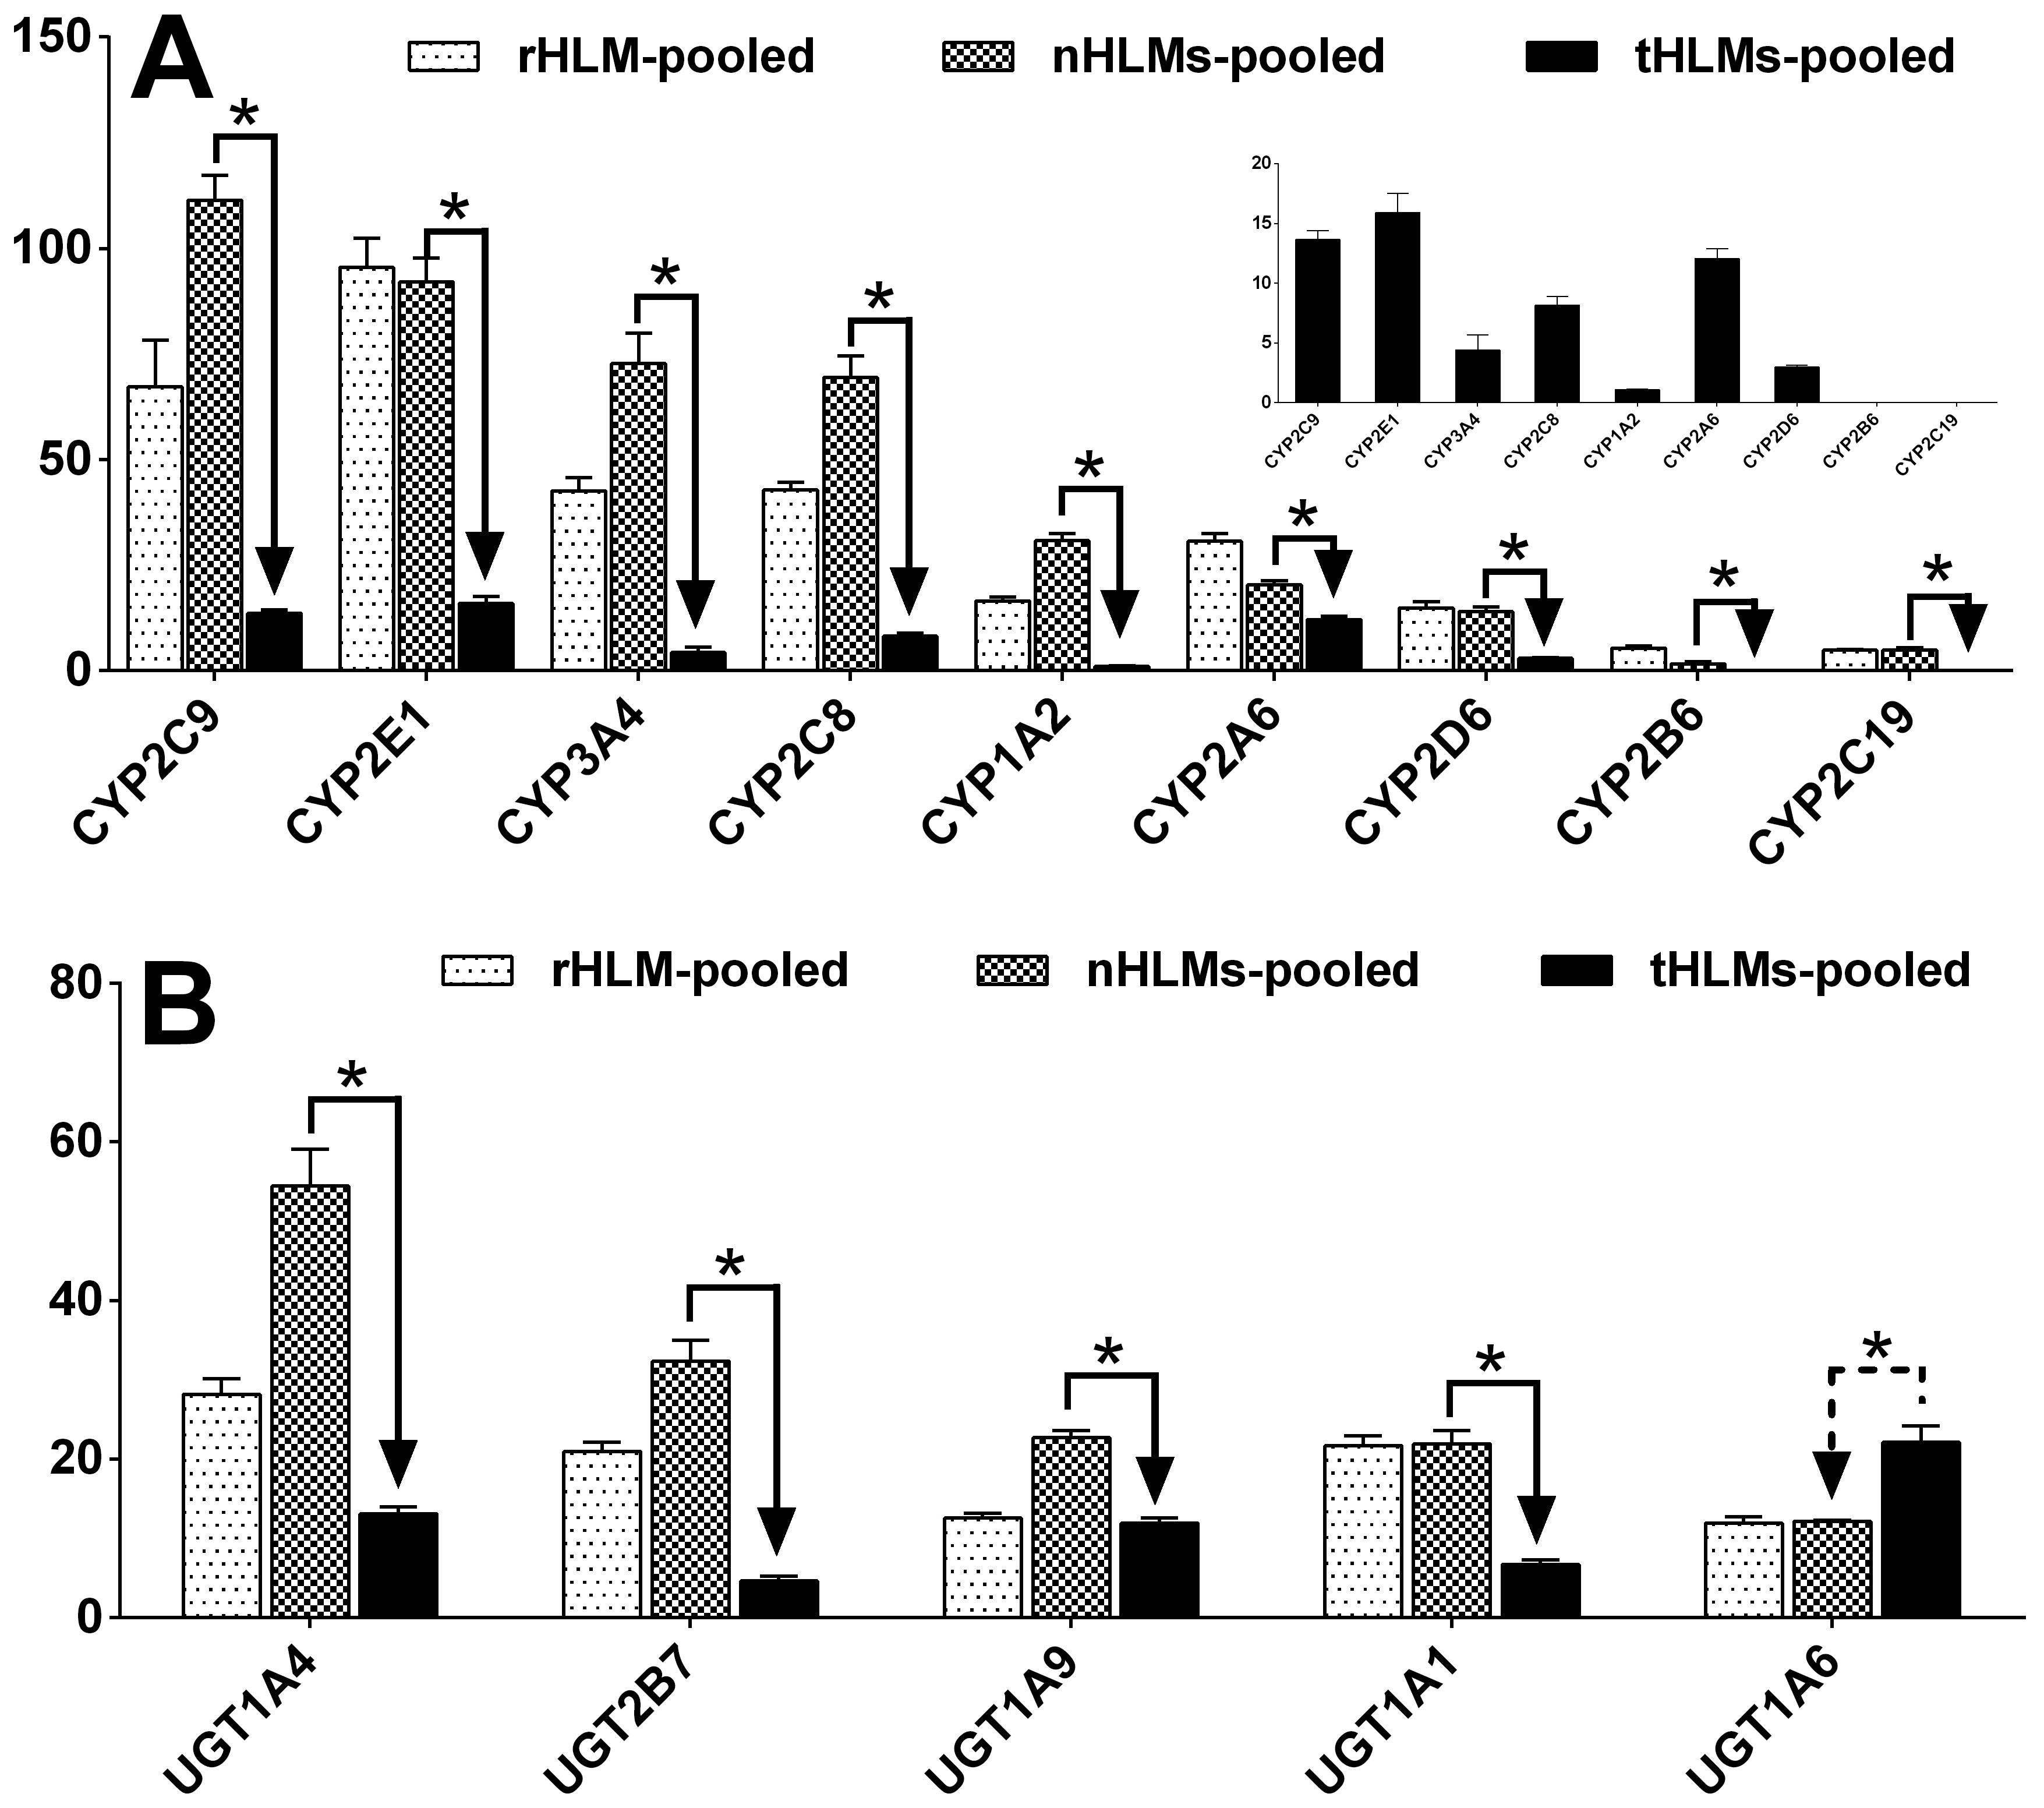
Protein expression levels of nine CYPs (A) and five UGTs (B) in rHLM-pooled, nHLMs-pooled and tHLMs-pooled. Each data point represents the average of two determinations using two MRM transitions, and data are presented as mean±SD. Paired-samples T-test was used for data analysis. “*” denotes statistical significance (p<0.05).
Fig. 5.
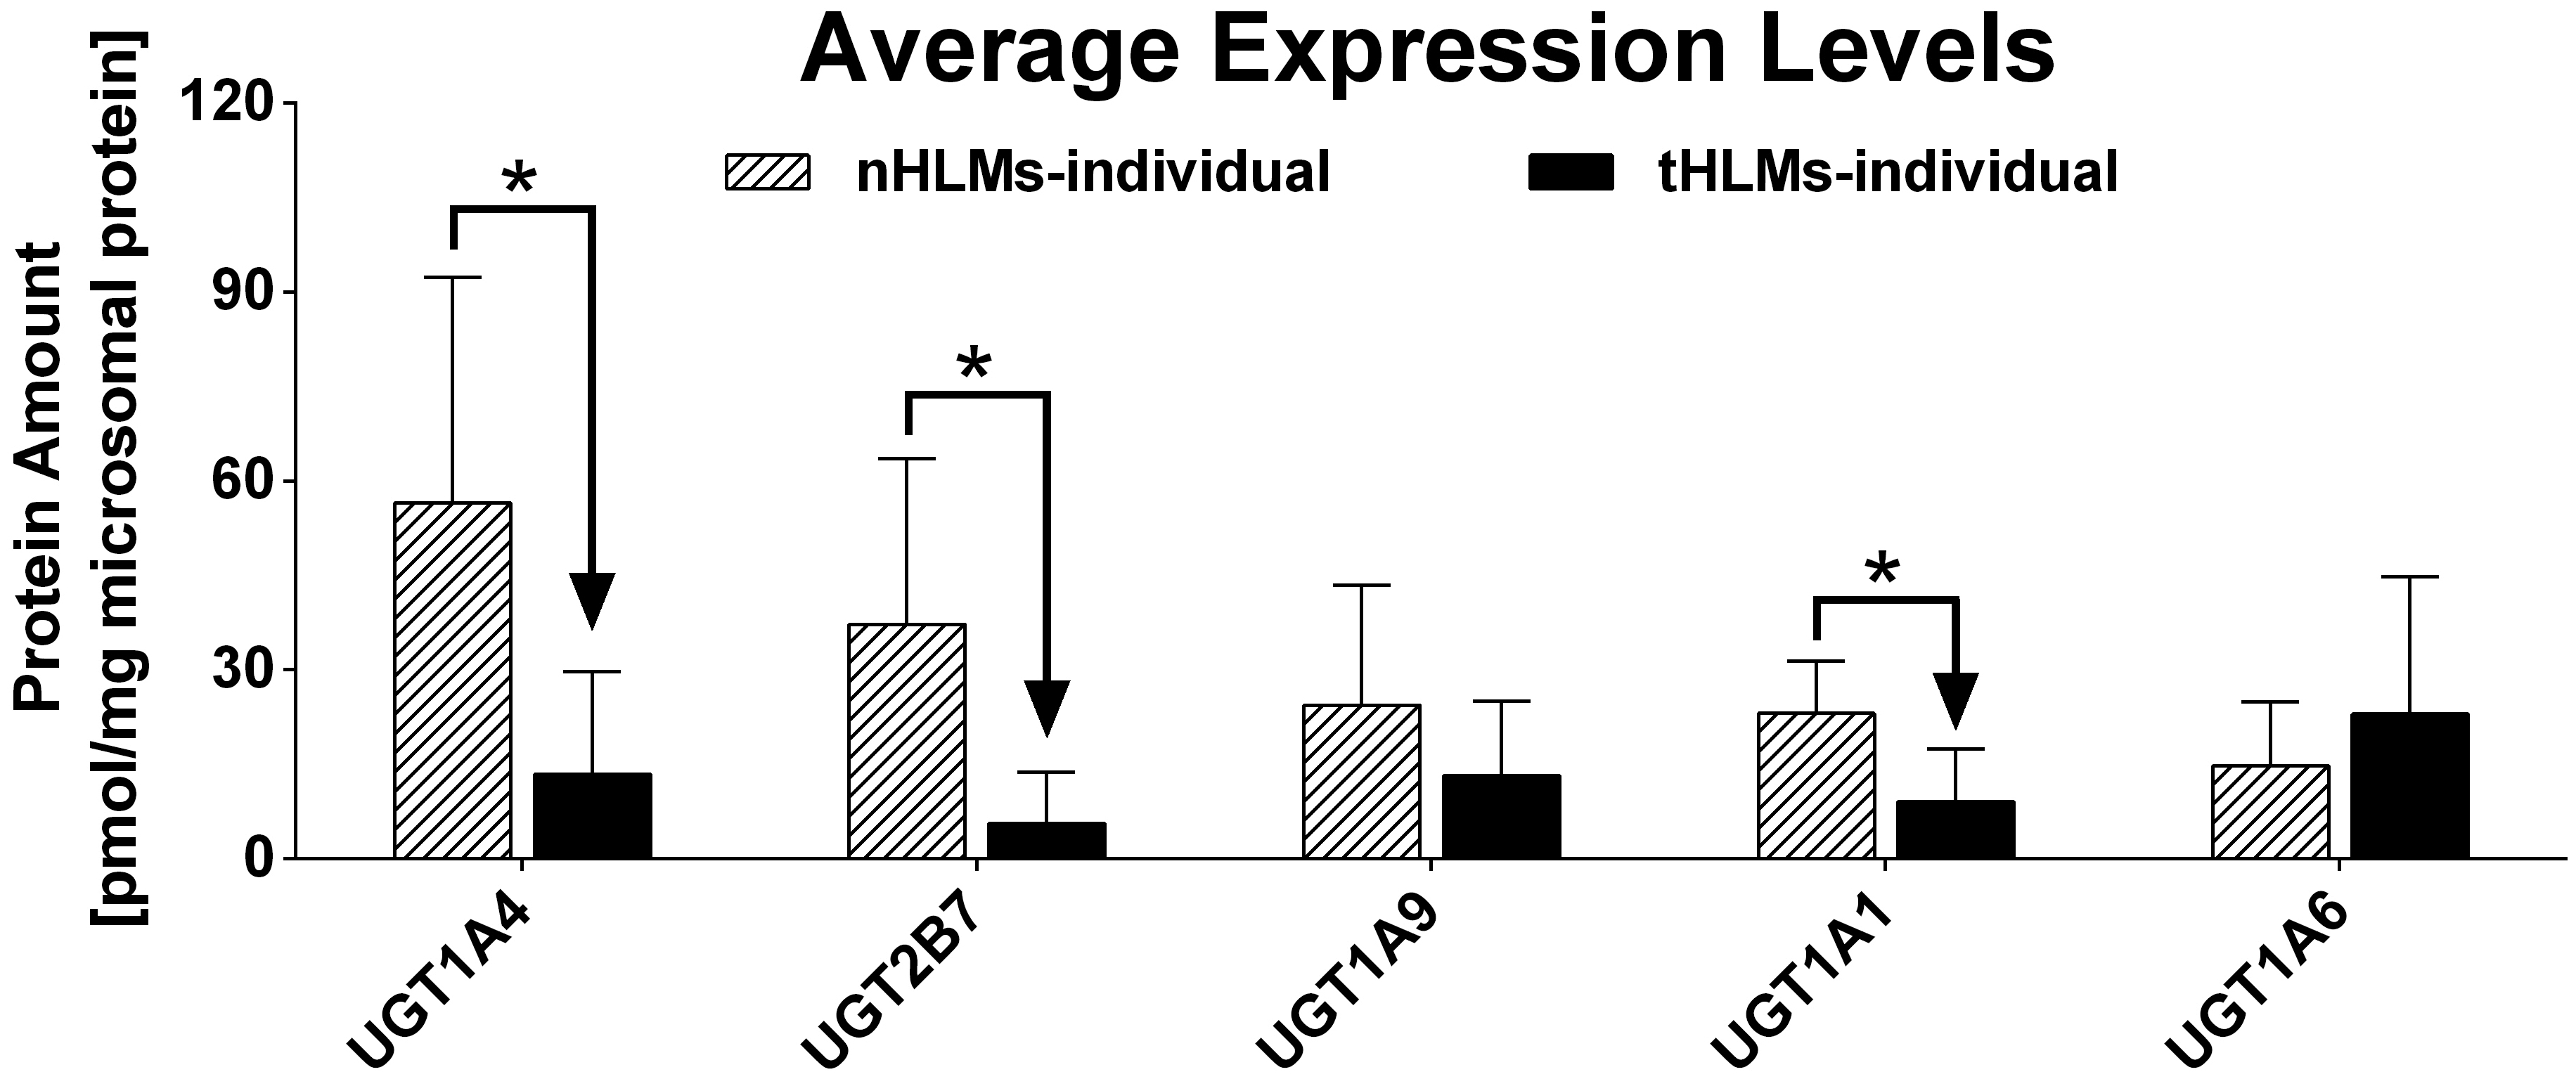
Average expression level of five UGTs in 15 tumor tissues and pericarcinomatous tissues. The error bar represents the standard deviation calculated from the protein amount of each isoform in 15 donors. Mann-Whitney U test was used for data analysis. “*” denotes statistical significance (p<0.05).
The most significant change in UGT isoform expression in tumor was the large difference in UGT1A4 expression levels between subjects, which went from a modest 10 fold difference to more than 241 fold difference (Table VI and Table XI). In addition, the differences in expression levels of other UGT isoforms were also increased in tumor tissues with second largest change in UGT1A1 (from 4.2 fold to 28.1 fold) followed by UGT2B7 (from 38.6 to 112.5 fold).
4. DISCUSSION
We, for the first time, found large differences in the absolute protein expression levels of the 9 CYPs and 5 UGTs in paired HCC tumors and pericarcinomatous tissues from 15 individuals. These differences (mostly down-regulation and sometimes drastic), which were detailed in Figure 2–5 as well as in Table VI, VIII and XI, provide strong evidence that profiling each individual subject’s metabolic enzyme expression levels using a LC-MS/MS method could provide useful biological signatures for better use of existing drugs and designing new drugs.
For example, our data revealed that most isoforms of CYPs were down-regulated during in tumor. Important drug metabolizing enzymes including CYP3A4, CYP2C8, CYP2C9, CYP2D6 were found to decrease over 3 times in tumor tissue of more than 80% patients (Table VIII). These enzymes have been found to be responsible for the metabolism of many anticancer drugs and analgesics and changes in their expression will affect the metabolism of drugs and influence the clinical outcome of chemotherapy. For example, sorafenib, the drug used as first-line treatment for HCC, is metabolically inactivated by CYP3A4 [22]. In our group of patients, 73% of subjects showed 10 fold or more decrease in the expression of CYP3A4. This should significantly reduce the metabolisation velocity of sorafenib and lead to its accumulation in tumor cells. In contrast, drugs in surrounding non-tumor tissues is expected to be inactivated rapidly. This effect may explain why sorafenib is better tolerated in patients (most common side effect is a skin problem called hand-food skin reaction) and is not asscociated with liver toxicities [23]. In contrast, the ability of these patients to clear or activate analgesics such as diazepam could be significantly decreased if the tumor mass becomes signficant in relation to the overall size of the liver.
Our data also showed that UGT1A1, UGT1A4 and UGT2B7 were significantly decreased in tumors in more than 93% patients (Table VIII). UGT1A1 catalyses the glucuronidation of many lipohilic endogenous substrates such as bilibrubin and estrogens as well as drugs such as SN-38 (an active metabolite of drug irinotecan) whereas UGT2B7 contribute significanlty to the overall availability and pharmacological effect of morphine, a commonly used analgics for relief of the pain in cancer patients undergoing surgery or in the terminal stage. In contrast, UGT1A4 is involved, almost exclusively in the N-glucuronidation reaction of many environmental carcinogens, and hence its downregulation in tumor is not surprising [24–26]. Because UGT1A1 plays a major role in the biliary excretion of bilirubin, and lessening in UGT1A1 expression could leads to a severe form of hyperbilirubinemia [27], our data suggest a higher risk for jaundice in patients with HCC (expecially those with large tumor mass) because of severe impairment in UGT1A1 activities in tumor tissues.
We were somewhat surprised by the increase in UGT1A6 activities in the tumor tissue in large percentage of subjects (47%). In fact, UGT1A6 in tumor was not down-regulated in 80% of subjects, and the average was actually 1.5 fold higher than pericarcinomatous tissue (Table VIII and Figure 5). The enhanced expression of UGT1A6 in tumor cell represents a potential therapeutic target, and these patients could potentially benefit from UGT1A6-based therapeutic interventions (e.g., UGT1A6-activated prodrugs). On the other hand, for patients with tumors overexpressing UGT1A6, durgs metabolized by UGT1A6 may be inactivated more rapidly in tumors than in non-tumor tissues, which represents a novel mechanism of resistance. UGT1A6 has been reported overexpressed in breast cancer cells and shown resistance to methotrexate [28], and therefore a similar mechanism of resistance may occur in HCC. Lastly, UGT1A6 is responsible for metabolizing endogenous serotonin, an important signal molecule. In contrast to UGT1A6, UGT2B7 levels were severely down-regulated in tumor tissue. This is somewhat surprising since it appears to be regulated by p53, which is upregulated in HCC [34–35].
Over the past 50 years, major advances in cancer research have been achieved with the advent of novel therapeutic regimens for more patient-specific therapies. However, the dual goals of tumor-selective targeting while minimizing normal cell toxicity have yet to be fully achieved. In this study, we developed a method that could potentially be used for individualized chemotherapy by determining the expression of metabolizing enzymes in individuals quickly before the treatment begins. This is because our study provides a comprehensive picture on the absolute protein expression of 9 major CYP and 5 UGT enzymes in HCC tumors and pericarcinomatous tissues. The mapped protein expression profile of these major phase I and II drug metabolizing enzymes in human hepatocellular carcinoma and pericarcinomatous tissues will help find out how to develop new and invidualized strategies for targeted therapy of HCC.
We believe that our method of analysis is fast and less expensive compared to earlier published methods and that it is of equal quality. With the exception of CYP2B6, the protein amounts of CYPs and UGTs in nHLMs-pooled were comparable to that in rHLMs-pooled (prepard from healthy livers of Caucasians) with maximal difference of ≈2 fold (Figure 6). This result indicated that the CYPs and UGTs may be expressed in normal ranges in pericarcinomatous tissues of HCC but a large sample size would help reaffirm this initial observation.
In the present study, we measured the absolute amounts of several most important CYP and UGT enzymes simultaniously in human liver microsomes using LC-MS/MS with label-free signature peptides, and rHLM-pooled (Caucasian dominated purchased from commercial source) was used as a reference control. The protein amounts of CYP1A2, 2A6, 2B6, 2C8, 2C9, 2C19, 2D6, and 3A4 in rHLM-pooled determined in this study were comparable with the reported values with a correlation coefficient of 0.922, while amounts CYP 2E1 were about 2-fold higher than those reported previously (Table VII and Figure 7A–B) [14, 29]. This difference may be caused by the difference in length of tryptic digestion time. The 4 hr digestion time, which was found to be the optimum digestion time [15], was used in this study, while 16 hr digestion time was used in earlier study which may have caused unexpected peptides degradation. Therefore, the optimal digestion used in the present study likely contributed to the higher reported values of target enzyme proteins in this study. Moreover, the protein expression level of 9 CYPs in reference microsomes determined in the present study was well correlated (correlation coefficient=0.700) with their mRNA expression level reported previously [30], but the earlier study did not [14].
Fig. 7.
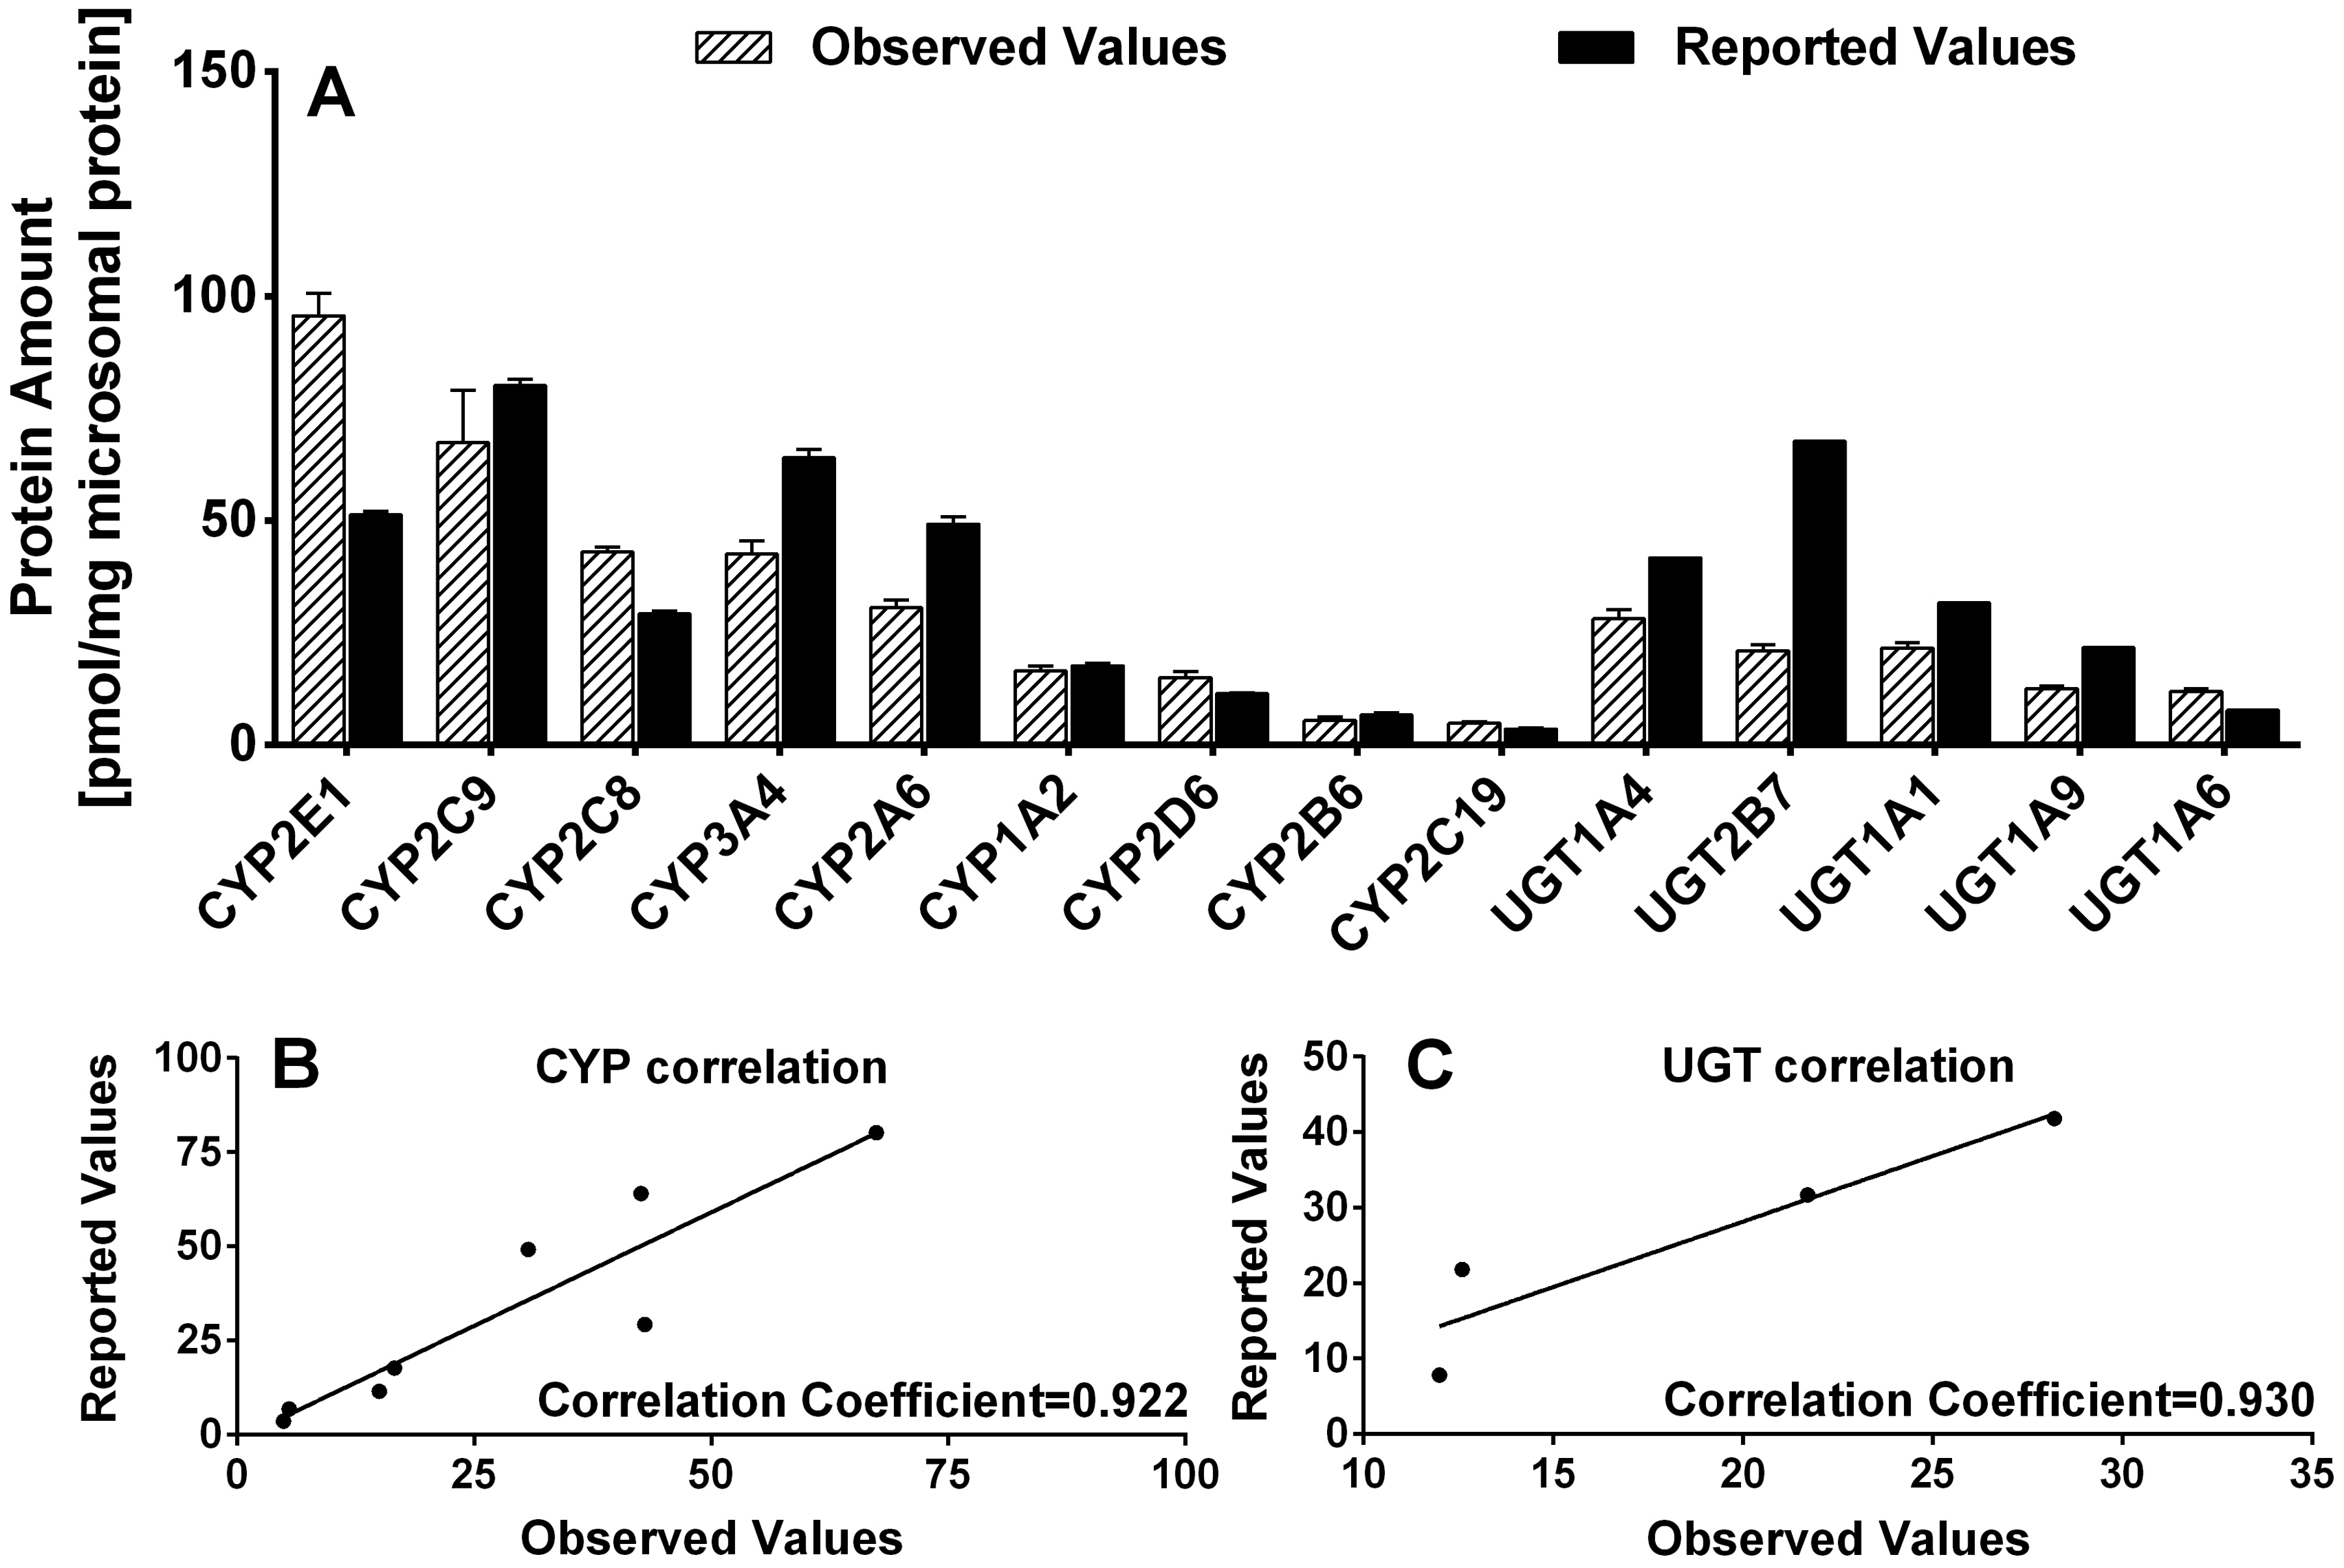
(A) A comparison of CYPs and UGTs expression levels in rHLMs-pooled observed in the present study (Observed Values) with values reported previously (Reported Values). (B) The correlation plots of the observed and reported values of nine CYP isoforms. (C) The correlation plots of the observed and reported values of four UGT isoforms.
The protein expression profiles of 5 UGT isoforms in reference human liver microsomes have also been previously quantified by LC/MS/MS with isotope-labeled peptides with the same digestion time as those used here [15]. The protein amounts of UGT1A1, 1A4, 1A6 and 1A9 in rHLM-pooled determined in this study were comparable (less than 2 fold difference) with the reported values with a correlation coefficient of 0.930, while amounts UGT2B7 were about 3-fold higher than those reported previously. (Figure. 7A and C). The reason for this difference was unknown. It was reported earlier that the use of different signature peptides could result in up to 2-fold differences in reported protein levels [16, 20]. Hence, the difference in signature peptides used might partially explain why our reported UGT values were different from those reported earlier.
The expression levels of CYPs in HLMs of 10 healthy Japanese subjects were quantified previously [14]. Although the expression levels of 9 CYP enzyme isoforms in pericarcinomatous tissues determined in the present study correlated well with reported values (correlation coefficient=0.893), the absolute amounts of these CYP enzymes in the Japanese subjects were much lower (6 to 12-fold) (Supplement Figure. S1). The higher expression levels reported here is unlikely due to HBV infection in our subjects, because the infection usually down-regulate the CYP expressions (although some isoforms were not affected) [13]. A somewhat negative correlation between the expression level of CYPs and age of humans was observed in the present study (correlation coefficients > 0.5, except for CYP2C19 and 2D6, data were not shown), consistent with an earlier report that there was a significant decline of CYP content after age 70 [31]. So the older ages of the 10 Japanese donors (age: 70±12 years) could contribute to the observed differences in protein expression values. In addition, the different procedures of samples prepairation mentioned below should also be taken into account.
5. CONCLUSION
Major CYP isoforms were found to be significantly and sometimes drastically down-regulated in the tumor as compared to the matched pericarcinomatous tissue. Although UGT isoforms were down-regulated less in percentage terms, they often become more variable in tumor. Because these CYP and UGT isoforms are important for the metabolism of drugs (anticancer and pain medication), carcinogens, and even endogenous substances (e.g., bilirubin), their changes may have serious implication in the clearance and detoxification capability of the liver. Taken together, these results indicate that a robust, reproducible and reliable LC-MS/MS method capable of simultaneously quantifying 9 or more CYPs and 5 or more UGTs in HLMs may be utilized to optimize chemotherapy for HCC patients.
Supplementary Material
Acknowledgements
This work was supported by grants from the Key International Joint Research Project of National Natural Science Foundation of China (81120108025) and the Central Platform Project from Department of Education of Guangdong Province to Dr. Zhongqiu Liu. MH was also supported by a grant from the National Institute of Health Grant, GM070737. TMY spent 6 month at University of Houston.
Abbreviations
- UGT
uridine 5’-diphospho-glucuronosyltransferases
- CYP
cytochrome P450
- UPLC
ultra performance liquid chromatography
- DP
declustering potential
- CE
collision energy
- CXP
collision cell exit potential
- HLMs
human liver microsomes
- rHLMs-pooled
reference human liver microsomes
- HCC
hepatocellular carcinoma
- HBV
hepatitis B virus
- nHLMs-individual
human liver microsomes prepared from pericarcinomatous tissue of a single donor with HCC.
- nHLMs-pooled
pooled human liver microsomes prepared from pericarcinomatous tissues of 15 donors, which contain same amount of donor microsomes from each subject
- tHLMs-individual
human liver microsomes prepared from tumor tissue of a single donor with HCC.
- tHLMs-pooled
pooled human liver microsomes prepared from tumor tissues of 15 donors, which contain same amount of donor microsomes from each subject.
- SPE
solid-phase extraction
References
- [1].Sharma RR. Enzyme Inhibition and Bioapplications In: Badal S, Shields M, Delgoda R, editors. Cytochrome P450 Enzyme Inhibitors, Nature InTech, 2012, p. 39–56. [Google Scholar]
- [2].Ruano G, Villagra D, Szarek B, Windemuth A, Kocherla M, Gorowski K, et al. Physiogenomic analysis of CYP450 drug metabolism correlates dyslipidemia with pharmacogenetic functional status in psychiatric patients. Biomark Med. 2011;5:439–49. [DOI] [PMC free article] [PubMed] [Google Scholar]
- [3].Liu J, Tawa GJ, Wallqvist A. Identifying Cytochrome P450 Functional Networks and Their Allosteric Regulatory Elements. PloS one. 2013;8:e81980. [DOI] [PMC free article] [PubMed] [Google Scholar]
- [4].Rowland A, Miners JO, Mackenzie PI. The UDP-glucuronosyltransferases: their role in drug metabolism and detoxification. Int J Biochem Cell Biol. 2013;45:1121–32. [DOI] [PubMed] [Google Scholar]
- [5].Special Issue: The 64th Annual Meeting of the American Association for the Study of Liver Diseases: The Liver Meeting 2013. HBV Epidemiology and Prevention. Hepatology. 2013;58:607A–26A. [Google Scholar]
- [6].Perz JF, Armstrong GL, Farrington LA, Hutin YJ, Bell BP. The contributions of hepatitis B virus and hepatitis C virus infections to cirrhosis and primary liver cancer worldwide. J Hepatol. 2006;45:529–38. [DOI] [PubMed] [Google Scholar]
- [7].Bisceglie AMD. Hepatitis B and Hepatocellular Carcinoma. Hepatology. 2009;49:S56–S60. [DOI] [PMC free article] [PubMed] [Google Scholar]
- [8].Hiyashi N, Popper H, Manns P, Hayashi N. Prevention of Progression in Chronic Liver Disease: An Update on SNMC (Stronger Neo-Minophagen C) In Honour of Hans Popper’s 100th Birthday: Springer; 2004. [Google Scholar]
- [9].Jemal A, Center MM, DeSantis C, Ward EM. Global patterns of cancer incidence and mortality rates and trends. Cancer Epidemiol Biomarkers Prev. 2010;19: 1983–907. [DOI] [PubMed] [Google Scholar]
- [10].Elbekai RH, Korashy HM, El-Kadi AO. The effect of liver cirrhosis on the regulation and expression of drug metabolizing enzymes. Curr Drug Metab. 2004;5:157–67. [DOI] [PubMed] [Google Scholar]
- [11].Congiu M, Mashford ML, Slavin JL, Desmond PV. UDP glucuronosyltransferase mRNA levels in human liver disease. Drug Metab Dispos. 2002;30:129–34. [DOI] [PubMed] [Google Scholar]
- [12].Fisher CD, Lickteig AJ, Augustine LM, Ranger-Moore J, Jackson JP, Ferguson SS, et al. Hepatic cytochrome P450 enzyme alterations in humans with progressive stages of nonalcoholic fatty liver disease. Drug Metab Dispos. 2009;37:2087–94. [DOI] [PMC free article] [PubMed] [Google Scholar]
- [13].IIZUKA N, OKA M, HAMAMOTO Y, MORI N, TAMESA T, TANGOKU A, et al. Altered Levels of Cytochrome P450 Genes in Hepatitis B or C Virus-infected Liver Identified by Oligonucleotide Microarray. Cancer Genomics-Proteomics. 2004;1:53–8. [PubMed] [Google Scholar]
- [14].Kawakami H, Ohtsuki S, Kamiie J, Suzuki T, Abe T, Terasaki T. Simultaneous absolute quantification of 11 cytochrome P450 isoforms in human liver microsomes by liquid chromatography tandem mass spectrometry with in silico target peptide selection. J Pharm Sci. 2011;100:341–52. [DOI] [PubMed] [Google Scholar]
- [15].Fallon JK, Neubert H, Hyland R, Goosen TC, Smith PC. Targeted quantitative proteomics for the analysis of 14 UGT1As and −2Bs in human liver using NanoUPLC-MS/MS with selected reaction monitoring. J Proteome Res. 2013;12:4402–13. [DOI] [PubMed] [Google Scholar]
- [16].Fallon JK, Harbourt DE, Maleki SH, Kessler FK, Ritter JK, Smith PC. Absolute quantification of human uridine-diphosphate glucuronosyl transferase (UGT) enzyme isoforms 1A1 and 1A6 by tandem LC-MS. Drug Metab Lett. 2008;2:210–22. [DOI] [PubMed] [Google Scholar]
- [17].Harbourt DE, Fallon JK, Ito S, Baba T, Ritter JK, Glish GL, et al. Quantification of human uridine-diphosphate glucuronosyl transferase 1A isoforms in liver, intestine, and kidney using nanobore liquid chromatography-tandem mass spectrometry. Anal Chem. 2012;84:98–105. [DOI] [PMC free article] [PubMed] [Google Scholar]
- [18].Sato Y, Nagata M, Kawamura A, Miyashita A, Usui T. Protein quantification of UDP-glucuronosyltransferases 1A1 and 2B7 in human liver microsomes by LC-MS/MS and correlation with glucuronidation activities. Xenobiotica. 2012;42:823–9. [DOI] [PubMed] [Google Scholar]
- [19].Zhu L, Yang X, Zhou J, Tang L, Xia B, Hu M, et al. The exposure of highly toxic aconitine does not significantly impact the activity and expression of cytochrome P450 3A in rats determined by a novel ultra performance liquid chromatography-tandem mass spectrometric method of a specific probe buspirone. Food Chem Toxicol. 2013;51:396–403. [DOI] [PubMed] [Google Scholar]
- [20].Xu B, Gao S, Wu B, Yin T, Hu M. Absolute quantification of UGT1A1 in various tissues and cell lines using isotope label-free UPLC-MS/MS method determines its turnover number and correlates with its glucuronidation activities. J Pharm Biomed Anal. 2014;88:180–90. [DOI] [PMC free article] [PubMed] [Google Scholar]
- [21].Izukawa T, Nakajima M, Fujiwara R, Yamanaka H, Fukami T, Takamiya M, et al. Quantitative analysis of UDP-glucuronosyltransferase (UGT) 1A and UGT2B expression levels in human livers. Drug Metab Dispos. 2009;37:1759–68. [DOI] [PubMed] [Google Scholar]
- [22].Lathia C, Lettieri J, Cihon F, Gallentine M, Radtke M, Sundaresan P. Lack of effect of ketoconazole-mediated CYP3A inhibition on sorafenib clinical pharmacokinetics. Cancer chemotherapy and pharmacology. 2006; 57: 685–692. [DOI] [PubMed] [Google Scholar]
- [23].Keating GM, Santoro A. Sorafenib: a review of its use in advanced hepatocellular carcinoma. Drugs. 2009;69:223–40. [DOI] [PubMed] [Google Scholar]
- [24].Mathijssen RH, van Alphen RJ, Verweij J, Loos WJ, Nooter K, Stoter G, et al. Clinical pharmacokinetics and metabolism of irinotecan (CPT-11). Clin Cancer Res. 2001;7:2182–94. [PubMed] [Google Scholar]
- [25].Coffman BL, Rios GR, King CD, Tephly TR. Human UGT2B7 catalyzes morphine glucuronidation. Drug Metab Dispos. 1997;25:1–4. [PubMed] [Google Scholar]
- [26].Kaivosaari S, Finel M, Koskinen M. N-glucuronidation of drugs and other xenobiotics by human and animal UDP-glucuronosyltransferases. Xenobiotica. 2011;41:652–69. [DOI] [PubMed] [Google Scholar]
- [27].Eric L, Hugo G, Kim J, Jonanie L, Chantal G. Regulation of the UGT1A1 Bilirubin-Conjugating Pathway: Role of a New Splicing Event at the UGT1A Locus. Hepatology. 2007;45:128–137. [DOI] [PubMed] [Google Scholar]
- [28].UDP-glucuronosyltransferase 1A6 overexpression in breast cancer cells resistant to methotrexate. de A M. Cristina, Elisabet S, Remi T, Cinta P, Veronique N, Carlos JC. Biochemical Pharmacology. 2011;81:60–70. [DOI] [PubMed] [Google Scholar]
- [29].Ohtsuki S, Schaefer O, Kawakami H, Inoue T, Liehner S, Saito A, et al. Simultaneous absolute protein quantification of transporters, cytochromes P450, and UDP-glucuronosyltransferases as a novel approach for the characterization of individual human liver: comparison with mRNA levels and activities. Drug Metab Dispos. 2012;40:83–92. [DOI] [PubMed] [Google Scholar]
- [30].Nishimura M, Yaguti H, Yoshitsugu H, Naito S, Satoh T. Tissue distribution of mRNA expression of human cytochrome P450 isoforms assessed by high-sensitivity real-time reverse transcription PCR. Yakugaku Zasshi. 2003;123:369–75. [DOI] [PubMed] [Google Scholar]
- [31].Sotaniemi EA, Arranto AJ, Pelkonen O, Pasanen M. Age and cytochrome P450-linked drug metabolism in humans: an analysis of 226 subjects with equal histopathologic conditions. Clin Pharmacol Ther. 1997;61:331–9. [DOI] [PubMed] [Google Scholar]
- [32].Roepstorff P, Fohlman J. Proposal for a common nomenclature for sequence ions in mass spectra of peptides. Biomed Mass Spectrom. 1984;11:601. [DOI] [PubMed] [Google Scholar]
- [33].Johnson RS, Martin SA, Biemann K, Stults JT, Watson JT. Novel fragmentation process of peptides by collision-induced decomposition in a tandem mass spectrometer: differentiation of leucine and isoleucine. Anal Chem. 1987;59:2621–5. [DOI] [PubMed] [Google Scholar]
- [34].Hu DG, Rogers A, Mackenzie PI. Epirubicin upregulates UDP glucuronosyltransferase 2B7 expression in liver cancer cells via the p53 pathway. Mol Pharmacol. 2014;85:887–97. [DOI] [PubMed] [Google Scholar]
- [35].Theoret MR, Cohen CJ, Nahvi AV, Ngo LT, Suri KB, Powell DJ Jr., et al. Relationship of p53 overexpression on cancers and recognition by anti-p53 T cell receptor-transduced T cells. Hum Gene Ther. 2008;19:1219–32. [DOI] [PMC free article] [PubMed] [Google Scholar]
- [36].American Joint Committee on Cancer. AJCC Cancer Staging Manual. 7th ed. New boost York, NY: Springer; 2010. [Google Scholar]
- [37].Viswanathan CT, Bansal S, Booth B, Destefano A, Rose M, Sailstad J, Shah VP, Skelly JP, Swann PG, Weiner R. Quantitative bioanalytical methods validation and implementation: best practices for chromatographic and ligand binding assays. Pharmaceutical Research. 2007; 24(10): 1962–73. [DOI] [PubMed] [Google Scholar]
- [38].Piraud M, Vianey‐Saban C, Petritis K, Elfakir C, Steghens J, Bouchu D. Ion‐pairing reversed‐phase liquid chromatography/electrospray ionization mass spectrometric analysis of 76 underivatized amino acids of biological interest: a new tool for the diagnosis of inherited disorders of amino acid metabolism. Rapid Communications in Mass Spectrometry. 2005; 19(12): 1587–602. [DOI] [PubMed] [Google Scholar]
- [39].Nagy K, Takáts Z, Pollreisz F, Szabó T, Vékey K. Direct tandem mass spectrometric analysis of amino acids in dried blood spots without chemical derivatization for neonatal screening. Rapid Communications in Mass Spectrometry. 2003; 17(9): 983–90.12717773 [Google Scholar]
- [40].Council of Europe. European Pharmacopoeia 5.0 Strasbour: 2005; 86–92. [Google Scholar]
Associated Data
This section collects any data citations, data availability statements, or supplementary materials included in this article.