

Abstract
Temporal subtraction (TS) technique calculates a subtraction image between a pair of registered images acquired from the same patient at different times. Previous studies have shown that TS is effective for visualizing pathological changes over time; therefore, TS should be a useful tool for radiologists. However, artifacts caused by partial volume effects degrade the quality of thick-slice subtraction images, even with accurate image registration. Here, we propose a subtraction method for reducing artifacts in thick-slice images and discuss its implementation in high-speed processing. The proposed method is based on voxel matching, which reduces artifacts by considering gaps in discretized positions of two images in subtraction calculations. There are two different features between the proposed method and conventional voxel matching: (1) the size of a searching region to reduce artifacts is determined based on discretized position gaps between images and (2) the searching region is set on both images for symmetrical subtraction. The proposed method is implemented by adopting an accelerated subtraction calculation method that exploit the nature of liner interpolation for calculating the signal value at a point among discretized positions. We quantitatively evaluated the proposed method using synthetic data and qualitatively using clinical data interpreted by radiologists. The evaluation showed that the proposed method was superior to conventional methods. Moreover, the processing speed using the proposed method was almost unchanged from that of the conventional methods. The results indicate that the proposed method can improve the quality of subtraction images acquired from thick-slice images.
Keywords: Temporal subtraction, CT, Artifact reduction, Bone metastasis
Introduction
In the field of diagnostic medical imaging, radiologists commonly interpret and compare two images (previous and current images) acquired from the same patient at different times to detect pathological changes. However, radiologists are frequently burdened by having to interpret three-dimensional (3D) images, such as computed tomography (CT) images. To decrease the burden on radiologists, a temporal subtraction (TS) technique that calculates a subtraction image from a pair of registered images acquired from the same patient at different times has been developed in past studies [1–5]. The TS is effective for visualizing changes in images over time and supports radiologists’ interpretations.
A past study [6] showed that the TS was effective for visualizing bone metastases from thin-slice CT images with a 1-mm slice thickness. However, thick-slice CT images are widely used in actual clinical practice because thin-slice CT images and raw projection data are usually discarded after a short period of time due to storage limitations [7]. Therefore, image registration using thick-slice CT images is necessary for wide use of the TS technique. When a subtraction image is acquired from a pair of thick-slice CT images stored on storages, artifacts caused by partial volume effects degrade the quality of the subtraction image, even with accurate image registration. Here, we propose a novel subtraction method to reduce artifacts by considering gaps in discretized positions between the two images in the subtraction calculations.
Subtraction Artifacts
Theoretically, voxel values of the subtraction image would be zero if a body part has no interval changes and the two images are registered perfectly. In practice, however, the subtraction image has signals other than zero under such conditions. In this paper, we call these signals subtraction artifacts. Figure 1 shows a gray-scale subtraction image in which voxels with zero value are shown as gray, voxels with positive value as white, and voxels with negative value as black. In the following figures, subtraction images are displayed in the same gray scale. A subtraction image acquired from a pair of thick-slice CT images and interval changes caused by bone metastasis are shown in Fig. 1(a).
Fig. 1.
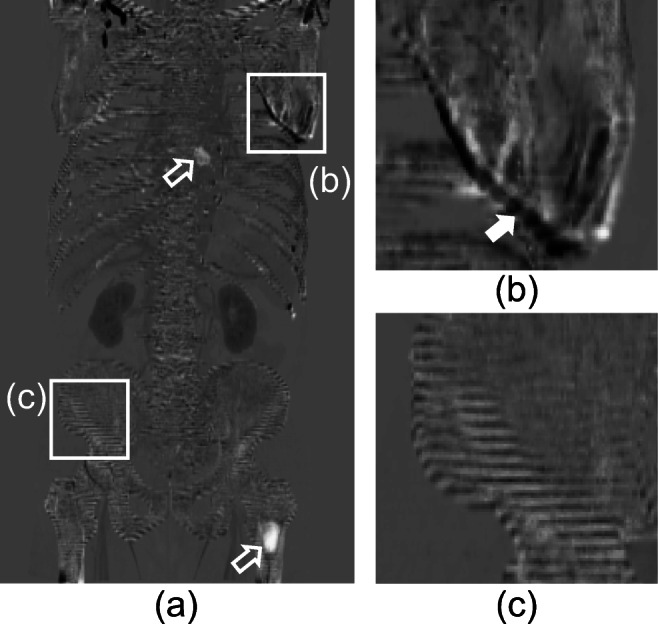
Subtraction image and subtraction artifacts. (a) Arrows indicate bone metastases on the subtraction image. (b) An arrow indicates artifacts caused by misregistration. (c) Artifacts caused by partial volume effects. Reprinted with permission from [8]
There are two main causes of subtraction artifacts: (1) misregistration between the two images (Fig. 1(b)), and (2) partial volume effects (Fig. 1(c)). We focused on subtraction artifacts by partial volume effects in the current study. In Fig. 1(c), the subtraction artifacts caused by partial volume effects are shown with a striped pattern in the body-axis direction that is coarser resolution than any other axis. A CT image is a set of voxels discretely expressing the information of the subject’s internal structure. Even when there are corresponding voxels between two images acquired from the same object, their voxel values would be different if both discretized positions are not completely the same. Therefore, the difference in voxel values causes subtraction artifacts.
The difference in voxel values is explained in Fig. 2. Two targets illustrated in Fig. 2 are the same object with no changes over time. However, different images (images 1 and 2) are generated if signals are reconstructed and converted into differently discretized voxels (broken line in Fig. 2). Generally, when an image’s voxel value is subtracted from the other image’s, we calculate an interpolated value of the other image at the position corresponding to the voxel. In Fig. 2, if each voxel value of image 1 is subtracted from the interpolated value of image 2 at its corresponding position, the difference in values appears as subtraction artifacts on the subtraction image even if the two images are registered accurately. The largest deviation in discretized positions is the half-discretizing size in each image (the interval of broken lines in Fig. 2). If the discretized positions of each image shift in the opposite direction, the largest gap in discretized positions is the sum of the half-discretizing size in each image.
Fig. 2.
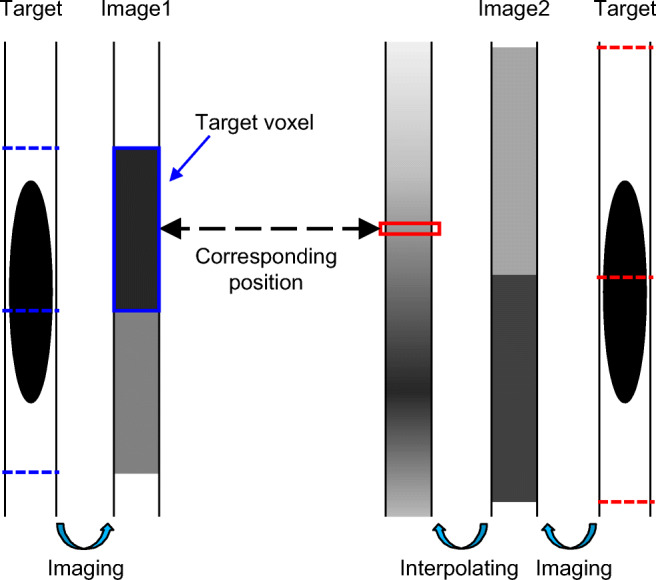
Difference in voxel values caused by gaps in discretized positions. Reprinted with permission from [8]
Conventional Voxel Matching
Voxel matching (VM) has been proposed as a method of reducing subtraction artifacts caused by misregistration between 2 sets of 3D images [9–11]. VM process can be expressed as
| 1 |
where Icur and I′pre are the current image and the deformed previous image registered to the current image, respectively; x is a position of a target voxel to calculate subtraction between the previous and current images, and U is a searching region around x. A target voxel value of a subtraction image is calculated as
| 2 |
where Isub is a subtraction image. VM is used to reduce subtraction artifacts caused by misregistration within the same size as U. The size is empirically determined as n × n × n (n = 3–5) voxels [11].
Furthermore, VM could reduce subtraction artifacts caused by gaps in discretized positions. In this case, we should select the appropriate searching region size. However, to the best of our knowledge, studies on determining the size have not been reported. Moreover, VM is an asymmetric process in which U is set to only I′pre. For this reason, a subtraction image acquired by using VM might change depending on whether U is set to Icur or I′pre.
Proposed Method
Adaptive Voxel Matching
We propose a method based on VM to reduce subtraction artifacts caused by gaps in discretized positions. In this paper, we call the proposed method adaptive voxel matching (AdVM). There are two different features between AdVM and conventional VM. We explain each feature in the following paragraphs.
Adaptively Determining a Size of a Searching Region and Asymmetric Subtraction
As above, the largest gap in discretized positions between two images is the sum of the half-discretizing size of each image. Therefore, the size of a searching region V of AdVM is defined as the same size of the largest gap on the x-, y-, and z-axes, respectively. Hence, AdVM could reduce subtraction artifacts caused by gaps in the discretized positions. However, it is difficult to set V on the deformed previous image because of its deformed coordinate system. Accordingly, we set V not on the deformed previous image but on the original previous image. The AdVM process can be expressed as follows:
| 3 |
| 4 |
where Ipre is the previous image; d is a deformation vector calculated by registering Ipre to Icur on each voxel; and then voxel position x on Icur corresponds to x + d on Ipre. V′ (= 0.5 V) is a searching region around x + d. The size of V is the largest size to reduce all subtraction artifacts caused by gaps in the discretized positions. The adequate size of V′ can be variable because the gaps are different for each voxel. If we use larger size, AdVM may reduce not only subtraction artifacts but also other subtractions derived from true temporal change, such as lesions smaller in size than the gap. Therefore, we multiply V by 0.5, which is an expected value of the gaps of corresponding voxels between two images. According to Eq. (3), we can set V′ along each axis around a position on Ipre corresponding to the target voxel on Icur. Note that the size of V′ should be based on the gaps, and this size may not be in the unit of voxels. Therefore, the voxel values of subvoxels at a certain interval in V′ are interpolated to search for a position at which a subtraction value between the target voxel value and the position is the smallest. Furthermore, the subtraction value at the position is calculated by Eq. (4). In this paper, we call processing by Eq. (4) asymmetric AdVM.
Symmetric Subtraction
When calculating the symmetrical subtraction process, we also set V′ on Icur. The method is expressed as follows.
| 5 |
| 6 |
In Eq. (5), V′ is set not on Ipre but on Icur, and then a target voxel value of the subtraction image is calculated from I1 and I2. In this paper, the target voxel value of the subtraction image is calculated as
| 7 |
where Isub(x) is whichever gives the largest absolute value. Symmetry processing can be performed by using the smallest absolute value or average of I1 and I2. However, we used the largest absolute value to preserve signal-to-noise ratio of subtraction images.
Figure 3 shows an example of symmetrical subtraction. Figure 3 a and b show slice images of a 3D sphere. Here for the purpose of explanation, we assume that no deformation is needed to register the two images, so the variable d in Eqs. (3)–(6) equals 0. In Fig. 3 c, the size of the right sphere is smaller than that of the left sphere. This is because, with respect to the pixel value 0 (black) on the image in Fig. 3 b, it is difficult to obtain a subtraction value from the bright region by searching for a pixel close to the pixel value 0 from the image in Fig. 3 a. On the other hand, in Fig. 3 d, both spheres are illustrated as the same size by symmetric subtraction that does not depend on whether or not a searching region is set to the previous or current image.
Fig. 3.

Asymmetric and symmetric subtraction processing. a Previous image. b Current image. Subtraction image acquired from a and b by using c asymmetric AdVM and d AdVM. Reprinted with permission from [8]
Implementation
In this section, we explain the implementation of a more theoretical and efficient approach to execute the subtraction process that is based on AdVM.
In Eqs. (3) and (5), the most primitive method is subtracting a target voxel value from each value interpolated continuously in V′. In this case, we need to sample the interpolated values in V′ at a very small interval. However, the interpolated values are approximate and contain errors depending on the interval size. Therefore, we propose a method to calculate theoretical values by sampling the interpolated values at finite times. This proposed method uses two features concerning interpolating discretized images. The first feature is that if an arbitrary rectangular region was to be set inside of a rectangle consisting of eight contiguous voxels (2 × 2 × 2 voxels) for a 3D neighborhood and linear interpolation was used as an interpolator, an interpolated value of either one of the vertices of the arbitrary rectangular region becomes a maximum or minimum value within the region. In other words, an interpolated value at an arbitrary point of the rectangular is calculated from eight values of the vertices and comes within range of eight values. The second feature is that an arbitrary value between the maximum and minimum values exists in the arbitrary rectangular region. Therefore, if the maximum and minimum values in V′ are known, it is apparent that arbitrary voxel values between the maximum and minimum values are contained in V′. We explain specifically how the subtraction processing utilizes these two features.
First, we explain an efficient method to identify the maximum and minimum values in V′. From the above features, it is apparent that the maximum and minimum values in a region where plural rectangular regions are combined are equivalent to the maximum and minimum values of vertices of each rectangular region. Hence, we divide the region in V′ into plural rectangular regions and identify the maximum and minimum values from voxel values of vertices of each the rectangular region. Figure 4 illustrates the divided regions in 2D to express this simply. In Fig. 4 a, black boxes connected by broken lines indicate the voxel positions. A square in solid lines indicates V′. Figure 4 b shows the divided rectangular regions in V′ into plural rectangular regions. Circles represent the vertices of each rectangle. The circle can be either one of the vertices of V′, points at the intersection broken lines and edges of V′, and positions of voxels in V′. An arbitrary voxel value in each rectangular region is obtainable by calculating an interpolation of these voxel values of vertices of the rectangle. Therefore, we can identify the maximum and minimum values by using the voxel values of the vertices of the rectangle.
Fig. 4.

A demonstration of dividing the searching region. a The searching region around the target voxel. b The searching region divided into a plurality rectangular
Second, we explain a subtraction method by using the maximum and minimum values in V′. The following equation is an example to calculate I1.
| 8 |
Ipre_max and Ipre_min are the maximum and minimum values in V′, respectively. This equation indicates that if Icur(x) is included in the range of Ipre_max and Ipre_min, the subtraction value is set to 0, because the same value as Icur(x) is clearly present in V′ from the second feature above.
As above, the minimum subtraction is calculated effectively by subtracting the target voxel value from every voxel value calculated theoretically in V′ on Ipre by sampling the interpolated values at finite times. In the same way, I2 is also calculated when V′ is set to Icur. Finally, we can calculate Isub by Eq. (7).
Experiments
Quantitative Evaluation Using Synthetic Data
We quantitatively evaluated the performance of AdVM by using synthetic images.
Synthetic Images
We generated thin-slice synthetic images of a sphere as previous and current images. The resolution of the images was 0.5 mm for each axis. The radii of the spheres were r = 8, 16, 32, and 64 mm, and the ranges of CT values were 50–400 Hounsfield Units (H.U.). These ranges were defined on the basis of typical CT values, such as bones, muscles, and soft tissues. A lesion area was defined as an area of a sphere within r/4 mm from the center of the spheres and had modified CT values only on current images. A peripheral area was defined as an area within 5r/4 mm except for the lesion area. Figure 5 shows cross-sections of synthetic images.
Fig. 5.

Synthetic data. a Previous image. b Current image. Reprinted with permission from [8]
Pseudo Thick-Slice Images
For thick-slice images, we generated pseudo thick-slice synthetic images by averaging and composing several voxels of thin-slice synthetic images. The resolution of the pseudo thick-slice images is 1 mm for x- and y-axes and 3, 5, and 7 mm for the z-axis. The average processing was calculated as follows:
| 9 |
where X is a position of a voxel; is a voxel value of X of a pseudo thick-slice image ; xi (i = 1, 2, …, N) are positions of a thin-slice image Ithin included in a region at X of ; t = (tx, ty, tz) is the degree of gaps in the discretized positions; tx, ty, and tz designate the degree in the gap as the number of voxels of Ithin; and Ithin(xi + t) is a voxel value of xi + t of Ithin.
Evaluation Methods
To evaluate the performance of AdVM, comparison with conventional subtraction methods was performed. As the conventional methods, we selected simple subtraction whereby the previous image is subtracted from the current image for each voxel, VM (n = 3 and 5), asymmetric AdVM, and an averaging method. The sampling interval in V′ of AdVM was empirically determined such that V′ was divided into 5 × 5 × 9 subvoxels. The averaging method averages voxel values on the subtraction image. However, the method used to average the 3D region gave deteriorated quality of the subtraction image. We averaged voxel values in only the z direction because gaps in the discretized positions were the largest in the direction. The size of an averaging kernel was the same size as the resolution of the z-axis of the thick-slice images.
The subtraction images were generated by subtracting from with t0 = (0, 0, 0) by using each subtraction method. Here, the was generated from the previous thin-slice synthetic image at each t and the was generated from the current thin-slice synthetic image. Discretized positions were shifted between and . Therefore, the gaps (t) were registered, and then was subtracted from . We compared the subtraction images acquired by using each method and reference subtraction image calculated from the previous and current pseudo thick-slice images generated from thin-slice images at t = t0 both. In lesion and peripheral areas, the sum of squared difference (SSD), which indicates the similarity between each subtraction image and the reference subtraction image, was calculated.
Subjective Evaluation Using Clinical Data
For evaluation of the clinical usefulness of AdVM, radiologists evaluated the usefulness of subtraction images obtained by applying AdVM to images with pathological changes over time. We used a workstation with an Intel Xeon E-52687W v3 (3.10 GHz) to measure the processing time.
Evaluation Targets
We used clinical CT images of 10 patients who only had known sites of newly developed bone metastases in the current study. The average interval between the 2 CT exams was 15.1 ± 10.8 months. The total number of bone metastases was 32 (9 vertebrae, 10 ribs, 4 sternums, 3 scapulas, 4 pelvises, 2 femurs), and there were 15 osteoblastic and 17 osteolytic metastases. The range of the size of bone metastasis was 7–56 mm (average, 18.5 ± 10.9 mm; median, 16.0 mm).
The matrix size for slice images was 512 × 512, and the number of slices was 619 ± 170. The resolutions of the x- and y-axes ranged from 0.625 to 0.743 mm, and the slice thickness was 1 mm. To evaluate the performance on thick-slice images, the images were converted to pseudo thick-slice images with 5-mm thickness in the same way as used in the previous section. Radiologists visually validated the quality of pseudo thick-slice images by comparing original and pseudo thick-slice image acquired from the same patients.
Evaluation Methods
We applied nonrigid registration [6] to the pseudo thick-slice images and then used common deformation results for acquiring subtraction images of each method (simple subtraction, averaging method, and AdVM). The sampling interval in V′ of AdVM was the same as the previous section.
For evaluation of the clinical usefulness of each subtraction method, three radiologists with 7–18 years of experience in interpretation of torso CT images interpreted current images, previous images, and subtraction images obtained by one of the subtraction methods and projection images, which were the average of maximum intensity projection (MIP) and minimum intensity projection (MinIP) of subtraction images. We disclosed the bone metastases positions to the radiologists for evaluating the image quality of the local regions around the bone metastases but not the subtraction methods used to acquire the subtraction images. The radiologists interpreted subtraction images of each patient and each subtraction method. They rated the usefulness of each subtraction image on a scale of 1 to 5 (1, useless, to 5, useful).
Results
Quantitative Evaluation
The upper row of Fig. 6 shows the previous and current images that are virtual images of a sphere with a radius of 16-mm and 5-mm slice thickness and the reference subtraction image acquired from these images. The middle and lower rows of Fig. 6 show subtraction images between a previous pseudo-image with t = t0 and a current pseudo-image with t = (0, 0, 5) by using each method. In the result of AdVM, subtraction artifacts were substantially reduced and subtractions in the lesion area remained. The result of AdVM is superior to those of conventional methods. The subtraction image of AdVM is more similar to the reference subtraction image than subtraction images of the other methods. Figure 7 shows the average SSD value in peripheral areas acquired from all subtraction images with shifted discretized positions in each axis direction. Subtraction artifacts were substantially reduced by VM (n = 3 and 5), asymmetric AdVM, and AdVM because the SSD values were lower than the ones in other methods. Figure 8 shows the average SSD value in lesion areas. In Fig. 8, the results of AdVM indicate that AdVM is robust against slice thickness variations because the change in the SSD values is smallest among the results of different slice thicknesses. Consequently, these results indicate that AdVM is effective for reducing subtraction artifacts of thick-slice images caused by gaps in the discretized positions.
Fig. 6.

Subtraction images of synthetic data. a Previous image. b Current image. c Reference subtraction image. Subtraction images acquired from a and b by using d simple subtraction, e averaging method, f VM (n = 3), g VM (n = 5), h asymmetric AdVM, and i AdVM. Reprinted with permission from [8]
Fig. 7.
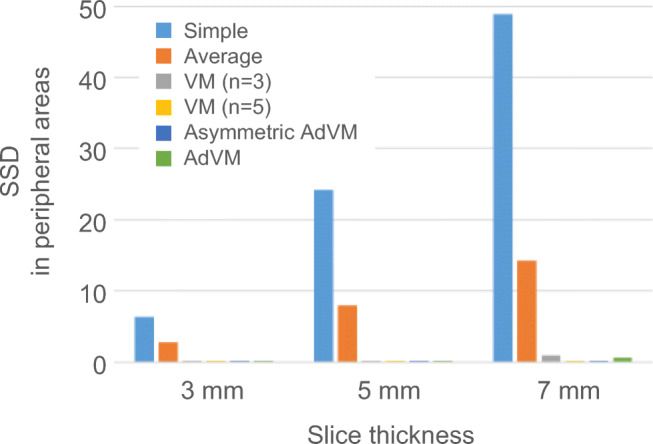
Average SSD value in peripheral areas. Reprinted with permission from [8]
Fig. 8.
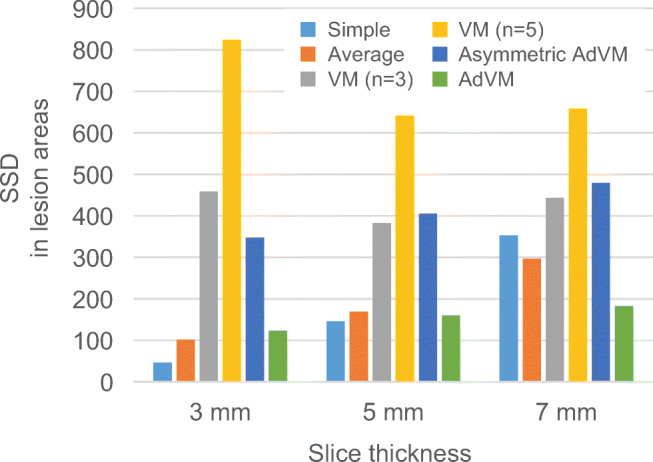
Average SSD value in lesion areas. Reprinted with permission from [8]
Subjective Evaluation
Table 1 shows the subjective evaluation results, which indicate all radiologists found the generated subtraction images using AdVM were superior to those using other methods based on median of the rates for images of all patients.
Table 1.
Results of subjective evaluation. Three radiologists rated the usefulness of each subtraction image acquired by using each method on a scale of 1 to 5 (1, useless, to 5, useful). Reprinted with permission from [8]
| Dr. A | Dr. B | Dr. C | |||||||
|---|---|---|---|---|---|---|---|---|---|
| Patient No. | Simple | Average | AdVM | Simple | Average | AdVM | Simple | Average | AdVM |
| 1 | 4 | 5 | 5 | 4 | 4 | 5 | 3 | 5 | 5 |
| 2 | 4 | 4 | 5 | 3 | 3 | 4 | 3 | 4 | 5 |
| 3 | 4 | 4 | 5 | 3 | 4 | 5 | 3 | 4 | 5 |
| 4 | 4 | 4 | 3 | 2 | 2 | 3 | 1 | 2 | 2 |
| 5 | 4 | 5 | 5 | 3 | 4 | 5 | 2 | 2 | 4 |
| 6 | 4 | 5 | 5 | 4 | 4 | 5 | 3 | 4 | 5 |
| 7 | 3 | 4 | 4 | 4 | 3 | 3 | 2 | 2 | 3 |
| 8 | 4 | 4 | 4 | 4 | 4 | 4 | 3 | 3 | 4 |
| 9 | 3 | 3 | 3 | 3 | 2 | 2 | 2 | 2 | 1 |
| 10 | 3 | 4 | 4 | 3 | 3 | 4 | 3 | 4 | 4 |
| Median | 4 | 4 | 4.5 | 3 | 3.5 | 4 | 3 | 3.5 | 4 |
Figure 9 shows subtraction images acquired from patients used in this subjective evaluation. Figure 9 f shows a simple subtraction image acquired from thin-slice (1-mm thickness) images. It has a few subtraction artifacts because partial volume effects would be small in thin-slice images. White-outlined arrows indicate bone metastases for which enhancement of the subtraction values was expected. A solid-white arrow indicates an example of subtraction artifacts. When conventional subtraction methods are used, it would be difficult to detect bone metastases because subtraction artifacts deteriorate the image quality. Comparing Fig. 9 c, d, and f, the subtraction images of Fig. 9 c and d have more artifacts than Fig. 9 f. On the other hand, the subtraction image acquired by using AdVM (Fig. 9e) enhances bone metastases because the subtraction values of bone metastases are remained and artifacts are reduced as compared with Fig. 9 f.
Fig. 9.

Subtraction images of clinical data. a Previous image. b Current image. Subtraction images acquired from a and b by using c simple subtraction, d averaging method, and e AdVM. f Subtraction image acquired from thin-slice images. White-outlined arrows indicate bone metastases. A solid-white arrow indicates subtraction artifacts. Reprinted with permission from [8]
Figure 10 shows projection images acquired from patients used in this subjective evaluation. Figure 10 also indicates the projection image acquired by using AdVM enhances bone metastases for the same reason as above.
Fig. 10.

Projection image of subtraction values of clinical data. a Simple subtraction. b Averaging method. c AdVM. Reprinted with permission from [8]
Performance Verification of Proposed Implementation
We indicate processing times and subtraction results in the proposed implementation. Table 2 shows subtraction processing times when applying each method to clinical images of 10 patients used in the subjective evaluation. The average time of AdVM with the proposed implementation was 2.58 s per patient, which is at least equivalent to the processing time of the averaging method in our implementation. Moreover, the subtraction images of AdVM reduced more subtraction artifacts. Finally, we can acquire subtraction images that are useful for interpretation with reduced subtraction artifacts specifically in a short time by using AdVM with the proposed implementation.
Table 2.
Subtraction processing times. “AdVM w/ impl” indicates AdVM with proposed implementation. “AdVM w/o impl” indicates the method that interpolates voxel values of subvoxels at a certain interval in the searching region
| Average (s) | Minimum (s) | Maximum (s) | |
|---|---|---|---|
| Simple | 0.80 ± 0.15 | 0.51 | 1.09 |
| Average | 2.61 ± 0.75 | 1.27 | 3.89 |
| AdVM w/ impl | 2.58 ± 0.60 | 1.41 | 3.25 |
| AdVM w/o impl | 23.9 ± 6.0 | 11.0 | 32.5 |
Discussion
Table 1 and Figs. 9 and 10 show AdVM was superior to the conventional subtraction methods. Moreover, AdVM with the proposed implementation can significantly reduce subtraction artifacts with reasonable computational cost. However, the subjective evaluation of 4 out of 30 studies was inferior to those of other methods.
Figure 11 shows the representative results. The white-outlined arrows indicate bone metastases. In the AdVM results, the size of the bone metastasis is smaller than the original size because subtractions of bone metastases are reduced by searching similar voxel values of the bone metastases from surrounding regions. As a solution against this problem, subtraction images are displayed with a narrower window width to increase contrast when radiologists interpret subtraction images, because subtraction images of AdVM has higher signal-to-noise ratio, compared with those by other methods. In Fig. 11, the right-side images from the second to fourth rows are subtraction images with increased contrast. Only bone metastases are enhanced and subtraction artifacts was unchanged on subtraction images of AdVM.
Fig. 11.

Subtraction images increased contrast. a Previous image. b Current image. Subtraction images c and d, e and f, and g and h are acquired by using simple subtraction, averaging method, and AdVM, respectively. Narrower window width was used in d, f, and h than in c, e, and g. Reprinted with permission from [8]
In this evaluation, the targets were bone lesions on CT images. However, we will investigate the usefulness of AdVM in other body parts in the future. In addition, AdVM is expected to be useful for subtraction images of other modalities such as dynamic contrast-enhanced CT or MRI, although we evaluated the clinical usefulness of AdVM by using TS of bone metastasis.
Conclusion
In this paper, we proposed AdVM to reduce subtraction artifacts for acquiring useful subtraction images from thick-slice images. AdVM can robustly reduce subtraction artifacts caused by gaps of various discretizing size. Consequently, we could acquire subtraction images with enhanced subtractions of certain targets, such as lesions.
Compliance with Ethical Standards
Conflict of Interest
K. Togashi has received research grants from Bayer AG; DAIICHI SANKYO Group; Eisai Co., Ltd.; FUJIFILM Holdings Corporation; Shimadzu Corporation; and Canon Medical Systems Corporation. T. Tanaka, R. Ishikawa, K. Nakagomi, K. Miyasa, and K. Satoh are Canon Inc. employees. The other authors declare that they have no conflict of interest.
Ethical Approval
All procedures performed in studies involving human participants were in accordance with the ethical standards of the institutional research committee and with the 1964 Helsinki declaration and its later amendments or comparable ethical standards. For this type of study, formal consent is not required.
Informed Consent
Acquisition of informed consent was waived by the institutional review board because patient data were retrospectively collected in the current study.
Footnotes
Publisher’s Note
Springer Nature remains neutral with regard to jurisdictional claims in published maps and institutional affiliations.
References
- 1.Kano A, Doi K, MacMahon H, Hassell DD, Giger ML. Digital image subtraction of temporally sequential chest images for detection of interval change. Med Phys. 1994;21:453–461. doi: 10.1118/1.597308. [DOI] [PubMed] [Google Scholar]
- 2.Loeckx D, Maes F, Vandermeulen D, Suetens P. Temporal subtraction of thorax CR-images using a statistical deformation model. IEEE Trans Med Imaging. 2003;22:1490–1504. doi: 10.1109/TMI.2003.819291. [DOI] [PubMed] [Google Scholar]
- 3.Ishida T, Katsuragawa S, Kawashita I, Kim H, Itai Y, Awai K, Li Q, Doi, K: 3D temporal subtraction on multislice CT images using nonlinear warping technique. Proc. SPIE 6514, Medical Imaging 2007: Computer-Aided Diagnosis, 65143I; 10.1117/12.709004, 2007
- 4.Yan P, Kodera Y, Shimamoto K. Evaluation of deformable image registration for three-dimensional temporal subtraction of chest computed tomography images. Int J Biomed Imaging. 2017;2017:3457189. doi: 10.1155/2017/3457189. [DOI] [PMC free article] [PubMed] [Google Scholar]
- 5.Sakamoto R, Mori S, Miller MI, Okada T, Togashi K. Detection of time-varying structures by large deformation diffeomorphic metric mapping to aid reading of high-resolution CT images of the lung. PLoS One. 2014;9(1):e85580. doi: 10.1371/journal.pone.0085580. [DOI] [PMC free article] [PubMed] [Google Scholar]
- 6.Sakamoto R, Yakami M, Fujimoto K, Nakagomi K, Kubo T, Emoto Y, Akasaka T, Aoyama G, Yamamoto H, Miller MI, Mori S, Togashi K. Temporal subtraction of serial CT images with large deformation diffeomorphic metric mapping in the identification of bone metastases. Radiology. 2017;285(2):629–639. doi: 10.1148/radiol.2017161942. [DOI] [PMC free article] [PubMed] [Google Scholar]
- 7.Decker S, Ford J. Management of 3D Image Data. Human Remains: Another Dimension. London: Academic Press; 2017. [Google Scholar]
- 8.Tanaka T, Ishikawa R, Nakagomi K, Satoh K, Yakami M, Akasaka T, Onoue K, Nishio M, Emoto Y, Togashi K. Artifacts reduction in temporal subtraction images of thick-slice CT images (in Japanese) Med Imaging Technol. 2017;35(5):257–267. [Google Scholar]
- 9.Itai Y, Kim H, Ishikawa S, Katsuragawa S, Doi K. A method for reducing of subtraction artifacts in temporal subtraction image based on voxel matching method. Inst Electron Inf Commun Eng. 2008;107(461):281–284. [Google Scholar]
- 10.Itai Y, Kim H, Ishikawa S, Katsuragawa S, Doi K: A new registration method with voxel-matching technique for temporal subtraction images. Proc. SPIE 6915, Medical Imaging 2008: Computer-Aided Diagnosis, 69153I; 10.1117/12.769921, 2008
- 11.Itai Y, Kim H, Ishikawa S, Katsuragawa S, Doi K. Development of a voxel-matching technique for substantial reduction of subtraction artifacts in temporal subtraction images obtained from thoracic MDCT. J Digit Imaging. 2010;23(1):31–38. doi: 10.1007/s10278-008-9169-1. [DOI] [PMC free article] [PubMed] [Google Scholar]