Abstract
Determining the minimum image resolution needed for clinical assessment is crucial for computational efficiency, image standardization, and storage needs alleviation. In this paper, we explore the image resolution requirements for the assessment of alopecia by analyzing how clinicians detect the presence of characteristics needed to quantify the disorder in the clinic. By setting the image resolution as a function of width of the patient’s head, we mimicked experiments conducted in the computer vision field to understand human perception in the context of scene recognition and object detection and asked 6 clinicians to identify the regions of interest on a set of retrospectively collected de-identified images at different resolutions. The experts were able to detect the presence of alopecia at very low resolutions, while significantly higher resolution was required to identify the presence of vellus-like hair. Furthermore, the accuracy with which alopecia was detected as a function of resolution followed the same trend as the one obtained when we classified normal versus abnormal hair density using a standard neural network architecture, hinting that the resolution needed by an expert human observer may also provide an upper bound for future image processing algorithms.
Keywords: Alopecia, Digital image interpretation, Image resolution requirements
Introduction
Automated image analysis continues to gain traction for clinical dermatological applications, such as assessing psoriasis severity [1] and detection of melanoma [2]. In order to capture a clinical condition in a digital image to create efficient and accurate algorithms that would mimic the eye of a clinician, it is crucial to know what information is encoded at various image resolutions. While higher image resolution clearly provides more details, images of lower resolutions are not only sufficient to perform many common vision tasks but may also provide several computational advantages: faster algorithms, higher transfer speed for real-time analysis, and lower storage requirements. For natural scene photographs, for example, Torralba [3] showed that humans can reliably recognize a scene, as well as several objects contained within, from a thumbnail-size image of merely 32 × 32 pixels. However, studies analyzing image resolution requirements in dermatology, other than those used in dermoscopy [4], remain scarce. Studies to determine digital image resolution requirements in dermatology date back to 1997 [5]. With the ever-evolving technology for image capture and visualization, these standards constantly change. Depending on the application and the feature of interest, the amount of information that needs to be extracted from an image varies greatly.
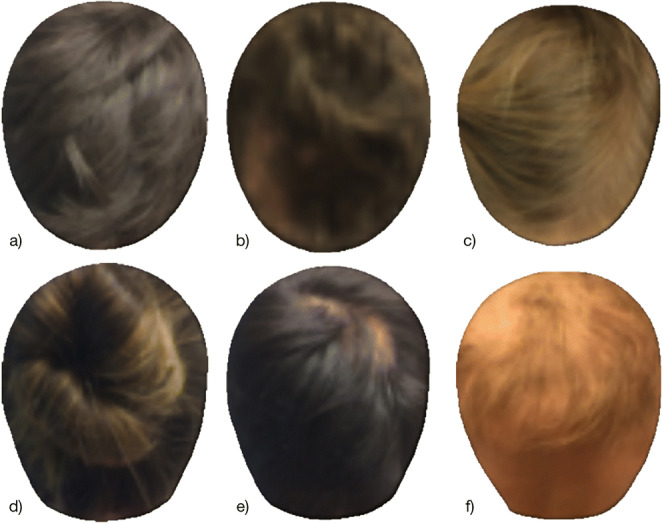
Focusing on hair, we start addressing this question by studying images of patients with alopecia (hair loss). We survey at which resolutions expert dermatologists can identify the presence of two features indicative of alopecia on opposite ends of the visibility range: overall hair loss and vellus-like hairs. Decreased hair density is easily observed by most dermatologists upon a quick evaluation even from a distance, which suggests that a fairly low resolution is sufficient as seen in Fig. 1. In contrast, short and tapered nascent hairs indicative of regrowth (which is common in certain types of alopecia, such as alopecia areata), sometimes referred to as vellus hair due to their fine and light appearance, can be challenging to detect even on closer examination.
Fig. 1.

Sample standardized photographs of alopecia patients taken from above (top row) and behind (bottom row). Most dermatologists can easily outline regions of alopecia (if present) on images of as low as 64 pixels in head width (as shown here) despite hair color/style variations (b, d), illumination variations (a, b, e, f), and presence of a part line (c)
Capturing hair from images has been an ongoing topic in computer vision, mainly for graphical applications. Hair detection is usually the first step needed in order to reproduce a person’s hair in a photo-realistic way as well as to increase realism of rendering hair on characters. For these applications of realistic rendering, the aim is to capture as much detail as possible [6–9]. For example, for modeling a person's overall hair “look,” strand accuracy level has been achieved by capturing individual hair strands using sophisticated image capture systems [7]. Vellus hair in particular has also been studied. Koenderink and Pont [8] first referred to it as the “peach fuzz” needed to recreate the appearance of velvety skin on a person's face. More recently, it has been captured with professional DSLR cameras and macro lenses to recreate the correct image statistics for purposes of creating realistic digital characters [9]. While there has been other work done to capture hair for quantifying hair loss for clinical purposes [10, 11], to the best of our knowledge, no work has been done to set minimum image requirements for the images to be clinically relevant. We explore this question by presenting images of various resolutions to dermatologists for the purpose of determining the minimum resolution boundaries for detection of overall hair loss and extraction of clinically valuable features of the hair, such as thin vellus-like hair.
Materials and Methods
For all of our experiments, we used de-identified images of alopecia patients that had been retrospectively collected in the dermatology clinic of the Children’s Hospital of Philadelphia according to the clinical guidelines used to assess the Severity of Alopecia Tool (SALT) score [12]. The dataset included images spanning all hair types and colors, as well as patterns of hair loss, from continuous density changes to patchy hair loss. The background information was masked isolating the area of interest, in our case, the hair-bearing portion of the scalp. The head size was normalized by fixing the width of the head across the population. To minimize biases due to geometric factors, we selected top and back views only so that the hair texture would appear as flat as possible.
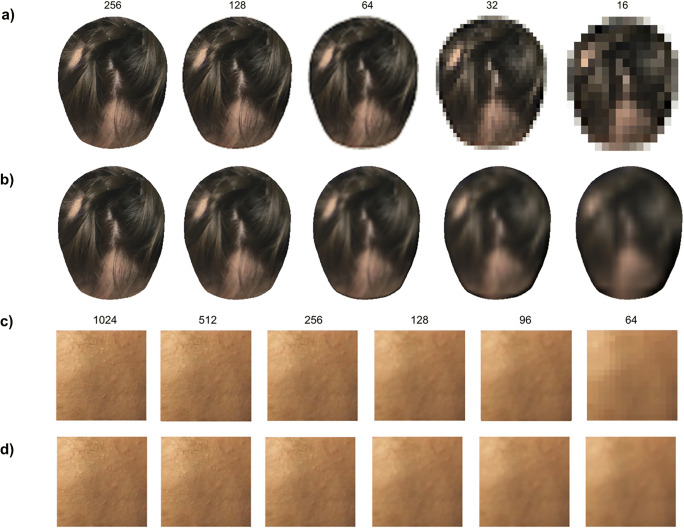
Images were first downsampled as a function of the desired head width based on the goal of the experiment and then upsampled back to the largest size in the set to minimize pixelation effects during visualization, as shown in Fig. 2. Images were displayed to board-certified dermatologists via a Matlab [14] graphical user interface to simplify interactive annotation and control viewing size. The years of experience of these dermatologists spanned across several ranges: 2 dermatologists with < 5 years of experience, 1 with 5–10 years, 2 with 10–15 years (including one pediatric dermatologist), and 1 with 20+ years. Every image was shown to each dermatologist only once at a preset resolution. All experiments began with an example slide with oral instructions and a demonstration of labeling techniques.
Fig. 2.
Sample images used in the study. Original images of abnormal hair density were standardized. For the first experiment, the images were downsampled to the resolution based on the following head width pixel sizes: 256, 128, 64, 32, 16 (a), after which they were upsampled back to the largest size in the set to reduce pixelation and unbias the viewer (b). For the second experiment, the images were first cropped to isolate a specific area and then downsampled according to the following head widths: 1024, 512, 256, 128, 96, 64 (c) after which they were upsampled for visualization (d)
To study the ability to identify regions of hair loss, we chose 40 images of alopecia patients of various hair types, hair colors, and extents of hair loss. Each of these 40 images was downsampled using the following widths: 256, 128, 64, 32, 16 (Fig. 2 a and b). We then divided the resulting 200 images of various resolutions randomly into 5 sets, where each set contained each image at most once. Clinicians were instructed to strike through the regions of low density, roughly approximating the medial axis. In cases where a clinician was unable to identify an area of hair loss due to its perceived absence or insufficient visual information, the image was given a “no alopecia present” or an “undecided” label, respectively. We further asked the observers to identify regions of part lines (due to styling) to distinguish them from those of lower hair density caused by the disorder and avoid having them categorized as normal density.
For vellus-like hair detection, 20 new images were used. The standardized images at 1024 pixels (head width) were cropped to 512 × 512 patches to draw the observers’ attention to a specific area of interest and remove other factors that could contribute to detection of vellus hair. Elimination of contextual reliance also prevented premature diagnosis of the alopecia type which, in turn, required the physicians to rely solely on their ability to see nascent hair. We selected crops of mostly bare scalp regions and low density patchy regions where vellus-like hair is usually found. Cropped patches were resized to obtain samples corresponding to head widths of 1024, 512, 256, 128, 96, 64 (Fig. 2 c and d). Since labeling individual nascent hair strands is not feasible, the goal was simply to see whether the observers were able to detect their presence by loosely outlining clusters of vellus-like hairs. Labeling options included “vellus only” and “terminal (normal) and vellus hair combined.”
Annotations from both experiments were then compared with the clinical ground truth (GT) that was created by having clinicians delineate areas of interest on the original images (taking the whole head view into consideration) at native camera resolution (over 2000 pixels in head width). For alopecia detection, 3 clinicians labeled areas of “alopecia” (abnormal hair densities) and “parts” (Fig. 3). We calculated the detection rate of alopecia by measuring the intersection over union (IoU) with regard to the GT. For detection of alopecia, we computed the weighted IoU, i.e., areas correctly identified as “alopecia” vs. total alopecia area. For part lines, the IoU was computed by counting the number of areas correctly selected as parts out of the total number of part lines present. For vellus detection, 2 dermatologists (1 expert in pediatric alopecia) outlined areas with “vellus only” and “terminal and vellus hair combined” labels. A positive response by either dermatologist established the presence of vellus hair. For each experiment, we computed the pairwise inter-rater variability. In the case of alopecia detection, the final inter-rater variability was taken as the average of the pairwise ones.
Fig. 3.
Sample ground truth labels and clinicians’ survey annotations. De-identified images of patients with alopecia were labeled by 3 expert clinicians using the following labels: (1) normal hair density (blue), (2) abnormal hair density-low density, including scalp (yellow), and (3) lower hair density due to hair part or hair styling (light blue). Clinicians’ annotations were then overlaid to the ground-truth for analysis. The black lines identify areas that were detected as alopecia and the blue lines as low density due to styling. Part lines are recognized as styling up to 64 pixel width at which it starts being mistaken for hair loss
To increase interpretability of our results, we compared the human alopecia detection results to those from an automated machine output. To detect areas of abnormal hair density automatically, we adapted U-Net [15], a neural network architecture optimized for biomedical images that learns features over the entire image (thus taking into account the global context of the image), to classify each pixel in the image as normal or abnormal density 1.
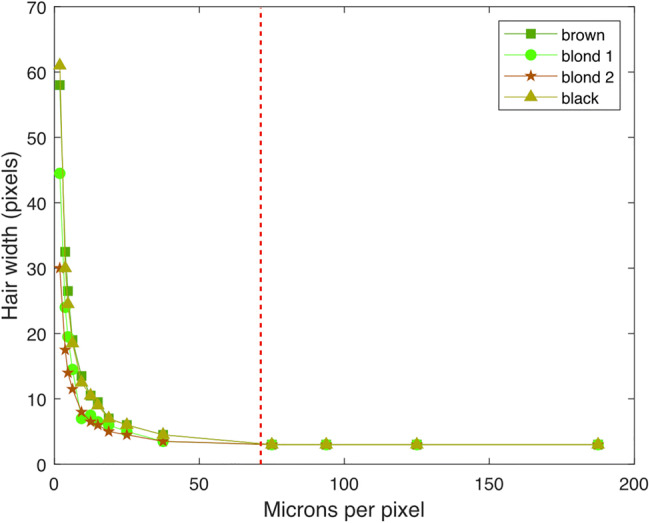
Finally, we also examined how the capture of hair of various widths and pigment changes with decreasing image resolution and thus may influence its perception. Using forceps, black, brown, and blond strands of human hair were plucked and spread onto a piece of clear adhesive tape which was then placed on a glass slide. Bright field images of the slides were acquired using a 4× magnification objective lens of a Keyence BZ-X710 microscope (Fig. 4). We then measured the average hair width (in pixels) as a function of μm per pixel (inversely proportional to the size of the image) (Fig. 5).
Fig. 4.
Microscopic images of black, blond (blond 1), vellus blond (blond 2), and brown hair decreasing in resolution from left (original) to right. The dashed red line represents the resolutions after which all hair types become 1–2 pixels in width.
Fig. 5.

Hair width measurements vs. image resolution. After 75 microns per pixel (which encompasses all image resolutions used in the experiments), all 4 hair types become 1–2 pixels in width independent of their original width, hinting that image context, more than individual pixel information, plays a significant role in seeing vellus hair
Results
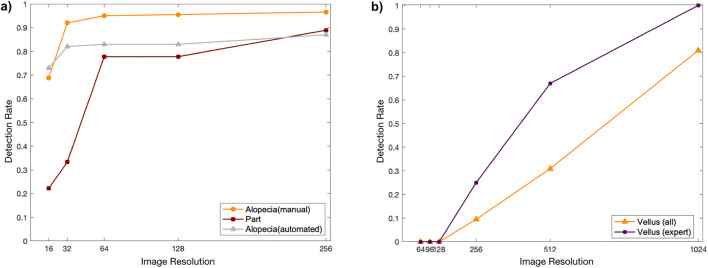
Results are presented in Fig. 6. As shown in Fig. 6a, alopecia detection rate (orange line) increased significantly from 16 to 32 pixel resolution where it surpassed the inter-rater reliability (clinicians’ IoU) value of 82%, comparatively less from 64 to 128, and almost stabilized after 128. Part line detection rate (maroon line) was slightly lower than that of alopecia; however, it still showed a significant increase from 32 to 64 pixels, surpassing the clinician IoU of 74% after 64 pixels. Detection rate of vellus hair showed a constant increase surpassing the inter-rater reliability of 75% only at 1024 pixels (Fig. 6b). As shown in the alopecia detection experiment, the clinicians’ detection exhibits a similar trend to that of machine output that was obtained by using an artificial neural network to detect alopecia regions automatically. As visible in Fig. 6a, the automated neural network output (gray line) yielded a similar trend to the clinicians’ detection, plateauing at 256 with 87% detection rate. The significant increase however occurred at lower resolutions, between 16 and 32 pixels where the detection goes from 73 to 82%.
Fig. 6.
Hair perception analysis results. a Low hair density detection rates for alopecia (orange), part (maroon), and machine output (grey). b Vellus-like hair detection results, by all observers (yellow) and by an expert pediatric dermatologist specializing in reversible alopecia (purple)
Sampling different hair strands among the population yielded the following results. As can be noted in Figs. 3 and 4, for both the image and the graph, once the resolution of 75 μm per pixel is reached, intensity distributions may still vary between hair types, but all individual hair strands become of constant width of 1–2 pixels independent of the actual width captured in the original image. In general, estimating the average human head at 15 cm in width, even the highest resolution used in the vellus-like detection experiment (1024 pixels or 147 μm per pixel) falls outside of this range, suggesting that detection of vellus-like hair is highly context driven.
Discussion and Conclusions
The ability to detect relevant clinical information is a critical first step for medical image interpretation. In this paper, we show that overall presence of hair loss on a human scalp can be detected at resolutions as low as 64 pixels (head width). Above 128 pixels in width, the detection rate of alopecia surpasses 95%. Vellus-like hair requires 1024 pixels to surpass the inter-rater reliability. The importance of context was also recognized in detection of visual characteristics of alopecia. By measuring the width of vellus and terminal hair of various colors under a microscope, all hair types appeared of constant width irrespective of their actual size at all resolutions used in these experiments (which represent common images taken by physicians with iPhone cameras). Note that the same exact 1–2 pixel widths were observed while photographing hair strands with professional cameras for graphics applications [16].
Finally, having more insight on which alopecia information is available with varying resolutions may help refine algorithm design. The alopecia and vellus detection experiments provide a starting point for input image requirements for alopecia or vellus detection algorithms. The importance of context in detecting vellus-like hair further hints that while the resolutions found can be used to set the minimum for hair segmentation, additional experiments could help establish how much local vs. global information is needed in order to distinguish vellus-like from normal hair.
Funding
This study was partially funded by an American Skin Association Research Grant for Childhood Skin Diseases/Disfigurement awarded to Elena Bernardis, PhD.
Compliance with Ethical Standards
Conflict of Interest
The authors declare that they have no conflict of interest.
Footnotes
The network was trained on 700 alopecia images (acquired and standardized in the same way as the images in our experiments) and tested on the same 40 images used for the alopecia detection experiment.
Publisher’s Note
Springer Nature remains neutral with regard to jurisdictional claims in published maps and institutional affiliations.
References
- 1.Fink C, Fuchs T, Enk A, Haenssle HA. Design of an algorithm for automated, computer-guided PASI measurements by digital image analysis. J Med Syst. 2018;42(12):248. doi: 10.1007/s10916-018-1110-7. [DOI] [PubMed] [Google Scholar]
- 2.Fink C, Haenssle HA. Non-invasive tools for the diagnosis of cutaneous melanoma. Skin Res Technol. 2017;23(3):261–271. doi: 10.1111/srt.12350. [DOI] [PubMed] [Google Scholar]
- 3.Torralba A. How many pixels make an image? Vis Neurosci. 2009;26(1):123–131. doi: 10.1017/S0952523808080930. [DOI] [PubMed] [Google Scholar]
- 4.Fleming MG. Digital Dermoscopy. Dermatol Clin. 2001;19(2):359–367. doi: 10.1016/S0733-8635(05)70273-4. [DOI] [PubMed] [Google Scholar]
- 5.Bittorf A, Fartasch M, Schuler G, Diepgen TL. Resolution requirements for digital images in dermatology. J Am Acad Dermatol. 1997;37(2 Pt 1):195–198.6. doi: 10.1016/S0190-9622(97)80124-7. [DOI] [PubMed] [Google Scholar]
- 6.Beeler T, Bickel B, Noris G, et al. Coupled 3D reconstruction of sparse facial hair and skin. ACM Trans Graph. 2012;31(4):1–10. doi: 10.1145/2185520.2185613. [DOI] [Google Scholar]
- 7.Paris S, Briceño HM, Sillion FX: Capture of hair geometry from multiple images. ACM SIGGRAPH 2004 Papers on - SIGGRAPH ’04. 2004, 10.1145/1186562.1015784, 2004
- 8.Koenderink J, Pont S. The secret of velvety skin. Mach Vis Appl. 2003;14(4):260–268. doi: 10.1007/s00138-002-0089-7. [DOI] [Google Scholar]
- 9.LeGendre C, Hyunh L, Wang S, Debevec P: Modeling vellus facial hair from asperity scattering silhouettes. ACM SIGGRAPH 2017 Talks on - SIGGRAPH ’17.10.1145/3084363.3085057, 2017
- 10.Gibbons RD, Fiedler-Weiss VC, West DP, Lapin G. Quantification of scalp hair--a computer-aided methodology. J Invest Dermatol. 1986;86(1):78–82. doi: 10.1111/1523-1747.ep12283872. [DOI] [PubMed] [Google Scholar]
- 11.Bernardis E, Castelo-Soccio L. Quantifying Alopecia Areata via Texture Analysis to Automate the SALT Score Computation. J Investig Dermatol Symp Proc. 2018;19(1):S34–S40. doi: 10.1016/j.jisp.2017.10.010. [DOI] [PubMed] [Google Scholar]
- 12.Olsen EA, Hordinsky MK, Price VH, et al. Alopecia areata investigational assessment guidelines–Part II. J Am Acad Dermatol. 2004;51(3):440–447. doi: 10.1016/j.jaad.2003.09.032. [DOI] [PubMed] [Google Scholar]
- 13.Sinha S, Sehrawat M, Meena N, Sharma P. Biology of hair pigmentation and its role in premature canities. Pigment Int. 2017;4(1):7–12. doi: 10.4103/2349-5847.208297. [DOI] [Google Scholar]
- 14.MATLAB: (2018). 9.7.0.1190202 (R2019b). Natick, Massachusetts: The MathWorks Inc
- 15.Ronneberger O, Fischer P, Brox T: U-Net: Convolutional networks for biomedical image segmentation. Lecture notes in computer science. 234-241,10.1007/978-3-319-24574-4_28, 2015
- 16.Nam G, Wu C, Kim MH, Sheikh Y: Strand-accurate multi-view hair capture. 2019 IEEE/CVF Conference on Computer Vision and Pattern Recognition (CVPR). 10.1109/cvpr.2019.00024, 2019


