Abstract
Fluid-dynamic models of the flow of cerebrospinal fluid in the brain have treated the perivascular spaces either as open (without internal solid obstacles) or as porous. Here, we present experimental evidence that pial (surface) periarterial spaces in mice are essentially open. (1) Paths of particles in the perivascular spaces are smooth, as expected for viscous flow in an open vessel, not diffusive, as expected for flow in a porous medium. (2) Time-averaged velocity profiles in periarterial spaces agree closely with theoretical profiles for viscous flow in realistic models, but not with the nearly uniform profiles expected for porous medium. Because these spaces are open, they have much lower hydraulic resistance than if they were porous. To demonstrate, we compute hydraulic resistance for realistic periarterial spaces, both open and porous, and show that the resistance of the porous spaces are greater, typically by a factor of a hundred or more. The open nature of these periarterial spaces allows significantly greater flow rates and more efficient removal of metabolic waste products.
Keywords: cerebrospinal fluid, perivascular spaces, glymphatic system, brain clearance system, fluid dynamics, hydraulic network models
1. Introduction
Substantial evidence suggests that flow of cerebrospinal fluid (CSF) along perivascular spaces (PVSs) in the brain is an important mechanism for delivering nutrients and clearing metabolic waste products [1–3]. The mechanism that drives this flow, and even the very existence of this flow, have proved to be controversial [4–6]. Recently, however, in vivo experiments using particle tracking have confirmed the existence of this flow in surface periarterial spaces and have shown it to pulse at the heart rate, with net flow in the direction of the blood flow [7,8]. Comparing artery wall motion to CSF flow, both in control experiments and after altering artery wall motion with a drug, gives strong evidence that CSF is driven largely by pulsations of the artery wall—a peristaltic mechanism, known as perivascular pumping [7]. However, some idealized numerical simulations have cast doubt on this hypothesis [4,9–12]. Regardless of what mechanism drives CSF through PVSs, determining the characteristics of the PVSs themselves is essential for accurate theoretical modelling and prediction.
There have been several theoretical studies of the fluid dynamics of CSF flow in pial, penetrating, and branching PVSs [4,9–14], based on different proposed driving mechanisms, including perivascular pumping. Some of these models treat the PVS as a porous medium (e.g. [4,10]), while others treat the PVS as an open space (e.g. [9,14]; see also the review [15]). The porous-medium model is meant to represent the effect of a network of proteins (sometimes called the extracellular matrix) that might fill the PVS. It is important to establish the properties of the PVSs throughout the many levels of the branching vasculature in the brain, in order to put fluid-dynamic modelling on a firm footing. Here, we take a first step in that direction by presenting experimental evidence demonstrating that the PVSs around pial (surface) arteries in the mouse brain are essentially open spaces. We emphasize that this finding is limited to PVSs around pial (surface) arteries. We make measurements in PVSs that surround the middle cerebral artery and its daughter vessels. (The outer boundaries of surface PVSs are formed by structures whose anatomical characterization is unclear [16] and is an important topic of ongoing study.) Conditions in PVSs around penetrating arteries and other parts of the vasculature may be quite different.
In order to demonstrate the significance of this finding, we compute the hydraulic resistance for several realistic configurations of the periarterial space, for both an open space and a porous space and show that the resistance of the porous space is much greater, typically by a factor of a hundred or more.
2. Experimental methods
Experiments were approved by the University Committee on Animal Resources, University of Rochester Medical Center (Protocol No. 2011-023). An effort was made to minimize the number of animals used. Each mouse was fitted with a cranial window on the right anterolateral parietal bone, near the middle cerebral artery, with the dura mater kept intact. Windows were sealed with agarose (0.8% at 37°C) and glass covers to prevent intracranial depressurization. All mice used in this study were wild-type male C57BL/6, 8–12 weeks old (Charles River), anaesthetized with ketamine/xylazine (100/10 mg kg−1 injected intraperitoneally). Body temperature was maintained by a heated platform (Harvard Apparatus) controlled by a rectal probe. A cannula in the cisterna magna was used to inject tracer particles (FluoSpheresTM 1.0 μm, 580/605 nm, 0.25% solids in artificial CSF (aCSF), Invitrogen) at 2 μl min−1 for 5 min [17,18]. Particles were small enough to track fluid motion faithfully. Cardiac arrest was induced by replacing the inhaled air mixture with 100% nitrogen. This approach causes profound hypoxia and induces asphyxial cardiac arrest several seconds later [19]. Measurements described in §3 come from the first 16 min after cardiac arrest, before the subsequent strong vasoconstriction that changes the shape and effective size of the PVS [19,20]. During this period, the flow of CSF is unidirectional and provides a more accurate indication of the nature of the space than the pulsatile flow seen before cardiac arrest (see further explanation in §3). Measurements reported in §4 come from the 5 min interval immediately preceding inhalation of nitrogen and cardiac arrest (i.e. control conditions).
We illuminated particles using a Chameleon Ultra II laser (Coherent) attached to a resonant scanner B two-photon microscope (ThorLabs) with a water-immersion 20× objective (1.0 NA, Olympus). Intravascular fluorescein isothiocyanate–dextran (FITC–dextran, 2000 kDa) and red microspheres were excited at an 820 nm wavelength. Images were acquired in a single focal plane at either 30 or 60 frames per second with 1.16 μm/pixel resolution. Particles and vasculature were imaged simultaneously on separate colour channels (red and green, respectively). We registered images to sub-pixel accuracy with an automated algorithm, using the vasculature for reference.
In the resulting movies, we tracked particles using a custom, automated algorithm written in Matlab and similar to algorithms described before [21,22]. In prior studies, we have masked regions with stagnant microspheres; here, we used an improved tracking algorithm which does not require masking because the background image is generated dynamically from recent and upcoming frames. Some particles stuck to the boundaries of the perivascular space and therefore did not track CSF motion; we minimized the error they might cause by excluding any particle with low mean speed. Once post-processing was complete, 5 min of observations yielded tens of thousands or hundreds of thousands of measurements.
3. Particle paths
One way to assess the porosity of a PVS is to examine the individual particle paths to see how smooth they are. In a porous medium, the paths will be jagged, as fluid particles wind their way through the tortuous spaces, but in an open space, paths will be smooth, tending to curve only where the PVS boundaries curve.
We examined the particle paths for several in vivo experiments where the flow is pulsatile, driven by perivascular pumping. In these cases, the particle paths are naturally wiggly because of the driving motions of the artery wall, and it is difficult to separate those motions from possible motions enforced on the fluid particles by porosity.
As an alternative, we turned to our experiments involving cardiac arrest in which we observe an accelerating unidirectional influx of CSF, hypothesized to occur due to pressure gradients arising from decreased blood volume in the brain [7,19,23]. The flow of CSF during cardiac arrest has important implications for edema and human health, as will be described in a forthcoming publication [19]. For the current study, avoiding the confounding factor of arterial pulsations provided a better opportunity to assess the extent of fibrous obstacles in the space. Figure 1 shows several examples of the particle tracks from a single such experiment. Particles do not follow the jagged and irregular paths typical of flow through a porous medium, which resemble biased random walks. Instead, particles follow smooth and directional paths, typical of fluid flow in an open space. This qualitative observation gives the first hint that surface PVSs may be open, not filled with porous medium.
Figure 1.
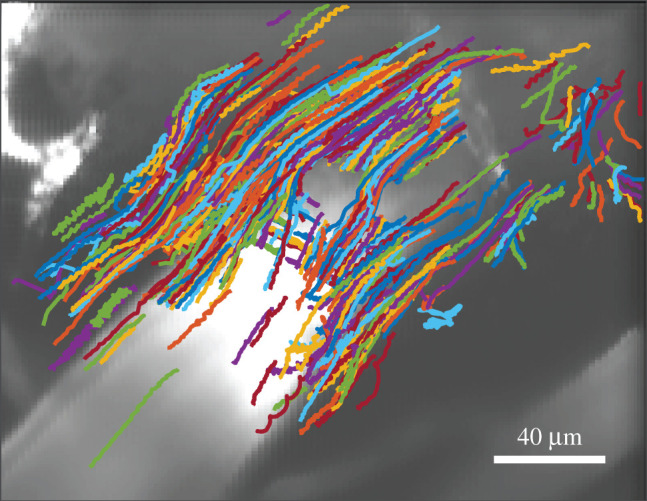
Example paths followed by microspheres tracing the motion of cerebrospinal fluid in a murine surface periarterial space. The artery (stained with FITC-dextran dye) is visible in the greyscale image. Flow was smooth, with little resemblance to the random walks characteristic of diffusion or to the directional random walks characteristic of flow through porous media, suggesting an open space. These measurements span 16 min immediately after cardiac arrest.
Particle displacements can provide a more quantitative measure. The displacement of a particle whose motion is perfectly smooth is d = tU, or equivalently d/L = tU/L, where t is time and U is characteristic particle speed, as implied by the units of measure. The displacement of a particle whose motion is purely diffusive is d = (t/D)1/2, or equivalently d/L = (tU/L)1/2/(DLU)1/2, where D is the diffusivity. In figure 2, we plot the scaled displacement d/L versus the scaled elapsed time tU/L for 257 particle paths from a single experiment (all of the particle paths were followed for longer than 0.926 s: shorter paths produce nosier fits). Here, L = 40 μm is a typical width of the PVS [7], and U = 61.8 μm s−1 is the measured RMS velocity of all the particles. On the log–log plot in figure 2, we would expect to see a straight line with slope 1 for smooth motion, and a straight line of slope 1/2 for diffusive motion. As figure 2 shows, displacements more closely match slope 1, as would be the case if the PVS is open, not porous.
Figure 2.
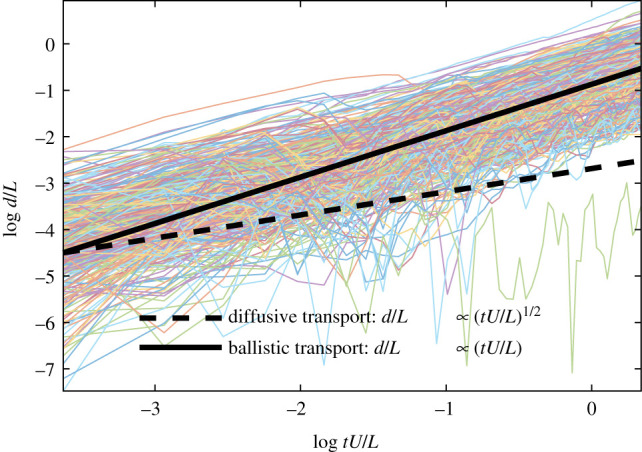
Displacement of 257 particles in a periarterial space, varying over time, from a single experiment. The solid line has the slope predicted for smooth motion, and the dashed line, for diffusive motion. The measured displacements follow a trend strongly indicative of smooth motion, not diffusive motion.
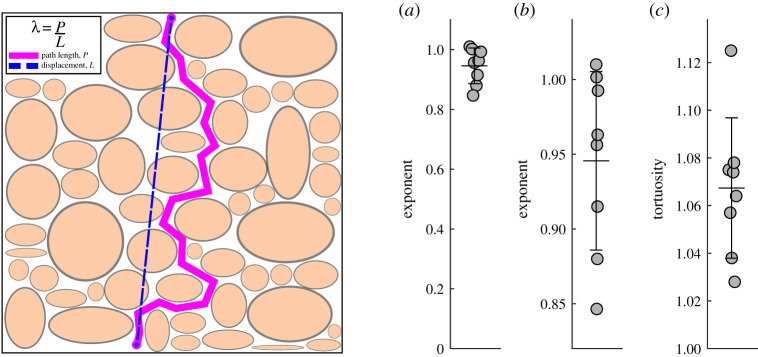
To quantify further, we fit each curve in figure 2 to the relation , determined the value of the exponent δ giving the best fit for each, and determined the average exponent δ that best describes all the curves in the experiment. Then we repeated the procedure for seven other experiments with 7 other animals. The average best-fit values of the exponent δ in each experiment are plotted in figure 3. The values cluster tightly around a mean value of about 0.95 (0.946 ± 0.0597). The δ = 1 case expected for an open PVS lies within one standard error of the mean, but the δ = 0.5 case expected for a PVS filled with a porous medium differs from the mean by more than 7 standard error values. This indicates that the particle motions are essentially unimpeded, and hence the PVS around this pial artery is an open space.
Figure 3.
Left: Schematic diagram of the concept of tortuosity, shown for a porous medium (see text). Right: (a) Exponent of the displacement-versus-time curve (figure 2) for the ensemble of particle tracks for each of eight different mice. (b) Enlargement of the same plot, showing a clustering around a mean value of 0.946 (wide bar) with standard error of the mean 0.0597 (narrow bars). This shows that the particle motion is mostly unimpeded (exponent 1.0), as in an open space, rather than diffusive (exponent 0.5), as in a porous medium. (c) Average tortuosity of particle tracks from the same eight mice. The overall mean tortuosity is 1.0674 (wide bar) with standard error of the mean 0.0294 (narrow bars). A tortuosity of 1 corresponds to motion in a straight line. Here, the tortuosity is slightly greater than 1, probably because of curvature of the periarterial space. A much greater tortuosity would be expected for motion in a porous medium.
We reach the same conclusion if we consider the root-mean-square error, defined as
where n is the number of measurements in the experiment and is the displacement predicted in either perfectly smooth or purely diffusive transport. Table 1 shows the results. Errors are typically much smaller for a smooth model than a diffusive one, despite the fact that PVS curvature prevents any real path from being perfectly smooth.
Table 1.
Root-mean-square error when comparing measured particle displacements to two models: smooth (d/L ∝ (tL/U)) and diffusive motion (d/L ∝ (tL/U)1/2). Errors are typically much smaller for a smooth model, consistent with particle motion through an open space, not a porous one.
| mouse | RMSEsmooth (μm2) | RMSEdiffusive (μm2) |
|---|---|---|
| 1 | 16.27 | 24.2 |
| 2 | 15.8 | 22.5 |
| 3 | 39.4 | 55.2 |
| 4 | 38.3 | 53.6 |
| 5 | 12.35 | 17.66 |
| 6 | 13.81 | 12.69 |
| 7 | 12.68 | 11.89 |
Another measure of the openness of a PVS is the tortuosity of the particle paths. Here, we shall use the simplest definition of the tortuosity λ,
where P is the actual total length of the particle path and L is the straight-line distance between the endpoints of the particle path, as illustrated in figure 3. Numerical values of the tortuosity for the same eight experiments are plotted in figure 3. The values of the tortuosity cluster closely around a mean value of 1.0674 ± 0.0294, indicating paths only slightly longer than a straight line, which is likely due to slight curvature of the PVS axis. A much larger value of the tortuosity is to be expected for flow through a porous medium, as the fluid moves around solid obstacles. For example, brain extracellular space has tortuosity λ = 1.6 [24].
4. Velocity profiles
Another approach to distinguish between an open and a porous periarterial space is to examine velocity profiles, that is, the variation of downstream velocity across the PVS. For an open periarterial space, the mean velocity profile will be parabolic-like, varying smoothly and gradually from zero at the artery wall to a maximum near the centre of the channel and back to zero at the outer boundary of the periarterial space. For a space with low porosity, the velocity profile will be nearly uniform across the entire width of the channel. The stark difference in velocity profile occurs because flow in an open space is governed by the Navier–Stokes equation, in which the velocity is required to be zero at the stationary boundaries and viscosity provides smoothing; but flow in a porous medium is governed by the Darcy equation, in which a porosity term appears instead, and the velocity is not required to be zero at the stationary boundaries.
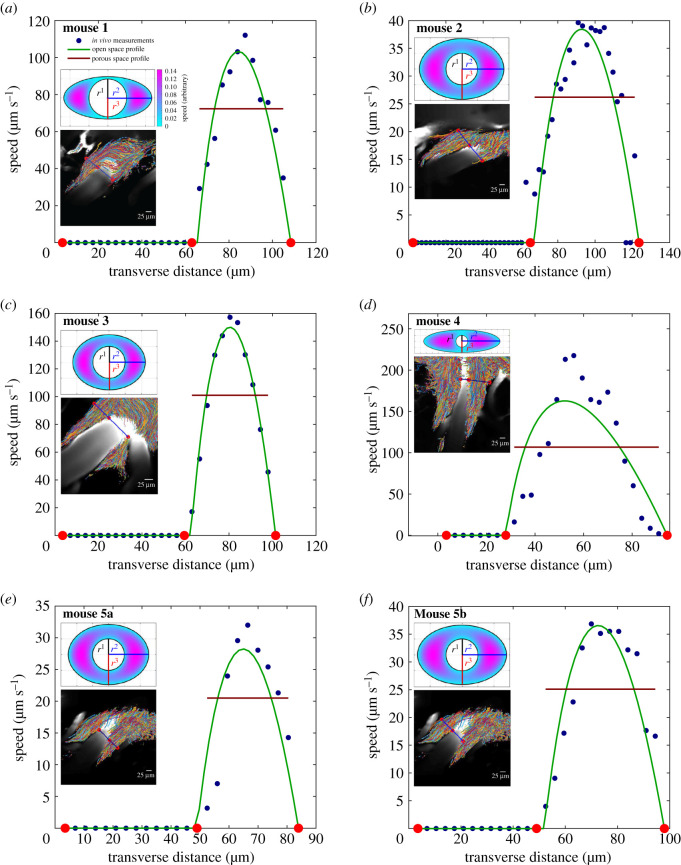
In order to make an objective, quantitative assessment of the velocity profiles, we compared experimental profiles to theoretical profiles corresponding to an open or porous periarterial space. To obtain a mean velocity profile from a particle tracking experiment, we first divided the field of view into a grid of square regions of uniform size (with a side length of either 2 or 3 pixels, corresponding to 2.3 μm or 3.5 μm), and time-averaged all measurements in each region to produce a local mean. The different grid sizes were chosen empirically so that regions were small enough to reveal detailed flow features, but large enough to sample a robust number of tracer particles during an experiment (typically 10 or more). Then we drew a line transverse to the PVS and linearly interpolated the perpendicular component of the velocity onto the line. Six examples are shown in figure 4, along with images of the PVSs and the particle tracks from which profiles were calculated.
Figure 4.
Six different comparisons between experimentally measured mean flow velocities (blue dots) and theoretical velocity profiles for flow in the open-space model (solid green curves) and the porous model (solid red lines). The lower inset in each panel shows an image of the PVS overlaid with the particle paths: the solid blue line shows the cross section used for the experimentally measured mean flow velocity, with red dots indicating the locations of the edges of the PVS. The upper inset in each panel shows the elliptic-annulus model fitted to the corresponding PVS cross section and the theoretical velocity profile for Poiseuille flow in that open-space model. Panels (a–d) each show a single lobe of a PVS in a different mouse, and panels (e–f) show the right and left lobes of a PVS in the same mouse.
Considering the case of open PVSs, we used results from Tithof et al. [14] in which the velocity profiles for steady Poiseuille flow were computed from the Navier–Stokes equation, based on a concentric elliptical annulus model. The geometry of this model uses a circle of radius r1 as the inner boundary (artery wall) and an ellipse, with semi-major axis r2 and semi-minor axis r3, as the outer boundary of the periarterial space. This geometry is characterized by two non-dimensional parameters: α = r2/r1 and β = r3/r1. Since we did not perform measurements to determine the precise cross-sectional shape of the periarterial space, we instead performed a least-squares fit to determine the values of α and β that best match the measurements, as well as the constant factor for scaling the velocity profile. This fit was performed by comparing the experimental profile to the mid-plane profile from the open-space model. Considering the alternative case of PVSs filled with porous media, we calculated uniform velocity profiles that most closely match the experimental measurements, again using least-squares fits.
Figure 4 shows the results. In all six imaging sessions from five different mice, parabolic-like velocity profiles from the open-space model evidently fit the measurements much better than uniform velocity profiles from the porous model. To quantify, we compared using the F-test for nested models
where RSSP is the residual sum of squares for the porous model, RSSO is the residual sum of squares for the open-space model, νO = 2 is the number of degrees of freedom for the open-space model, νP = 1 is the number of degrees of freedom for the porous model, and n is the number of experimental measurements along the velocity profile. The parameters for each test are shown in table 2. F indicates the degree to which the open-space model fits measurements better than the porous model; larger values of F favour the open-space model more strongly. To quantify the statistical significance of those F values, we calculated associated p-values, defined as the probability of F matching or exceeding its calculated value by random chance alone. The resulting p-values, listed in table 2, are 1.6 × 10⁻² or smaller. We define a result as statistically significant if p < 0.05, so in all 6 cases, the open-space model fits in vivo measurements better than the porous model.
Table 2.
Statistics of velocity profile fits: number n of experimental measurements, F-test results, and probabilities p of those results occurring randomly. In every case, p < 0.05, showing that the open-space model fits the data significantly better than the porous model.
| mouse | n | F | p-value |
|---|---|---|---|
| 1 | 12 | 62.6 | 1.3 × 10⁻⁵ |
| 2 | 24 | 75.1 | 1.5 × 10⁻⁸ |
| 3 | 11 | 530 | 2.6 × 10⁻⁹ |
| 4 | 18 | 35.1 | 2.1 × 10⁻⁵ |
| 5a | 13 | 49.5 | 2.2 × 10⁻⁵ |
| 5b | 9 | 9.98 | 1.6 × 10⁻² |
The accuracy of the two models can also be evaluated by quantifying the goodness of fit in each case. To do so, we calculated the normalized error, defined as the residual sum of squares, divided by the square of the mean measured velocity. Figure 5 shows the results: the normalized error is significantly lower for the open-space model. The difference remains significant even if we exclude the two datasets for which the normalized error of the porous model is highest (p < 0.001). Thus, the parabola-like velocity profiles predicted for open PVSs more accurately model measured flows in pial periarterial spaces than the uniform profiles predicted for PVSs filled with porous media.
Figure 5.
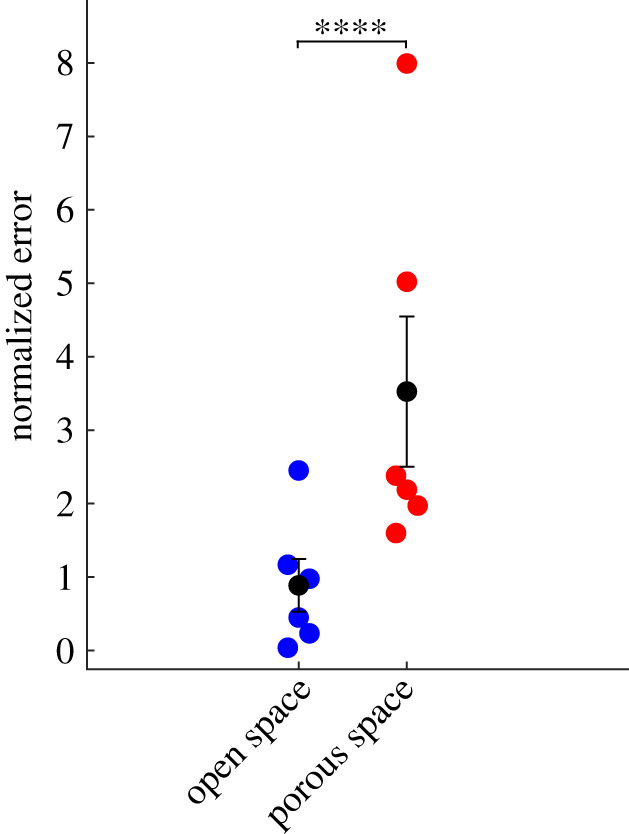
Normalized least squared errors of the open-space model (blue dots) and porous model (red dots), for all six cases shown in figure 4. Black dots and bars indicate the mean and standard error of the mean. The open-space model has significantly lower error (p = 5.9 × 10⁻⁶, ****p-value ≤0.0001).
The intermediate case of Darcy–Brinkman flow also deserves discussion. In that case, fluid motion is subject to both viscous smoothing and porosity. The dimensionless Darcy number Da = L/κ1/2, where κ is the Darcy permeability, quantifies the relative importance of the two processes [25]. If Da = 0, the flow is purely viscous, Navier–Stokes flow. If Da = ∞, the flow is purely porous, Darcy flow. For intermediate values of Da, the flow approximates Navier–Stokes dynamics near the boundaries, in layers of thickness κ1/2, and approximates Darcy dynamics elsewhere. Far from boundaries, the velocity profile is nearly flat. In vivo measurements show little or no flat region (figure 4), consistent with low values of Da, characteristic of flow in open spaces.
5. Hydraulic resistance: open versus porous periarterial spaces
Perhaps the most significant implication of the discovery that the PVSs around pial arteries are open rather than porous is that an open space offers much lower hydraulic resistance to the flow of CSF than does a porous space. The hydraulic resistance (per unit length) of a uniform channel carrying a steady (Poiseuille) flow with volume flow rate Q (volume per unit time), driven by an axial pressure gradient dp/dz, is given by the relation (the pressure gradient dp/dz is negative for flow in the positive z-direction). This hydraulic ‘Ohm’s law’ is the basis for hydraulic models of the flow in the interconnected PVS system.
In unsteady flows, Q ∝ −dp/dz and the hydraulic resistance continues to be a useful constant only if inertial effects are negligible. The importance of inertial effects in an oscillatory flow is measured by the non-dimensional dynamic Reynolds number Rd ≡ ℓ2ω/ν, where ℓ is a length scale for variation in the velocity, ω is the angular frequency of the oscillations and ν is the kinematic viscosity.1 For the periarterial flows considered here, Rd ≪ 1 and hence inertial effects are small, and at each instant the profile is the same as that of a steady flow with the same pressure gradient, making the hydraulic resistance relevant to physiological flows.
To illustrate the difference in hydraulic resistance between open and porous PVSs, let us consider steady flow driven by a constant axial pressure gradient in a uniform PVS whose cross-section is a concentric circular annulus. We use cylindrical coordinates r, θ, z with the z-axis along the centreline and with r1 and r2 denoting the inner and outer radii of the annulus, respectively. For an open annulus, we consider the CSF to be a Newtonian fluid satisfying the Navier–Stokes equation. The flow is axisymmetric (independent of θ) and the total volume flow rate is given by [26]
where μ is the dynamic viscosity, and the corresponding hydraulic resistance is given by
Now let us instead suppose that the annulus is filled with a uniform porous medium and apply the Darcy law for the flow of CSF. The Darcy flux q (fluid volume per unit area per unit time) is uniform across the cross section and is given by
The total volume flow rate is given by
where A is the cross-sectional area of the annulus, and the corresponding hydraulic resistance is thus
To compare these hydraulic resistances, it is useful to consider their ratio, , given by
where γ ≡ r2/r1 is the aspect ratio of the annulus. We can estimate the value of this ratio for a typical PVS around a pial artery in a mouse brain. For the permeability, we can use the baseline value given by Wang & Olbricht [10], κ = 1.8 × 10⁻² μm2, and a good estimate of the inner radius is r1 = 20 μm [7]: this gives . A typical value of the cross-sectional area ratio is 1.4 [7], giving γ2 = 2.4 and a resistance ratio ; i.e. the porous PVS offers more than five hundred times the resistance to flow than does the open PVS. Note that the hydraulic resistance of the porous annulus is proportional to the cross-sectional area of the annulus, whereas the resistance of the open annulus is more nearly proportional to the square of the area. Hence, their ratio increases with increasing area ratio. For example, for the largest observed pial PVSs, with aspect ratio near γ = 2, we obtain .
The porosity does not uniquely specify pore sizes. For example, a mix of large and small pores can result in the same porosity as a uniform collection of pores of moderate size. Pore size may be of interest, since particles larger than pores would be filtered out of the fluid. We find no evidence that the 1-μm tracer particles used for visualization are filtered out of fluid in the surface PVSs. However, the particles do not pass into penetrating PVSs, which lie beyond the scope of this work but are an important topic for future study, as discussed further below.
In the simple example above, we considered the PVS to be in the form of a concentric circular annulus. However, experiments have shown that the PVSs around surface arteries and penetrating arteries in the mouse brain are seldom of this configuration: the outer boundary is often flattened, the artery is often not concentric within the PVS, and the PVS is sometimes split into two different lobes [7,14]. In a previous paper [14], we calculated the hydraulic resistance for these configurations, based on an adjustable model of an open annulus consisting of an inner circle (the outer surface of the artery) and an outer ellipse (the outer boundary of the PVS, not necessarily concentric). For this model, the hydraulic resistance of an annulus of fixed cross-sectional area changes as one changes the shape (flatness of the ellipse) or the eccentricity, leading to optimal configurations (with least resistance) that are not concentric circular annuli.
On the other hand, if the annulus is porous rather than open, and the Darcy law applies, then, for fixed cross-sectional area Apvs of the PVS, the hydraulic resistance is the same no matter what the shape of the PVS. The Darcy flux q is uniform over the cross section, so changing the shape of the cross section does not change the volume flux Q = Apvsq. We showed [14], for example, that the hydraulic resistance of an open circular annulus is reduced by a factor of about 2.5 just by maximizing the eccentricity, letting the inner circle touch the outer circle; for a porous annulus, the resistance is unaffected by making it eccentric.
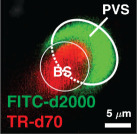
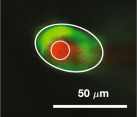
Table 3 shows values of the scaled, non-dimensional hydraulic resistance () of four different observed mouse periarterial spaces considered by Tithof et al. [14], assuming them to be either open or porous. For the porous spaces, we have computed the resistance for the three different values (high, benchmark and low) of the Darcy permeability κ used by Wang & Olbricht [10]. The examples in the top two rows are PVSs around pial arteries, and we see here that the hydraulic resistance of these spaces would be at least 40 times greater, or perhaps as much as a thousand times greater, if they were porous rather than open. The examples in the bottom two rows are PVSs around penetrating arteries: we do not know whether these spaces are essentially open or porous, but we see that the porous resistance is at least a factor of ten greater. The importance of determining the nature of the PVS is clear: the pressure difference and energy required to drive flow depend strongly on whether the spaces are open or porous. That fact is important for past and future work considering hydraulic network models of the perivascular system.
Table 3.
Non-dimensional hydraulic resistance for open and porous PVSs based on in vivo images: and , respectively. PVS shapes are reproduced from [14] and were originally published in [7,27–29], respectively. Assuming the space to be filled with a porous medium, instead of open, results in hydraulic resistance at least 10 times higher, and in some cases, more than 1000 times higher.
| porous PVS |
||||
|---|---|---|---|---|
| PVS shape | open PVS | low: κ = 0.18 μm2 m4N−1s−1 |
benchmark: κ = 0.018 μm2 m4N−1s−1 |
high: κ = 0.0018 μm2 m4N−1s−1 |
 |
48.0 | 1810 | 18 100 | 181 000 |
 |
1.01 | 178 | 1780 | 17 800 |
 |
3.30 | 32.1 | 321 | 3210 |
 |
0.173 | 15.5 | 155 | 1550 |
6. Discussion
In this article, we have provided two primary lines of evidence that pial periarterial spaces are open, not porous: (1) paths of particles flowing in periarterial spaces are smooth with a tortuosity near 1 and (2) the experimentally measured velocity profile across the periarterial space is captured much more accurately by a parabola-like profile from an open-space model than a uniform profile from a porous model. We should also point out that prior experimental observations demonstrate that these spaces collapse post mortem, indicating that they contain little or no supporting tissue [7].
We emphasize that our finding of open, rather than porous, PVSs applies only to the surface (pial) arteries of the mouse brain. PVSs around penetrating arteries may also be open, although the reluctance of microspheres to enter these spaces may be because they are somewhat porous. PVSs surrounding smaller-diameter parts of the brain vasculature (arterioles, capillaries, venules) are likely to have supporting tissue and be effectively porous. PVSs surrounding surface veins may be open. Future work to establish the properties of the PVSs throughout the many levels of the branching vasculature in the brain could put fluid-dynamic modelling on a firmer footing and lead to important clinical implications.
We have also explored one important implication of the fact that pial periarterial spaces are open, namely, that as such they offer much less hydraulic resistance than if they were porous, thereby allowing greater flow of CSF for a given driving force. This new information is a small but important step toward constructing an overall hydraulic network model of CSF flow in the brain.
In an earlier paper on the hydraulic resistance of open PVSs of various shapes [14], we found that the shapes of PVSs around surface and penetrating arteries were very nearly optimal, in the sense of offering the least hydraulic resistance for their given cross-sectional area. We suggested that these optimal shapes might be the result of evolutionary adaptation, in order to maximize the flow of CSF in the brain as an important clearance mechanism for metabolic waste products. However, if these PVSs were porous, rather than open, there would be no advantage for them to assume the strongly asymmetric shapes we observe. This suggests the possibility that PVSs with lower porosity are more likely to be flattened or eccentric, whereas PVSs with higher porosity may not be.
There are several assumptions, limitations, and potential improvements for the results presented herein. We are able to track particles and measure velocity profiles only in surface PVSs; making strong conclusions about penetrating PVSs would require better measurements there. The open space (parabola-like) velocity profile, which was fit to several experimentally measured velocity profiles (figure 4) is based on idealized assumptions: that the circle-and-ellipse model accurately captures the periarterial geometry and that the experimental measurements correspond to the mid-plane of the periarterial space. The open space velocity profile could be further improved by accurately modelling the cross-sectional shape of the periarterial space or allowing for the theoretical profile to be fit for an arbitrary orientation.
Acknowledgements
We thank Malisa Sarntinoranont for suggesting that we compare experimental and theoretical velocity profiles.
Endnote
The Womersley number is sometimes used for this comparison, but the dynamic Reynolds number R itself is more appropriate here because it measures the actual ratio of the inertial and viscous terms in the Navier–Stokes equation.
Data accessibility
All relevant data are available from the authors.
Authors' contributions
D.H.K., M.N., J.H.T. and J.T. developed the basic ideas and designed and coordinated the study. H.M. and T.D. performed the in vivo mouse experiments. D.H.K. and B.C.M. analysed the particle tracks. F.G.M.-R. and J.T. analysed the velocity profiles. J.L. and J.H.T. did the analysis of hydraulic resistance. J.H.T., D.H.K. and J.T drafted the manuscript. All authors gave final approval for publication.
Competing interests
We declare we have no competing interests.
Funding
This work was supported by the NIH/National Institute of Aging (grant no. RF1AG057575) and by the US Army Research Office (grant no. MURI W911NF1910280). J.T. is partially supported by a Career Award at the Scientific Interface from Burroughs Wellcome Fund.
Disclaimer
The views and conclusions contained in this review are solely those of the authors and should not be interpreted as representing the official policies, either expressed or implied, of the National Institutes of Health, the Army Research Office, or the US Government. The US Government is authorized to reproduce and distribute reprints for Government purposes notwithstanding any copyright notation herein.
References
- 1.Ray LA, Heys JJ. 2019. Fluid flow and mass transport in brain tissue. Fluids 4, 196 ( 10.3390/fluids4040196) [DOI] [Google Scholar]
- 2.Hladky SB, Barrand MA. 2018. Elimination of substances from the brain parenchyma: efflux via perivascular pathways and via the blood–brain barrier. Fluids Barriers CNS 15, 30 ( 10.1186/s12987-018-0113-6) [DOI] [PMC free article] [PubMed] [Google Scholar]
- 3.Plog BA, Nedergaard M. 2018. The glymphatic system in central nervous system health and disease: past, present, and future. Annu. Rev. Pathol.-Mech. 13, 379–394. ( 10.1146/annurev-pathol-051217-111018) [DOI] [PMC free article] [PubMed] [Google Scholar]
- 4.Asgari M, de Zélicourt D, Kurtcuoglu V. 2016. Glymphatic solute transport does not require bulk flow. Sci. Rep. 6, 38635 ( 10.1038/srep38635) [DOI] [PMC free article] [PubMed] [Google Scholar]
- 5.Abbott NJ, Pizzo ME, Preston JE, Janigro D, Thorne RG. 2018. The role of brain barriers in fluid movement in the CNS: is there a ‘glymphatic’ system? Acta Neuropathol. 135, 1–21. [DOI] [PubMed] [Google Scholar]
- 6.Mestre H, Mori Y, Nedergaard M. 2020. The brain’s glymphatic system: current controversies. Trends Neurosci. 43, 458–466. ( 10.1016/j.tins.2020.04.003) [DOI] [PMC free article] [PubMed] [Google Scholar]
- 7.Mestre H. et al. 2018. Flow of cerebrospinal fluid is driven by arterial pulsations and is reduced in hypertension. Nat. Commun. 9, 4878 ( 10.1038/s41467-018-07318-3) [DOI] [PMC free article] [PubMed] [Google Scholar]
- 8.Bedussi B, Almasian M, de Vos J, VanBavel E, Bakker ENTP. 2017. Paravascular spaces at the brain surface: low resistance pathways for cerebrospinal fluid flow. J. Cerebr. Blood F. Met. 38, 719–726. ( 10.1177/0271678x17737984) [DOI] [PMC free article] [PubMed] [Google Scholar]
- 9.Schley D, Carare-Nnadi R, Please CP, Perry VH, Weller RO. 2006. Mechanisms to explain the reverse perivascular transport of solutes out of the brain. J. Theor. Biol. 238, 962–974. ( 10.1016/j.jtbi.2005.07.005) [DOI] [PubMed] [Google Scholar]
- 10.Wang P, Olbricht WL. 2011. Fluid mechanics in the perivascular space. J. Theor. Biol. 274, 52–57. ( 10.1016/j.jtbi.2011.01.014) [DOI] [PubMed] [Google Scholar]
- 11.Rey J, Sarntinoranont M. 2018. Pulsatile flow drivers in brain parenchyma and perivascular spaces: a resistance network model study. Fluids Barriers CNS 15, 20 ( 10.1186/s12987-018-0105-6) [DOI] [PMC free article] [PubMed] [Google Scholar]
- 12.Kedarasetti R, Drew PJ, Costanzo F. 2020. Arterial pulsations drive oscillatory flow of CSF but not directional pumping. Sci. Rep. 10, 10102 ( 10.1038/s41598-020-66887-w) [DOI] [PMC free article] [PubMed] [Google Scholar]
- 13.Faghih MM, Sharp MK. 2018. Is bulk flow plausible in perivascular, paravascular and paravenous channels? Fluids Barriers CNS 15, 17 ( 10.1186/s12987-018-0103-8) [DOI] [PMC free article] [PubMed] [Google Scholar]
- 14.Tithof J, Kelley DH, Mestre H, Nedergaard M, Thomas JH. 2019. Hydraulic resistance of perivascular spaces in the brain. Fluids Barriers CNS 16, 19 ( 10.1186/s12987-019-0140-y) [DOI] [PMC free article] [PubMed] [Google Scholar]
- 15.Thomas JH. 2019. Fluid dynamics of cerebrospinal fluid flow in perivascular spaces. Proc. R. Soc. Interface 16, 20190572 ( 10.1098/rsif.2019.0572) [DOI] [PMC free article] [PubMed] [Google Scholar]
- 16.Coles JA, Myburgh E, Brewer JM, McMenamin PG. 2017. Where are we? The anatomy of the murine cortical meninges revisited for intravital imaging, immunology, and clearance of waste from the brain. Prog. Neurobiol. 156, 107–148. ( 10.1016/j.pneurobio.2017.05.002) [DOI] [PubMed] [Google Scholar]
- 17.Xavier AL, Hauglund NL, von Holstein-Rathlou S, Li Q, Sanggaard S, Lou N, Lundgaard I, Nedergaard M. 2018. Cannula implantation into the cisterna magna of rodents. JoVE 135, e57378 ( 10.3791/57378) [DOI] [PMC free article] [PubMed] [Google Scholar]
- 18.Sweeney AM. et al. 2019. In vivo imaging of cerebrospinal fluid transport through the intact mouse skull using fluorescence macroscopy. JoVE 149, e59774 ( 10.3791/59774) [DOI] [PMC free article] [PubMed] [Google Scholar]
- 19.Du T. et al. Submitted Osmotic swelling via cerebrospinal fluid influx drives cerebral edema formation after cardiac arrest.
- 20.Dreier JP. 2011. The role of spreading depression, spreading depolarization and spreading ischemia in neurological disease. Nat. Med. 17, 439–447. ( 10.1038/nm.2333) [DOI] [PubMed] [Google Scholar]
- 21.Kelley DH, Ouellette NT. 2011. Using particle tracking to measure flow instabilities in an undergraduate laboratory experiment. Am. J. Phys. 79, 267–273. ( 10.1119/1.3536647) [DOI] [Google Scholar]
- 22.Ouellette NT, Xu H, Bodenschatz E. 2006. A quantitative study of three-dimensional Lagrangian particle tracking algorithms. Exp. Fluids 40, 301–313. ( 10.1007/s00348-005-0068-7) [DOI] [Google Scholar]
- 23.Ma Q, Ries M, Decker Y, Müller A, Riner C, Bücker A, Fassbender K, Detmar M, Proulx ST. 2019. Rapid lymphatic efflux limits cerebrospinal fluid flow to the brain. Acta Neuropathol. 137, 151–165. ( 10.1007/s00401-018-1916-x) [DOI] [PMC free article] [PubMed] [Google Scholar]
- 24.Syková E, Nicholson C. 2008. Diffusion in brain extracellular space. Physiol. Rev. 88, 1277–1340. (doi:PMID: 18923183) [DOI] [PMC free article] [PubMed] [Google Scholar]
- 25.Sharp MK, Carare RO, Martin B. 2019. Dispersion in porous media in oscillatory flow between plates: applications to intrathecal, periarterial and paraarterial solute transport in the central nervous system. Fluids Barriers CNS 16, 13 ( 10.1186/s12987-019-0132-y) [DOI] [PMC free article] [PubMed] [Google Scholar]
- 26.White F. 2006. Viscous fluid flow, 3rd edn New York, NY: McGraw-Hill. [Google Scholar]
- 27.Schain AJ, Melo-Carrillo A, Strassman AM, Burstein R. 2017. Cortical spreading depression closes paravascular space and impairs glymphatic flow: implications for migraine headache. J. Neurosci. 37, 2904–2915. ( 10.1523/JNEUROSCI.3390-16.2017) [DOI] [PMC free article] [PubMed] [Google Scholar]
- 28.Iliff JJ, Wang M, Liao Y, Plogg BA, Peng W, Gundersen GA, Benveniste H, Vates GE, Deane R, Goldman SA, Nagelhus EA, Nedergaard M. 2012. A paravascular pathway facilitates CSF flow through the brain parenchyma and the clearance of interstitial solutes, including amyloid β. Sci. Trans. Med. 4, 147ra111 ( 10.1126/scitranslmed.3003748) [DOI] [PMC free article] [PubMed] [Google Scholar]
- 29.Achariyar TM. et al. 2017. Glymphatic distribution of CSF-derived apoE into brain is isoform specific and suppressed during sleep deprivation. Mol. Neurodegener 11, 74 ( 10.1186/s13024-016-0138-8) [DOI] [PMC free article] [PubMed] [Google Scholar]
Associated Data
This section collects any data citations, data availability statements, or supplementary materials included in this article.
Data Availability Statement
All relevant data are available from the authors.


