Abstract
School‐based healthy living interventions are widely promoted as strategies for preventing obesity. The peer‐led Healthy Buddies™ curriculum has been shown to improve obesity‐related outcomes in school‐aged children. We examined whether these improvements existed among subgroups of children stratified by sex, income level and urban/rural geography. In a cluster‐randomized controlled trial, elementary schools in Manitoba, Canada, were randomly allocated to Healthy Buddies™ (10 schools, 340 students) or standard curriculum (10 schools, 347 students). Healthy Buddies™ participants had 21weekly lessons on healthy eating, physical activity and self‐efficacy, delivered by children age 9–12 to children age 6–8. We assessed pre‐ and post‐intervention body mass index (BMI) z‐scores, waist circumference, healthy living knowledge, dietary intake and self‐efficacy among the younger children. Compared to standard curriculum (n = 154), Healthy Buddies™ participants (n = 157) experienced a greater reduction in waist circumference (−1.7 cm; 95% confidence interval [CI][−2.8, −0.5 cm]) and improved dietary intake (4.6; 95% CI [0.9, 8.3]), healthy living knowledge (5.9; 95% CI [2.3, 9.5]) and self‐efficacy (5.3; 95% CI [1.0, 9.5]) scores. In subgroup analyses, effects for waist circumference (−2.0 cm; 95% CI [−3.6, −0.5]), healthy living knowledge (9.1; 95% CI [4.4, 13.8]) and self‐efficacy (8.3; 95% CI [3.3, 13.3]) were significant among boys. Dietary intake (10.5; 95% CI [5.5, 15.4]), healthy living knowledge (9.8; 95% CI [4.5, 15.0]) and self‐efficacy (6.7; 95% CI [0.7, 12.7]) improved among urban‐dwelling but not rural‐dwelling children. Healthy Buddies™ was effective for boys and children living in urban settings. Enhanced curricula may be needed to improve program effectiveness for select subgroups of school‐aged children.
Keywords: childhood obesity, health outcomes, health promotion, healthy living intervention, inequalities, randomized controlled trial, school‐based intervention, socio‐economic factors
Key messages.
Childhood obesity rates can vary substantially between male and female children and across different socio‐economic groups and geographical regions.
The Healthy Buddies™ curriculum improved obesity‐related outcomes in children, but the effects were seen mainly in boys and children living in lower income neighbourhoods or urban areas.
As well, improved health behaviour outcomes among urban and rural subgroups in the intervention arm were largely driven by children living in urban areas.
These findings highlight opportunities to enhance the Healthy Buddies™ curriculum to more broadly improve participants' health and to ensure it is relevant for all subgroups of children.
1. INTRODUCTION
The childhood obesity epidemic in North America is a prominent public health concern. Canada and the United States rank among the top six OECD countries for childhood obesity prevalence (Organization for Economic Cooperation and Development, 2014), and currently 30%–40% of North American children aged 5–17 are obese or overweight (Sassi, 2010; Senate Committee on Social Affairs, 2016). Childhood obesity rates have increased more than threefold in the last three decades, which is alarming given the deleterious impacts that obesity is shown to have on short‐ and long‐term health (World Health Organization, 2000). Childhood obesity has been linked to cardiovascular disease, type 2diabetes and other related chronic conditions later in life (Llewellyn, Simmonds, Owen, & Woolacott, 2016; Reilly & Kelly, 2011).
The structural and social determinants of health play a role in the childhood obesity epidemic. While overweight and obesity rates have increased among all children, this is especially pronounced for children with low socio‐economic backgrounds (Krueger & Reither, 2015; Lane, Bluestone, & Burke, 2013), for children living in rural areas (The National Survey of Children's Health, 2011; Tu, Mâsse, Lear, Gotay, & Richardson, 2015) and in some instances for males versus females (Ogden, Carroll, Kit, & Flegal, 2014). These inequities in childhood obesity translate into even greater health disparities as children reach adulthood (Krueger & Reither, 2015). Interventions in childhood obesity need to take obesity risk factors, structural and socio‐demographic factors into consideration.
Schools are an ideal setting for obesity prevention efforts in children (Baranowski, Cullen, Nicklas, Thompson, & Baranowski, 2002; Bleich et al., 2018; Verrotti, Penta, Zenzeri, Agostinelli, & De Feo, 2014). Most school‐based lifestyle or healthy living interventions use multipronged approaches by encouraging higher levels of physical activity, healthier eating behaviours, and positive attitudes around self‐esteem and body image (Brown & Summerbell, 2009; van Stralen et al., 2011; Waters et al., 2011). The primary goal of most programs is to reduce body mass index (BMI) or BMI z‐scores, waist circumference and/or percent body fat among school‐age children. However, very few studies have examined the extent to which such programmes selectively benefit subgroups of children. Failing to address the social determinants of health in program delivery can inadvertently widen health inequities in the population as a whole (Curbing Childhood Obesity: A Federal, Provincial and Territorial Framework for Action to Promote Healthy Weights, 2012).
Our research team has conducted a cluster‐randomized controlled trial examining the differential effect of the Healthy Buddies™ school‐based obesity prevention curriculum in Manitoba, Canada (Santos, Durksen, Rabbanni, Chanoine, Lamboo Miln, et al., 2014b). These results show that Healthy Buddies™ was, on average, associated with improved obesity‐related outcomes among participants. The present study examines the extent to which these obesity‐related outcomes varied by participant sex, income level and urban/rural residence.
2. METHODS
2.1. Setting and participants
Healthy Buddies™ is a school‐based, peer‐led healthy living intervention for children designed and initiated by the British Columbia Children's Hospital (Stock et al., 2007). In 2009, three Manitoba government departments (Health, Education and the Manitoba Healthy Child Office) partnered to conduct a cluster‐randomized controlled trial to test the effect of this programme in Manitoba schools. An overview of the 833schools eligible to participate in the original study is provided in Figure 1. Eligible schools were required to provide their curriculum in English (tobe consistent with the original Healthy Buddies™ protocol) and had to have at least 200 students enrolled in grades 1–6 combined. Sixty‐one schools expressed an interest in participating. Ten of these schools were randomly selected from urban areas and 10from rural areas stratum, and using a random number generator, five schools from each geography were allocated to an intervention arm and five to a standard curriculum study arm. Each study arm therefore comprised 10schools equally divided between urban and rural geography. The randomization and allocation were conducted by an investigator who was not involved in data collection. Additional details of the randomization process are discussed elsewhere (Santos, Durksen, Rabbanni, Chanoine, Lamboo, Mayer, et al., 2014a).
FIGURE 1.
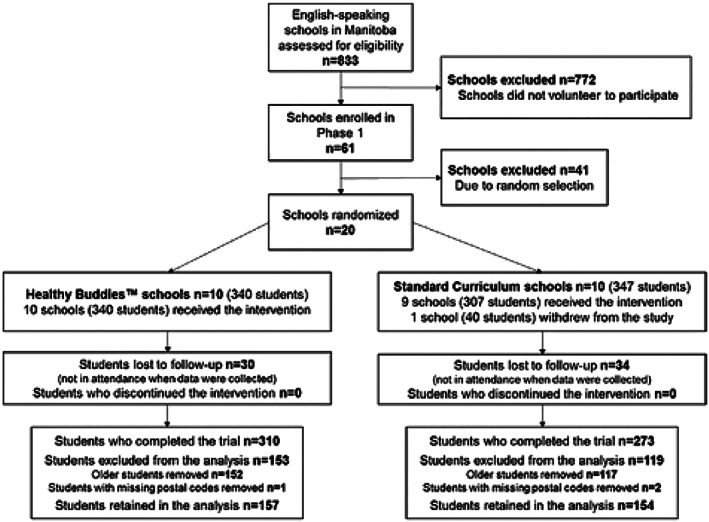
Study design and cohort development. Allocation of participating schools and students in the Manitoba Healthy Buddies™ randomized controlled trial
2.2. Intervention and comparison group
Details of the Healthy Buddies™ intervention and the overall effect of the intervention on anthropometric and behavioural outcomes in Canadian children have been previously described (Ronsley, Lee, Kuzeljevic, & Panagiotopoulos, 2013; Santos et al, 2014b). Briefly, Healthy Buddies™ consists of 21 healthy living lessons taught weekly in the classroom. Two teachers from each Healthy Buddies™ school received training to deliver the curriculum. Children in grades 4 to 6 (mentors; aged 9–12 years) were paired with children in grades 1 to 3 (mentees; aged 6–8 years), and weekly lesson plans were delivered in two stages: first from teachers to mentors in a 45‐min lesson, followed by a 30‐min mentor‐to‐mentee session held later that week. These lessons included topics on nutritious and non‐nutritious foods/beverages and energy balance (“Go Fuel!”); healthy body image, self‐efficacy, healthy growth and development, and media literacy (“Go Feel Good!”); and two 30‐min structured physical activity sessions per week in the gymnasium (“Go Move!”). Children in schools randomized to the control condition received standard health and physical education curriculum.
2.3. Study measures
The present study aimed to determine whether improvements documented in the Healthy Buddies™ intervention in Manitoba (Santos et al., 2014a) were experienced by all children taking part in the intervention and across several different social determinants; thus, the current study reports on only those outcomes previously shown to be significantly improved by the Healthy Buddies™ intervention in Manitoba. The main outcome measures were BMI z‐scores and waist circumference. Outcome measures were collected at the beginning (September 2009) and end (May 2010) of the academic year during day visits to each school. Research assistants responsible for collecting study outcomes were trained in anthropometric measurement and blinded to trial arm assignment. To develop BMI z‐scores, height (centimetres) and weight (kilograms) were measured in duplicate using a portable floor scale and stadiometer. Raw BMI scores were converted to z‐scores based on the Centers for Disease Control and Prevention growth charts (National Center for Health Statistics, 2009). Waist circumference (in centimetres) was measured using a flexible tape at the iliac crest.
2.3.1. Secondary outcomes
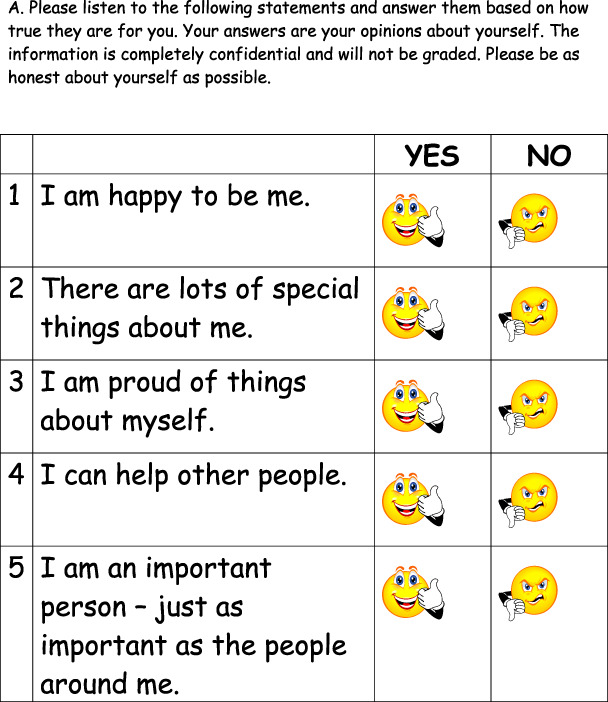
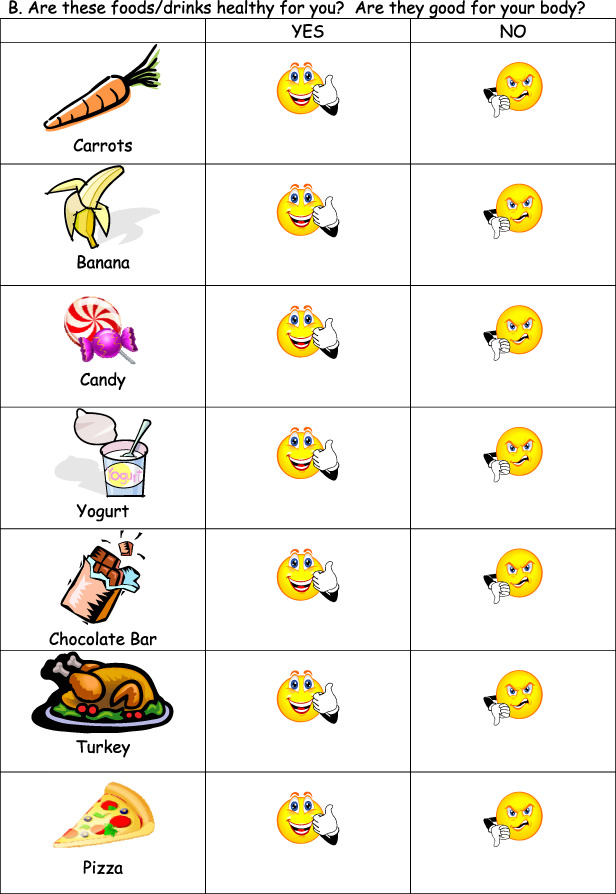
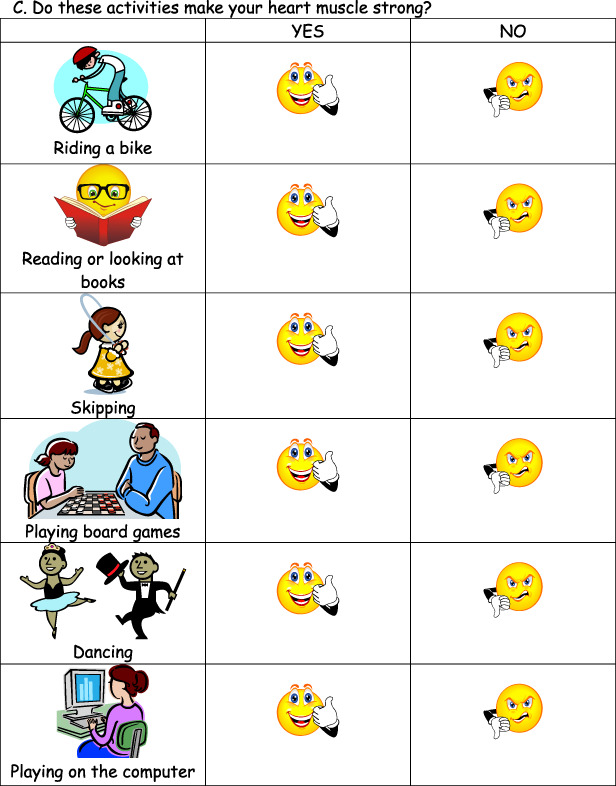
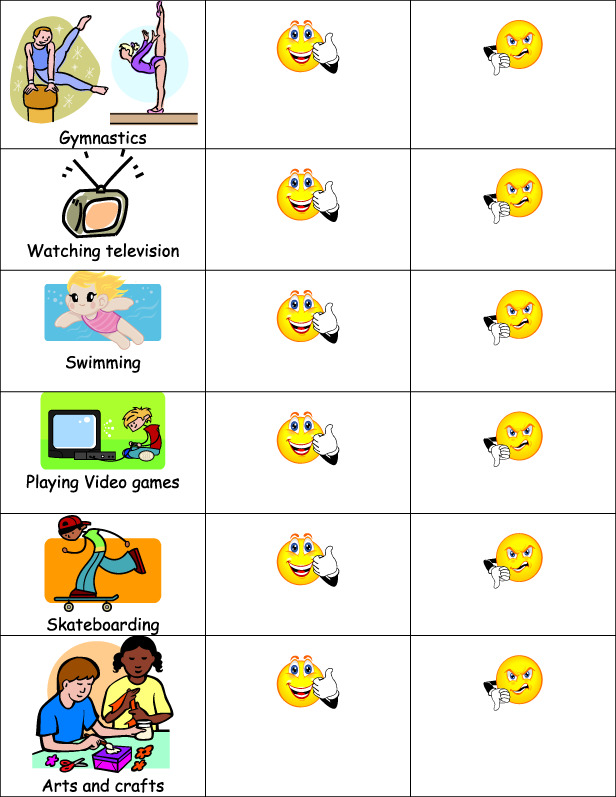
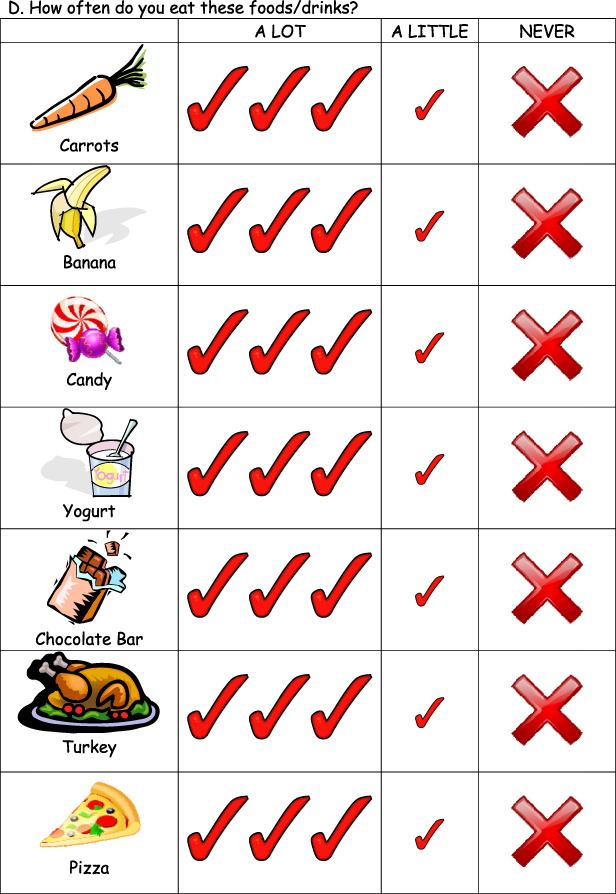
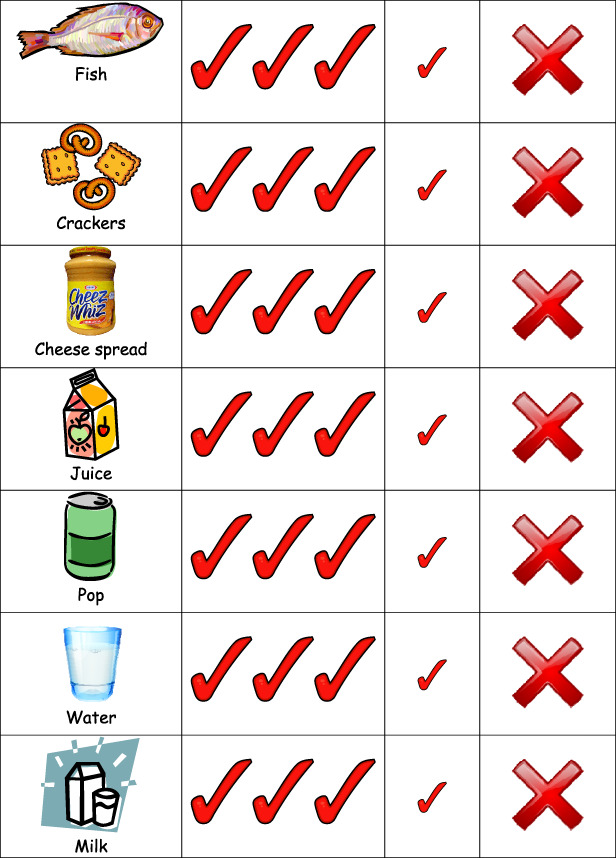
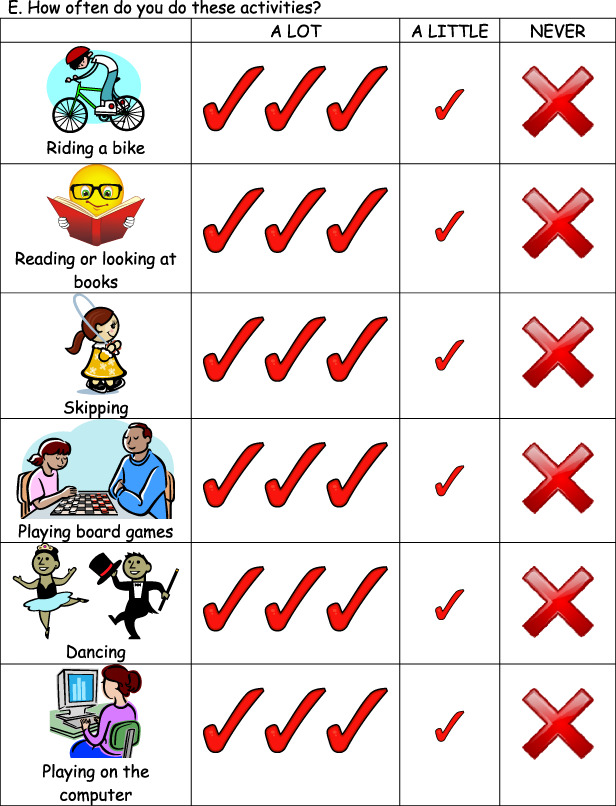
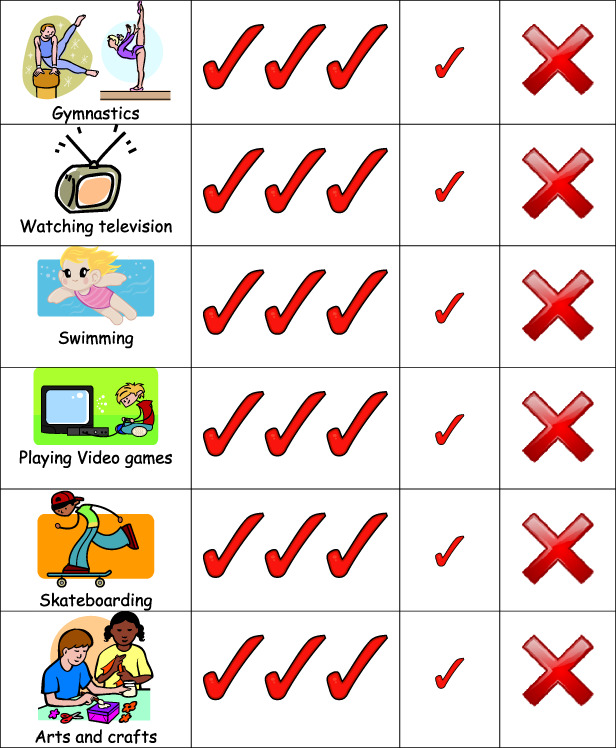
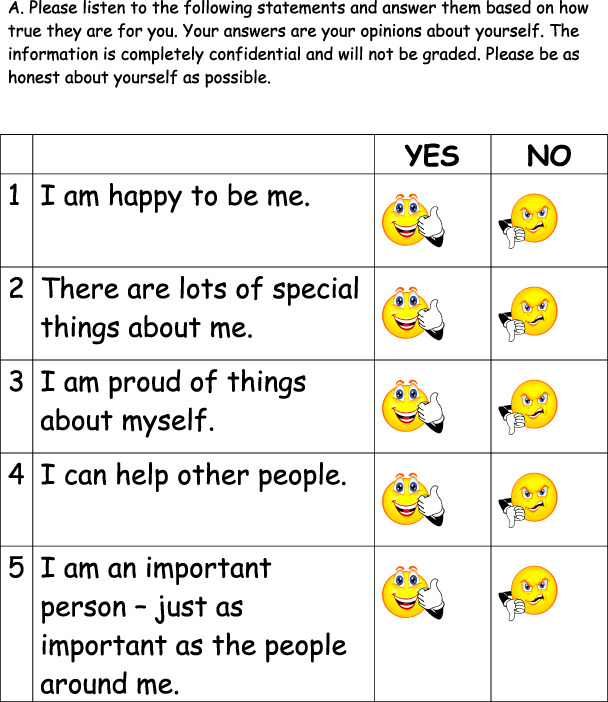
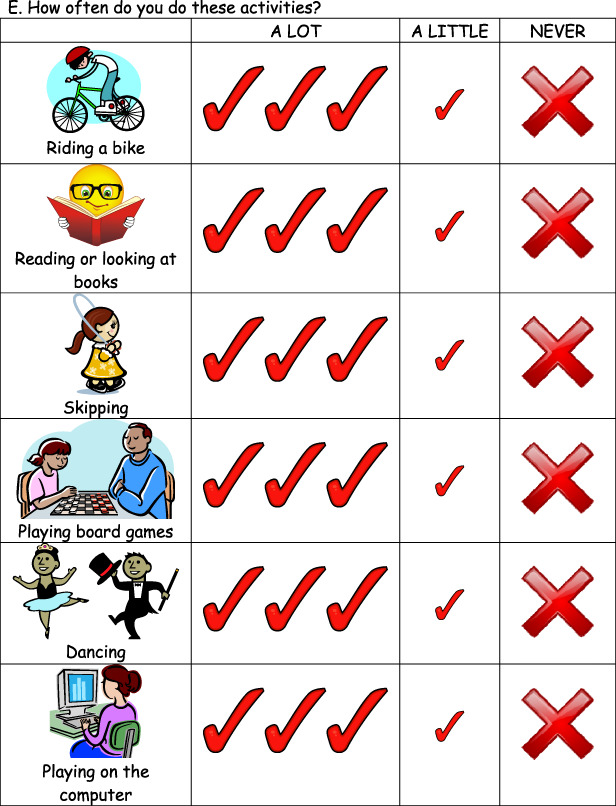
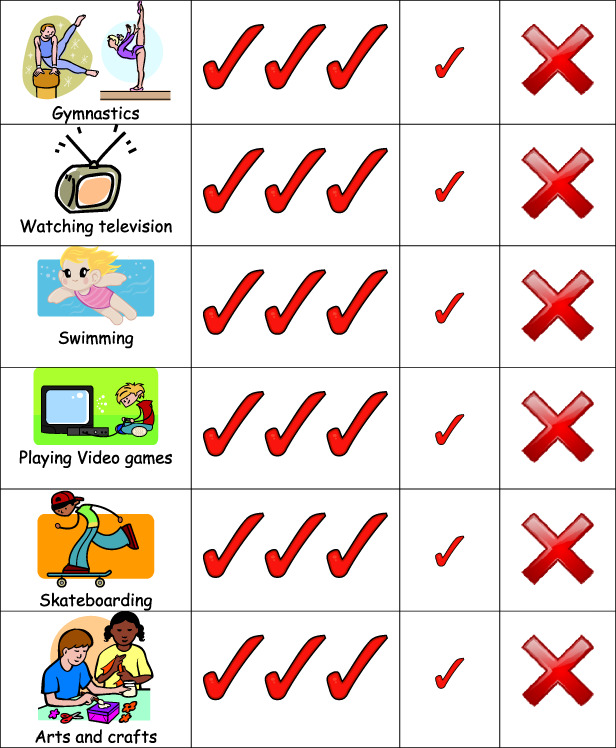
Secondary outcomes were measured using a modified version of the instrument developed by the Healthy Buddies™ research group at the BC Children's Hospital (Stock et al., 2007); they included measures related to health behaviour and learning: self‐reported dietary intake, healthy living knowledge and self‐efficacy. The instrument was simplified for the younger children in the study: instead of using words to score each answer, smiley/neutral/sad faces were used, and the number of questions was reduced to accommodate classroom schedules and time constraints at participating schools.
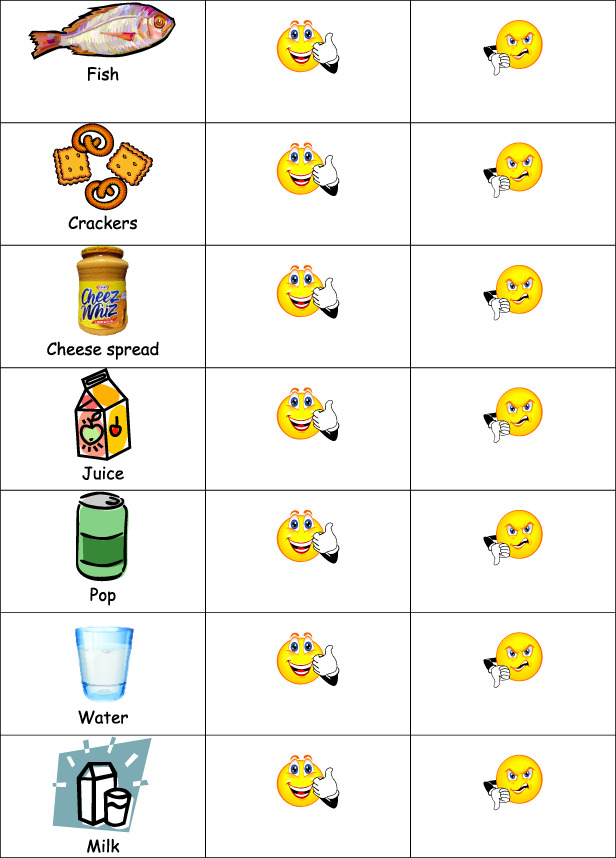
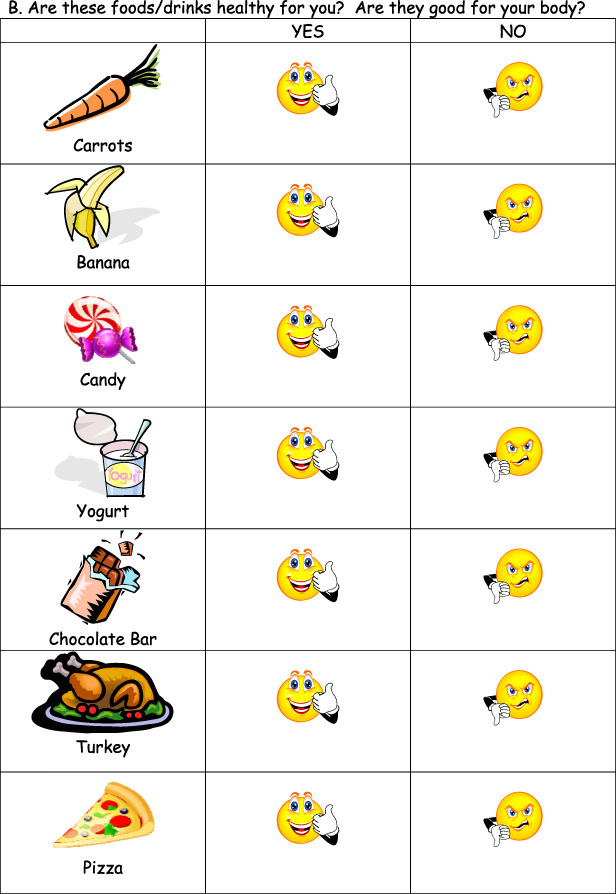
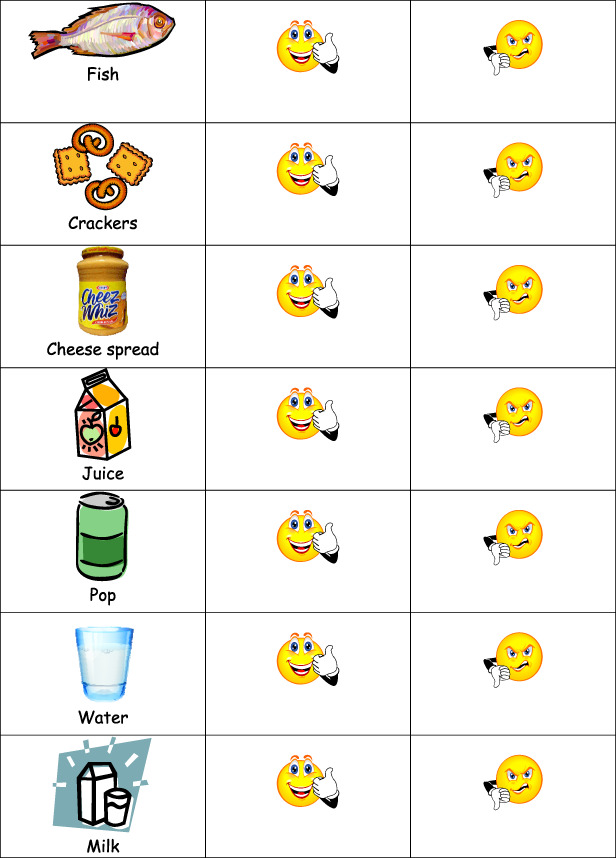
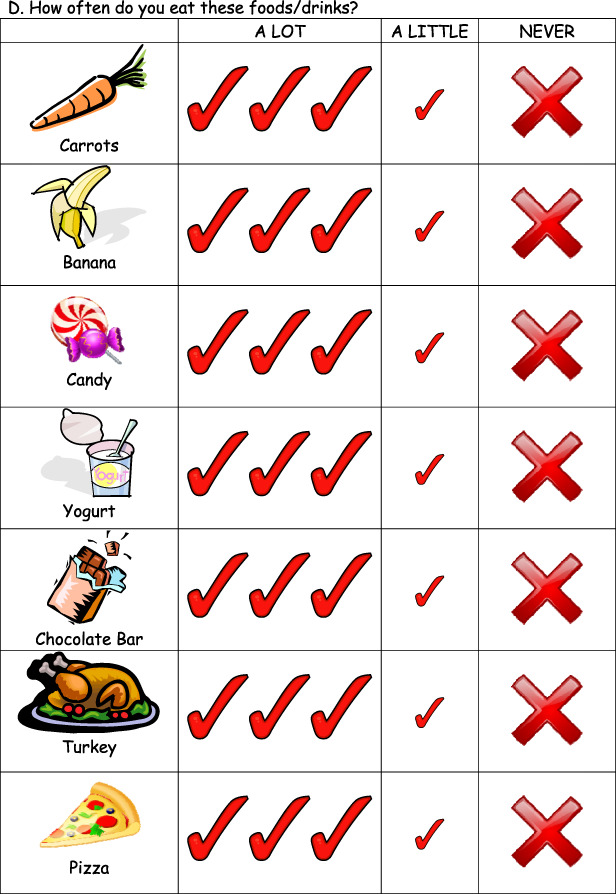
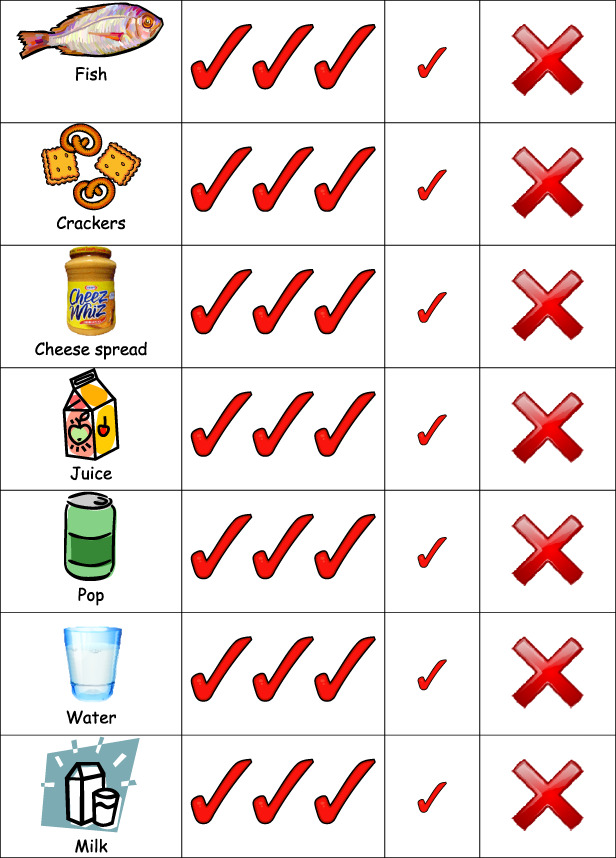
Self‐reported dietary intake was measured by asking students to report how often they ate different types of foods (using pictures of 14 different foods and a 3‐point scale for frequency – a lot, a little, never). Responses to these questions were categorized as positive (2 points), neutral (1 point) or negative (0 points), and scored as a percentage of total possible points out of 28.
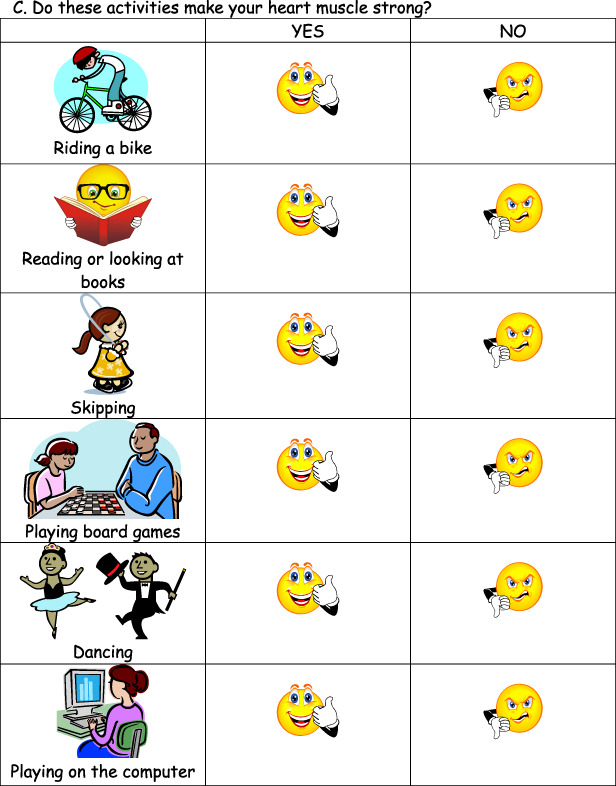
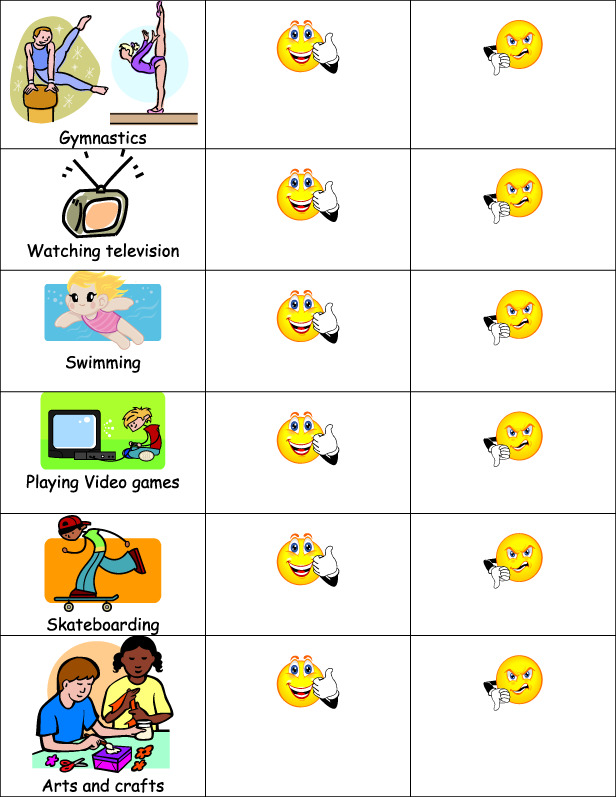
Healthy living knowledge was measured using 26 items, each on a 2‐point scale, for which the student identified a behaviour as healthy or not. Responses were scored as the percent of items the student scored correctly.
Self‐efficacy was assessed using 10 items, each on a 2‐point scale. Responses were scored as the percentage of total possible points received.
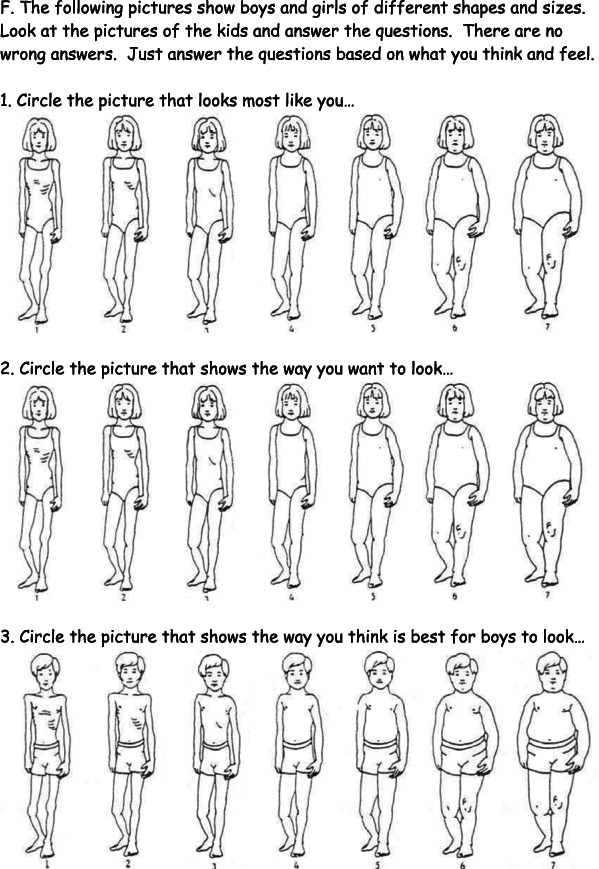
For all domains, scores represented the percentage of possible points received and higher scores reflected improved outcomes (e.g.better knowledge of nutritious foods and beverages, more self‐confidence and a more positive body image). Santos etal. (2014a) present additional details on the measures used in the Healthy Buddies™ trial in their paper.
2.3.2. Equity measures
Participants were divided into subgroups by sex, urban/rural geography and income quintile, collectively measured at study baseline. Urbanicity and income quintiles were assigned by linking each participant's de‐identified personal health information number to the comprehensive Population Health Research Data Repository at the Manitoba Centre for Health Policy, University of Manitoba. The Repository includes six‐digit postal codes, which can be grouped into dissemination areas. Dissemination areas inside Winnipeg are assigned urban status, whereas those outside Winnipeg are assigned rural status. As well, average household incomes for each dissemination area are publicly available and can be allocated to five area‐level income quintiles, each comprising 20% of the population (Manitoba Centre for Health Policy, 2008).
2.4. Data management and statistical analysis
2.4.1. Inclusion and exclusion criteria
Students were excluded from participating in Healthy Buddies™ if parental consent to participate was not received (both study groups) or if they had a condition that limited their ability to participate in physical activity (identified by the teacher; intervention group only). In total, 340 students consented to participate in the intervention and 347 consented to participate in the control arm. Of these participants, 64 were lost to follow‐up (e.g. these children were not in class when either baseline or follow‐up study measures were collected), and three had missing postal codes. Students lost to follow‐up were distributed almost equally across study groups (data not shown). No students asked to discontinue the study. Our final analysis was conducted on 157 Healthy Buddies™ and 154 usual care mentees.
2.4.2. Missing data
Select data were missing for <3% (baseline measurements) to 10%–13% (outcomes) of the children. We used the Markov Chain Monte Carlo method to perform multiple imputations (with 10 iterations) to handle missing data (Rubin, 1987). Outcomes were calculated separately for each imputed data set and then combined to produce a single estimate of the treatment effect. Sensitivity analyses were conducted on participants with complete data (n = 135 Healthy Buddies™, n = 131 standard curriculum) to verify that the results were consistent with those for the intention‐to‐treat population (results not shown).
Sample size was determined using a predefined ratio of 1:1 between intervention and control schools, assuming two classes/school with a classroom size of 25 to 30 children. A sample size of 10 clusters (schools) per group and 19 individuals per cluster provided 80% power to detect a difference of 1.38 cm in waist circumference between groups, assuming a standard deviation of 3.0 cm and an intra‐cluster correlation of 0.30. This sample provided adequate power to detect a difference of 0.008 cm between groups, assuming a standard deviation of 0.03 cm and an intracluster correlation of 0.04.
2.4.3. Statistical analysis
Descriptive analyses to test for differences in baseline characteristics used linear mixed modelling with maximum likelihood estimation to account for the nested and repeated nature of data. We compared the difference over time for each outcome by intervention arm. We included interaction terms between each subgroup (sex, urbanicity and income quintile) and the intervention arm to test whether Healthy Buddies™ was effective across all subgroups. Models incorporated random intercepts with a variance components covariance structure. Each model produced a ‘differences of mean differences’ value that compared the intervention and control arms' change in outcome within each subgroup. We used bootstrapping techniques to calculate 95% confidence intervals for effect estimates. All tests of significance were determined at the 0.05 critical value. All analyses were conducted in SAS version 9.4.
2.5. Ethics considerations
The trial protocol was approved by the Biomedical Research Ethics Board at the University of Manitoba, Canada (HREB #H2011:294).
3. RESULTS
Overall, analyses were conducted on 157 mentees who received the Healthy Buddies™ intervention and 154 mentees who received the standard curriculum. The participants' descriptive characteristics are listed in Table 1. Seventy‐five percent of participants were 8 years of age or younger, 52% were male and 50% lived in an urban area. Participants were more likely to reside in lower income neighbourhoods (30% in Q1) than higher income neighbourhoods (5% in Q5). Despite randomization, the two groups differed slightly at baseline by some socio‐demographic characteristics. A greater proportion of the children in the control arm were younger and lived in an urban area.
TABLE 1.
Descriptive characteristics of study participants
| Characteristic | Overall N = 311 | Healthy Buddies™ N = 157 | Standard curriculum N = 154 | P value | |
|---|---|---|---|---|---|
| N (%) | N (%) | N (%) | |||
| Age | ≤8 | 232 (74.6) | 95 (60.5) | 137 (89.0) | <0.000** |
| >8 | 79 (25.4) | 62 (39.5) | 17 (11.0) | ||
| Sex | Male | 161 (51.7) | 82 (52.2) | 79 (51.3) | 0.870 |
| Female | 150 (48.2) | 75 (47.8) | 75 (48.7) | ||
| Geography | Urban | 156 (50.2) | 69 (44.0) | 86 (55.8) | 0.035* |
| Rural | 155 (49.8) | 88 (56.1) | 68 (44.2) | ||
| Income quintile | Q1 (lowest) | 93 (29.9) | 46 (29.3) | 47 (30.5) | 0.814 |
| Q2 | 61 (19.6) | 29 (18.5) | 32 (20.8) | 0.608 | |
| Q3 | 33 (10.6) | 21 (13.4) | 12 (7.8) | 0.108 | |
| Q4 | 73 (23.5) | 33 (21.0) | 40 (26.0) | 0.302 | |
| Q5 (highest) | 14 (4.5) | 6 (3.8) | 8 (5.2) | 0.560 | |
P < 0.05
P < 0.001.
Baseline outcome measures are presented in Table 2. These measures were similar between groups, except that average waist circumference was statistically greater in the Healthy Buddies™ group compared with children who received the standard curriculum.
TABLE 2.
Baseline measures for study participants
| Characteristic | Healthy Buddies™ N = 157 | Standard curriculum N = 154 | P value |
|---|---|---|---|
| Mean (SEM) | Mean (SEM) | ||
| BMI z‐score | 0.66 (0.1) | 0.63 (0.1) | 0.828 |
| Waist circumference (cm) | 62.79 (0.7) | 60.47 (0.7) | 0.017* |
| Dietary intake | 57.15 (1.1) | 57.28 (1.1) | 0.936 |
| Healthy living knowledge | 76.65 (0.9) | 78.55 (1.1) | 0.190 |
| Self‐efficacy | 83.20 (1.2) | 86.31 (1.1) | 0.056 |
Note. Dietary intake, healthy living knowledge, and self‐efficacy are scored out of 100.
Abbreviation: SEM, standard error of the mean.
P < 0.05.
The results of the multivariable analyses are presented in Table 3. Changes in BMI z‐scores remained minimal and did not differ significantly overall or within any subgroup. The Healthy Buddies™ curriculum yielded a significant reduction in waist circumference among lower income children, male children and children living in rural areas. The intervention significantly improved healthy living knowledge and self‐efficacy among males and dietary intake and healthy living knowledge among children living in urban regions. Healthy Buddies™ also improved healthy living knowledge among children living in lower income neighbourhoods and dietary intake among children living in higher income neighbourhoods.
TABLE 3.
Treatment effect of the Healthy Buddies™ curriculum by subgroups
| Subgroup | Outcome | Healthy Buddies™ | Standard curriculum | Treatment effect a , b | |||
|---|---|---|---|---|---|---|---|
| Mean difference | 95% CI | Mean difference | 95% CI | Difference of mean differences | 95% CI | ||
| Overall | BMI z‐score | 0.04 | [−0.01, 0.10] | −0.01 | [−0.07, 0.04] | 0.05 | [−0.04, 0.15] |
| Waist circumference | −0.71 | [−1.39, −0.03] | 0.97 | [0.30, 1.63] | −1.68 | [−2.85, −0.51]** | |
| Dietary intake | 3.22 | [0.96, 5.48] | −1.39 | [−3.72, 0.94] | 4.61 | [0.95, 8.27]* | |
| Healthy living knowledge | 6.71 | [4.44, 8.99] | 0.82 | [−1.50, 3.13] | 5.89 | [2.30, 9.50]** | |
| Self‐efficacy | 5.93 | [3.15, 8.71] | 0.68 | [−2.16, 3.52] | 5.25 | [0.99, 9.51]* | |
| Higher income (Q3‐Q5) | BMI z‐score | 0.02 | [−0.06, 0.11] | −0.05 | [−0.14, 0.03] | 0.07 | [−0.06, 0.21] |
| Waist circumference | −1.27 | [−2.28, −0.27] | −0.38 | [−0.63, 1.39] | −1.65 | [−3.36, 0.06] | |
| Dietary intake | 4.57 | [1.04, 8.10] | −2.24 | [−5.73, 1.25] | 6.81 | [1.77, 11.83]** | |
| Healthy living knowledge | 9.25 | [5.70, 12.80] | 2.75 | [−0.81, 6.32] | 6.50 | [1.20, 11.80]* | |
| Self‐efficacy | 6.05 | [1.63, 10.47] | 1.30 | [−3.09, 5.70] | 4.75 | [−2.22, 11.71] | |
| Lower income (Q1‐Q2) | BMI z‐score | 0.05 | [−0.02, 0.12] | 0.01 | [−0.06, 0.09] | 0.04 | [−0.10, 0.18] |
| Waist circumference | −0.35 | [−1.25, 0.54] | 1.38 | [0.52, 2.23] | −1.73 | [−3.31, −0.14]* | |
| Dietary intake | 2.35 | [−0.61, 5.32] | −0.78 | [−3.84, 2.29] | 3.13 | [−1.84, 8.11] | |
| Healthy living knowledge | 5.10 | [2.20, 8.00] | −0.52 | [−3.51, 2.46] | 5.62 | [0.84, 10.40]* | |
| Self‐efficacy | 5.85 | [2.27, 9.43] | 0.25 | [−3.49, 3.99] | 5.60 | [0.24, 10.96]* | |
| Male | BMI z‐score | 0.01 | [−0.07, 0.09] | −0.01 | [−0.09, 0.08] | 0.02 | [−0.11, 0.14] |
| Waist circumference | −0.68 | [−1.68, 0.31] | 1.33 | [0.37, 2.28] | −2.01 | [−3.55, −0.48]* | |
| Dietary intake | 2.52 | [−0.06, 5.64] | −1.84 | [−4.96, 1.29] | 4.36 | [−0.48, 9.19] | |
| Healthy living knowledge | 7.14 | [3.99, 10.29] | −1.92 | [−5.13, 1.30] | 9.06 | [4.36, 13.76]*** | |
| Self‐efficacy | 7.06 | [3.23, 10.90] | −1.22 | [−5.10, 2.67] | 8.28 | [3.31, 13.25]** | |
| Female | BMI z‐score | 0.08 | [0.00, 0.15] | −0.03 | [−0.10, 0.05] | 0.11 | [−0.06, 0.26] |
| Waist circumference | −0.74 | [−1.66, 0.19] | 0.59 | [−0.24, 1.51] | −1.33 | [−3.18, 0.54] | |
| Dietary intake | 3.98 | [0.66, 7.29] | −0.89 | [−4.35, 2.56] | 4.87 | [−0.59, 10.33] | |
| Healthy living knowledge | 6.25 | [3.00, 9.50] | 3.70 | [0.32, 7.08] | 2.55 | [−2.97, 8.07] | |
| Self‐efficacy | 4.69 | [0.75, 8.62] | 2.68 | [−1.37, 6.73] | 2.01 | [−4.74, 8.75] | |
| Urban | BMI z‐score | 0.06 | [−0.02, 0.15] | 0.04 | [−0.03, 0.12] | 0.02 | [−0.12, 0.16] |
| Waist circumference | 0.16 | [−0.86, 1.18] | 1.26 | [0.40, 2.13] | −1.10 | [−2.69, 0.48] | |
| Dietary intake | 7.03 | [3.56, 10.50] | −3.43 | [−6.37, −0.49] | 10.46 | [5.48, 15.44]*** | |
| Healthy living knowledge | 7.35 | [4.00, 10.70] | −2.40 | [−5.44, 0.64] | 9.75 | [4.47, 15.03]*** | |
| Self‐efficacy | 6.23 | [2.03, 10.43] | −0.49 | [−4.23, 3.26] | 6.72 | [0.75, 12.69]* | |
| Rural | BMI z‐score | 0.02 | [−0.05, 0.10] | −0.09 | [−0.17, 0.00] | 0.11 | [−0.04, 0.26] |
| Waist circumference | −1.39 | [−2.25, −0.53] | 0.59 | [−0.40, 1.58] | −1.98 | [−3.69, −0.27]* | |
| Dietary intake | 0.20 | [−2.79, 3.18] | 1.31 | [−2.34, 4.96] | −1.11 | [−6.43, 4.20] | |
| Healthy living knowledge | 6.21 | [3.22, 9.21] | 4.89 | [1.52, 8.25] | 1.32 | [−3.55, 6.20] | |
| Self‐efficacy | 5.69 | [2.02, 9.36] | 2.16 | [−2.13, 6.45] | 3.53 | [−2.80, 9.87] | |
Abbreviations: BMI, body mass index; CI, confidence interval.
Results are adjusted for age, sex, income and geography.
The effect of the Healthy Buddies™ curriculum is calculated as the difference in mean differences between pre‐ and post‐intervention means in each subgroup. For example, in the higher income group, dietary intake increased by an average of 4.57 points in the Healthy Buddies™ arm and decreased by an average of 2.24 points in the standard curriculum arm. The difference between these two mean differences is 6.81).
P < 0.05.
P < 0.01.
P < 0.001.
4. DISCUSSION
Similar to previous experimental trials of school‐based healthy living interventions (Burke, Meyer, Kay, Allensworth, & Gazmararian, 2014; Jansen et al., 2011; Kriemler et al., 2010) and the original cluster randomized controlled trial of Healthy Buddies™ in Manitoba (Santos et al., 2014b), our study showed that Healthy Buddies™ improved obesity‐related outcomes in children, but the positive effects were largely restricted to boys and to children living in lower income neighbourhoods or urban areas. Furthermore, changes in behavioural outcomes (dietary intake, healthy living knowledge and self‐efficacy) were driven primarily by children living in urban areas. These findings suggest that the Healthy Buddies™ curriculum may need to be enhanced to ensure it is relevant for all subgroups of children.
Systematic reviews of randomized trials of school‐based obesity interventions have yielded mixed results (Harris, Kuramoto, Schulzer, & Retallack, 2009; Mei et al., 2016; Oosterhoff, Joore, & Ferreira, 2016; Sobol‐Goldberg, Rabinowitz, & Gross, 2013; Waters et al., 2011), possibly because very few trials evaluate the differential effect of the structural and social determinants of health on the effectiveness of interventions. However, childhood obesity rates can vary substantially between male and female children (Dietz, 1997) and across different socio‐economic groups (Roberts, Shields, de Groh, Aziz, & Gilbert, 2012) and geographical regions (Shields & Tjepkema, 2006). These underlying social determinants may contribute to the disparity in trial results. Policymakers have emphasized the importance of public health approaches that recognize and address the social determinants of health (Federal/Provincial and Territorial Advisory Committee on Population Health, 1994, 1999; The Honourable Wilbert Joseph Keon ‐ Chair & The Honourable Lucie Pépin ‐ Deputy Chair, 2009). Indeed, there is evidence that health promotion approaches that taking sex and gender differences into account is more likely to be successful (Keleher, 2004; Ostlin, Eckermann, Mishra, Nkowane, & Wallstam, 2006). The data presented here support this evidence: an established peer‐led intervention yielded promising results overall but had dramatically different results among subgroups of children stratified by social factors. These observations support the need for obesity prevention programmes that are appropriate and accessible for all participants, regardless of their sex, income level or area of residence.
We found that the Healthy Buddies™ curriculum reduced waist circumference and improved scores for healthy living knowledge and self‐efficacy in male children. However, the intervention had no effect on these outcomes measured in female children. There is limited literature on sex or gender differences in obesity prevention efforts among children (Flynn et al., 2006; Sweeting, 2008). Some research suggests that sex‐specific interventions may be more effective than general approaches (Fulton, McGuire, Caspersen, & Dietz, 2001; Stone, McKenzie, Welk, & Booth, 1998; Waters et al., 2011). For example, boys tend to respond better to physical activity interventions than girls (Doak, Visscher, Renders, & Seidell, 2006). It may also be important to consider whether girls are adequately represented in the curriculum materials or to develop content specifically relevant for girls for future trials. Investigating the different effects for male and female children could help explain mechanisms of behaviour change and may aid in optimizing these programmes for both boys and girls (Kremers, de Bruijn, Droomers, van Lenthe, & Brug, 2007).
Income is considered one of the primary social determinants of health, shaping overall living conditions and health‐related behaviours (Mikkonen & Raphael, 2010). Healthy Buddies™ improved waist circumference, healthy living knowledge and self‐efficacy among lower income participants and healthy living knowledge and dietary intake among higher income participants. People residing in socio‐economically disadvantaged areas may not have access to quality resources to support healthier living; the lack of change in dietary intake scores among lower‐income children may reflect limited access to healthier food choices in these families. Although it is encouraging to see significant improvements among both higher and lower income groups, low‐income populations face a range of barriers to accessing and benefitting from healthy living programmes, and evidence on tailored interventions for this group remains inconclusive (Cleland, Tully, Kee, & Cupples, 2012; Everson‐Hocket al., 2013).
Obesity rates vary substantially across different geographical regions, and in the province of Manitoba, prevalence among rural and northern‐dwelling children is much higher than among urban‐dwelling children (Shields & Tjepkema, 2006; Yu, Protudjer, Anderson, & Fieldhouse, 2010). Previous studies have identified several factors that may contribute to this trend, including limited access to recreational facilities or high quality diets in rural or remote areas (Navarro, Voetsch, Liburd, Bezold, & Rhea, 2006). We found that improved health behaviour outcomes among the urban and rural subgroups were largely driven by children living in urban areas, whereas children from rural regions saw a decrease in waist circumference. It is unclear if these factors were related to resources for physical activity and healthy eating, or class sizes, which may have been different in schools in rural settings.
Finally, the measures chosen to evaluate obesity interventions in school‐aged children are an important consideration. In our study, even though we observed decreases in waist circumference, there were no significant changes in BMI z‐scores in the overall group, nor among any of the subgroups. BMI is a commonly used measure in randomized trials of obesity interventions, despite there being little consensus on the best way to assess children's adiposity in clinical settings (Daniels, 2009). Recent literature supports the use of waist‐to‐hip ratio and waist‐to‐height ratio as alternatives to BMI in overweight and obese children (Palmieri, Henshaw, Carter, & Chowdhury, 2018). However, there is still a need for an established standard definition for waist circumference: the National Institutes of Health recommend waist measurement be done at the ileac crest, and the World Health Organization recommends midway between the ileac crest and the last palpable rib (World Health Organization, 2008). Measurements such as waist‐to‐height ratio also need to be validated in real‐life practice settings and in non‐overweight/obese children (Gordon & Siegel, 2018). In clinical practice and clinical trials, a myriad of other factors affecting obesity measures come into play, including cost, ease of measurement (especially among young children) and accuracy. Defining obesity by anthropometric means is perhaps most important in settings where the risk of poor outcomes might otherwise escape surveillance. Ultimately, having meaningful, standardized measures and definitions would be beneficial for future obesity research.
4.1. Strengths and limitations
The primary strength of this analysis is the use of a cluster‐randomized design and a modestly large, generalizable sample of children. The ability to link programme data to the population‐based data within a provincial repository to obtain information on socio‐economic status was also a key strength for this analysis. In addition, the socio‐demographic variability of the study sample allowed us to conduct these in‐depth subgroup analyses. There were also some important limitations. Despite randomization, we observed some differences between intervention and control groups at baseline, although this was accounted for in our analyses. School‐level randomization, rather than individual‐level randomization, introduced the risk of school‐specific confounding; however, intraclass correlation values for each outcome were minimal, suggesting that variance between schools accounted for only a small portion of the overall variance. For feasibility reasons, obesity was assessed using anthropometric measures, despite previously discussed limitations of these measures. Finally, the Healthy Buddies™ curriculum does not address any possible unintended consequences due to weight stigma, bullying or anxiety, nor is there currently any qualitative research on Healthy Buddies™ which could shed light on these potential effects. Bullying may well be a reason for the limited impact of Healthy Buddies on outcomes in some groups of children.
5. CONCLUSION
The Healthy Buddies™ curriculum for promoting children's healthy living was differentially effective in a diverse population. Specifically, boys and children living in urban settings and lower income neighbourhoods benefitted from the intervention. These findings highlight opportunities to examine and enhance the curriculum to more broadly improve participants' health. Given the structural conditions that predispose people to obesity and other chronic illness, individual‐level behaviour change alone may not always be sufficient for lasting health improvements (Labonté, 2011; Navarro et al., 2006). Ultimately, multi‐level interventions that broaden the societal distribution of power, income, goods and services across the population are required to fully address the differential effects of healthy living interventions in order to better manage high rates of obesity among Canadian children.
CONFLICTS OF INTEREST
The authors declare that they have no conflicts of interest.
CONTRIBUTIONS
This study was conceived and designed jointly by NCN, MB, AK, DC, MD, JMM and RS. The analyses were conducted by JS. All authors, including JEE, MC, EB and LC, as well as those previously mentioned, were involved in interpretation and discussion of the findings. The manuscript was drafted by NCN, MD and JEE, and all other authors reviewed it critically before it was finalized. MA participated in the study design and statistical analyses, interpretation of results, and review and edit of the manuscript for scientific and intellectual content. She reviewed and approved the final version of the published paper.
TRIAL REGISTRATION
ACKNOWLEDGMENTS
This study was conducted as part of the Pathways to Health and Social Equity for Children programmatic grant from the Canadian Institutes of Health Research (Grant FRN 115206) and supported by the Heart and Stroke Foundation of Canada (Grant PG‐12‐0534). We acknowledge the Manitoba Centre for Health Policy for use of data contained in the Manitoba Population Research Data Repository (HIPC # 2011/2012‐24I). We are indebted to our data providers (Manitoba Health and Manitoba Education & Training) for provision of health registry and education data. The results and conclusions of this study are those of the authors, and no official endorsement by the data providers is intended or should be inferred. Dr Marni Brownell receives the financial support of the Government of Manitoba through the MCHP Population‐Based Child Health Research Award. Dr Jon McGavock is supported by a CIHR/PHAC Applied Public Health Research Chair (2014‐2019). We also acknowledge Dr Patricia Martens, who led the PATHS Equity Team at the time of thiswork.
APPENDIX A.




Nickel NC, Doupe M, Enns JE, et al. Differential effects of a school‐based obesity prevention program: A cluster randomized trial. Matern Child Nutr. 2021;17:e13009 10.1111/mcn.13009
REFERENCES
- Baranowski, T. , Cullen, K. W. , Nicklas, T. , Thompson, D. , & Baranowski, J. (2002). School‐based obesity prevention: A blueprint for taming the epidemic. American Journal of Health Behavior, 26(6), 486–493. Retrieved from. http://www.ncbi.nlm.nih.gov/pubmed/12437023 [DOI] [PubMed] [Google Scholar]
- Bleich, S. N. , Vercammen, K. A. , Zatz, L. Y. , Frelier, J. M. , Ebbeling, C. B. , & Peeters, A. (2018). Interventions to prevent global childhood overweight and obesity: A systematic review. The Lancet. Diabetes & Endocrinology, 6(4), 332–346. 10.1016/S2213-8587(17)30358-3 [DOI] [PubMed] [Google Scholar]
- Brown, T. , & Summerbell, C. (2009). Systematic review of school‐based interventions that focus on changing dietary intake and physical activity levels to prevent childhood obesity: An update to the obesity guidance produced by the National Institute for Health and Clinical Excellence. Obesity Reviews : An Official Journal of the International Association for the Study of Obesity, 10(1), 110–141. 10.1111/j.1467-789X.2008.00515.x [DOI] [PubMed] [Google Scholar]
- Burke, R. M. , Meyer, A. , Kay, C. , Allensworth, D. , & Gazmararian, J. A. (2014). A holistic school‐based intervention for improving health‐related knowledge, body composition, and fitness in elementary school students: An evaluation of the HealthMPowers program. The International Journal of Behavioral Nutrition and Physical Activity, 11, 78 10.1186/1479-5868-11-78 [DOI] [PMC free article] [PubMed] [Google Scholar]
- Cleland, C. L. , Tully, M. A. , Kee, F. , & Cupples, M. E. (2012). The effectiveness of physical activity interventions in socio‐economically disadvantaged communities: A systematic review. Preventive Medicine, 54(6), 371–380. 10.1016/j.ypmed.2012.04.004 [DOI] [PubMed] [Google Scholar]
- Curbing Childhood Obesity: A Federal, Provincial and Territorial Framework for Action to Promote Healthy Weights . (2012). Retrieved from http://www.phac-aspc.gc.ca/hp-ps/hl-mvs/framework-cadre/pdf/ccofw-eng.pdf
- Daniels, S. (2009). The use of BMI in the clinical setting. Pediatrics, 124(Supplement 1), S35–S41. [DOI] [PubMed] [Google Scholar]
- Dietz, W. H. (1997). Periods of risk in childhood for the development of adult obesity—What do we need to learn? The Journal of Nutrition, 127(9), 1884S–1886S. 10.1093/jn/127.9.1884S [DOI] [PubMed] [Google Scholar]
- Doak, C. M. , Visscher, T. L. S. , Renders, C. M. , & Seidell, J. C. (2006). Theprevention of overweight and obesity in children and adolescents:A review of interventions and programmes. Obesity Reviews : An Official Journal of the International Association for the Study of Obesity,7(1), 111–136. 10.1111/j.1467-789X.2006.00234.x [DOI] [PubMed] [Google Scholar]
- Everson‐Hock, E. S. , Johnson, M. , Jones, R. , Woods, H. B. , Goyder, E. , Payne, N. , & Chilcott, J. (2013). Community‐based dietary and physical activity interventions in low socioeconomic groups in the UK: A mixed methods systematic review. Preventive Medicine, 56(5), 265–272. 10.1016/j.ypmed.2013.02.023 [DOI] [PubMed] [Google Scholar]
- Federal/Provincial and Territorial Advisory Committee on Population Health . (1994). Strategies for population health: Investigating the health of Canadians. Retrieved from http://publications.gc.ca/collections/collection_2016/sc-hc/H39-316-1994-eng.pdf
- Federal/Provincial and Territorial Advisory Committee on Population Health . (1999). Toward a healthy future: Second report on the health of Canadians. Retrieved from http://publications.gc.ca/site/eng/9.696295/publication.html
- Flynn, M. A. T. , McNeil, D. A. , Maloff, B. , Mutasingwa, D. , Wu, M. , Ford, C. , & Tough, S. C. (2006). Reducing obesity and related chronic disease risk in children and youth: A synthesis of evidence with “best practice” recommendations. Obesity Reviews : An Official Journal of the International Association for the Study of Obesity, 7(Suppl 1), 7–66. 10.1111/j.1467-789X.2006.00242.x [DOI] [PubMed] [Google Scholar]
- Fulton, J. E. , McGuire, M. T. , Caspersen, C. J. , & Dietz, W. H. (2001). Interventions for weight loss and weight gain prevention among youth: Current issues. Sports Medicine (Auckland, N.Z.), 31(3), 153–165. 10.2165/00007256-200131030-00002 [DOI] [PubMed] [Google Scholar]
- Gordon, K. , & Siegel, R. (2018). Identifying the best methods to assess adiposity and metabolic risk in children. Acta Paediatrica, 107(6), 921–922. 10.1111/apa.14307 [DOI] [PubMed] [Google Scholar]
- Harris, K. C. , Kuramoto, L. K. , Schulzer, M. , & Retallack, J. E. (2009). Effect of school‐based physical activity interventions on body mass index in children: A meta‐analysis. CMAJ: Canadian Medical Association Journal = Journal de l'Association Medicale Canadienne, 180(7), 719–726. 10.1503/cmaj.080966 [DOI] [PMC free article] [PubMed] [Google Scholar]
- Jansen, W. , Borsboom, G. , Meima, A. , Zwanenburg, E. J.‐V. , Mackenbach, J. P. , Raat, H. , & Brug, J. (2011). Effectiveness of a primary school‐based intervention to reduce overweight. International Journal of Pediatric Obesity: IJPO: An Official Journal of the International Association for the Study of Obesity, 6(2–2), e70–e77. 10.3109/17477166.2011.575151 [DOI] [PubMed] [Google Scholar]
- Keleher, H. (2004). Why build a health promotion evidence base about gender? Health Promotion International, 19(3), 277–279. 10.1093/heapro/dah313 [DOI] [PubMed] [Google Scholar]
- Kremers, S. P. J. , de Bruijn, G.‐J. , Droomers, M. , van Lenthe, F. , & Brug, J. (2007). Moderators of environmental intervention effects on diet and activity in youth. American Journal of Preventive Medicine, 32(2), 163–172. 10.1016/j.amepre.2006.10.006 [DOI] [PubMed] [Google Scholar]
- Kriemler, S. , Zahner, L. , Schindler, C. , Meyer, U. , Hartmann, T. , Hebestreit, H. , … Puder, J. J. (2010). Effect of school based physical activity programme (KISS) on fitness and adiposity in primary schoolchildren: Cluster randomised controlled trial. BMJ (Clinical Research Ed.), 340, c785 10.1136/bmj.c785 [DOI] [PMC free article] [PubMed] [Google Scholar]
- Krueger, P. M. , & Reither, E. N. (2015). Mind the gap: Race/ethnic and socioeconomic disparities in obesity. Current Diabetes Reports, 15(11), 95 10.1007/s11892-015-0666-6 [DOI] [PMC free article] [PubMed] [Google Scholar]
- Labonté, R. (2011). Toward a post‐Charter health promotion. Health Promotion International, 26(Suppl 2), ii183–ii186. 10.1093/heapro/dar062 [DOI] [PubMed] [Google Scholar]
- Lane, S. P. , Bluestone, C. , & Burke, C. T. (2013). Trajectories of BMI from early childhood through early adolescence: SES and psychosocial predictors. British Journal of Health Psychology, 18(1), 66–82. 10.1111/j.2044-8287.2012.02078.x [DOI] [PubMed] [Google Scholar]
- Llewellyn, A. , Simmonds, M. , Owen, C. G. , & Woolacott, N. (2016). Childhood obesity as a predictor of morbidity in adulthood: A systematic review and meta‐analysis. Obesity Reviews : An Official Journal of the International Association for the Study of Obesity, 17(1), 56–67. 10.1111/obr.12316 [DOI] [PubMed] [Google Scholar]
- Manitoba Centre for Health Policy . (2008). Construction of census income quintiles. Retrieved July 3,2019, from http://mchp-appserv.cpe.umanitoba.ca/viewConcept.php?conceptID=1056
- Mei, H. , Xiong, Y. , Xie, S. , Guo, S. , Li, Y. , Guo, B. , & Zhang, J. (2016). The impact of long‐termschool‐based physical activity interventions on body mass index of primary school children—Ameta‐analysis of randomized controlled trials. BMC Public Health, 16, 205 10.1186/s12889-016-2829-z [DOI] [PMC free article] [PubMed] [Google Scholar]
- Mikkonen, J. , & Raphael, D. (2010). Social determinants of health: The Canadian facts. Toronto: York University School of Health Policy and Management. [Google Scholar]
- National Center for Health Statistics . (2009). Clinical growth charts. Retrieved from Centers for Disease Control and Prevention website: https://www.cdc.gov/growthcharts/clinical_charts.htm
- Navarro, A. , Voetsch, K. , Liburd, L. , Bezold, C. , & Rhea, M. (2006). Recommendations for future efforts in community health promotion: Report of the National Expert Panel on community health promotion. Atlanta, GA.
- Ogden, C. L. , Carroll, M. D. , Kit, B. K. , & Flegal, K. M. (2014). Prevalence of childhood and adult obesity in the United States, 2011‐2012. JAMA, 311(8), 806–814. 10.1001/jama.2014.732 [DOI] [PMC free article] [PubMed] [Google Scholar]
- Oosterhoff, M. , Joore, M. , & Ferreira, I. (2016). The effects of school‐based lifestyle interventions on body mass index and blood pressure: A multivariate multilevel meta‐analysis of randomized controlled trials. Obesity Reviews : An Official Journal of the International Association for the Study of Obesity, 17(11), 1131–1153. 10.1111/obr.12446 [DOI] [PubMed] [Google Scholar]
- Organisation for Economic Cooperation and Development . (2014). Obesity update. Retrieved July 22,2016, from https://www.oecd.org/els/health-systems/obesity-update.htm
- Ostlin, P. , Eckermann, E. , Mishra, U. S. , Nkowane, M. , & Wallstam, E. (2006). Gender and health promotion: A multisectoral policy approach. Health Promotion International, 21(Suppl 1), 25–35. 10.1093/heapro/dal048 [DOI] [PubMed] [Google Scholar]
- Palmieri, V. , Henshaw, M. , Carter, J. , & Chowdhury, S. (2018). Assessing truncal obesity in predicting cardiometabolic risk in children: Clinical measures versus dual‐energyX‐ray absorptiometry. Acta Paediatrica, 107(6), 1065–1069. 10.1111/apa.14175 [DOI] [PMC free article] [PubMed] [Google Scholar]
- Reilly, J. J. , & Kelly, J. (2011). Long‐term impact of overweight and obesity in childhood and adolescence on morbidity and premature mortality in adulthood: Systematic review. International Journal of Obesity (2005), 35(7), 891–898. 10.1038/ijo.2010.222 [DOI] [PubMed] [Google Scholar]
- Roberts, K. C. , Shields, M. , de Groh, M. , Aziz, A. , & Gilbert, J.‐A. (2012). Overweight and obesity in children and adolescents: Results from the 2009 to 2011 Canadian Health Measures Survey. Health Reports, 23(3), 37–41. Retrieved from. http://www.ncbi.nlm.nih.gov/pubmed/23061263 [PubMed] [Google Scholar]
- Ronsley, R. , Lee, A. S. , Kuzeljevic, B. , & Panagiotopoulos, C. (2013). Healthy Buddies™ reduces body mass index z‐score and waist circumference in Aboriginal children living in remote coastal communities. The Journal of School Health, 83(9), 605–613. 10.1111/josh.12072 [DOI] [PubMed] [Google Scholar]
- Rubin, D. (1987). Multiple imputation for nonresponse in surveys. NewYork: John Wiley & Sons. [Google Scholar]
- Santos, R. , Durksen, A. , Rabbanni, R. , Chanoine, J. P. , Lamboo, M. , Mayer, T. , & McGavock, J. (2014a). Effectiveness of peer‐based healthy living lesson plans on anthropometric measures and physical activity in elementary school students: A cluster randomized trial. JAMA Pediatrics, 168(2168‐6211(Electronic)), 330–337. [DOI] [PubMed] [Google Scholar]
- Santos, R. , Durksen, A. , Rabbanni, R. , Chanoine, J.‐P. , Lamboo Miln, A. , Mayer, T. , & McGavock, J. M. (2014b). Effectiveness of peer‐based healthy living lesson plans on anthropometric measures and physical activity in elementary school students: A cluster randomized trial. JAMA Pediatrics, 168(4), 330–337. 10.1001/jamapediatrics.2013.3688 [DOI] [PubMed] [Google Scholar]
- Sassi, F. (2010). Obesity and the economics of prevention. 10.1787/9789264084865-en [DOI]
- Senate Committee on Social Affairs, S.and T . (2016). Obesity in Canada, a whole‐of‐society approach for a healthier Canada. Retrieved from https://sencanada.ca/content/sen/committee/421/SOCI/Reports/2016-02-25_Revised_report_Obesity_in_Canada_e.pdf
- Shields, M. , & Tjepkema, M. (2006). Regional differences in obesity. Health Reports, 17(3), 61–67 Retrieved from. http://www.ncbi.nlm.nih.gov/pubmed/16981487 [PubMed] [Google Scholar]
- Sobol‐Goldberg, S. , Rabinowitz, J. , & Gross, R. (2013). School‐based obesity prevention programs: A meta‐analysis of randomized controlled trials. Obesity (Silver Spring, Md.), 21(12), 2422–2428. 10.1002/oby.20515 [DOI] [PubMed] [Google Scholar]
- Stock, S. , Miranda, C. , Evans, S. , Plessis, S. , Ridley, J. , Yeh, S. , & Chanoine, J.‐P. (2007). Healthy Buddies: A novel, peer‐led health promotion program for the prevention of obesity and eating disorders in children in elementary school. Pediatrics, 120(4), e1059–e1068. 10.1542/peds.2006-3003 [DOI] [PubMed] [Google Scholar]
- Stone, E. J. , McKenzie, T. L. , Welk, G. J. , & Booth, M. L. (1998). Effects of physical activity interventions in youth. Review and synthesis. American Journal of Preventive Medicine, 15(4), 298–315. Retrieved from. http://www.ncbi.nlm.nih.gov/pubmed/9838974 [DOI] [PubMed] [Google Scholar]
- Sweeting, H. N. (2008). Gendered dimensions of obesity in childhood and adolescence. Nutrition Journal, 7, 1 10.1186/1475-2891-7-1 [DOI] [PMC free article] [PubMed] [Google Scholar]
- The Honourable Wilbert Joseph Keon ‐ Chair, & The Honourable Lucie Pépin ‐ Deputy Chair . (2009). A healthy, productive Canada: A determinant of health approach. Ottawa.
- The National Survey of Children's Health . (2011). The health and well‐being of children in rural areas: A portrait of the nation 2007. Rockville, MD.
- Tu, A. W. , Mâsse, L. C. , Lear, S. A. , Gotay, C. C. , & Richardson, C. G. (2015). Body mass index trajectories from ages 1to 20: Results from two nationally representative canadian longitudinal cohorts. Obesity (SilverSpring, Md.), 23(8), 1703–1711. 10.1002/oby.21158 [DOI] [PubMed] [Google Scholar]
- van Stralen, M. M. , Yildirim, M. , te Velde, S. J. , Brug, J. , van Mechelen, W. , Chinapaw, M. J. M. , & ENERGY‐consortium . (2011). What works in school‐based energy balance behaviour interventions and what does not? A systematic review of mediating mechanisms. International Journal of Obesity (2005), 35(10), 1251–1265. 10.1038/ijo.2011.68 [DOI] [PMC free article] [PubMed] [Google Scholar]
- Verrotti, A. , Penta, L. , Zenzeri, L. , Agostinelli, S. , & De Feo, P. (2014). Childhood obesity: prevention and strategies of intervention. A systematic review of school‐based interventions in primary schools. Journal of Endocrinological Investigation, 37(12), 1155–1164. 10.1007/s40618-014-0153-y [DOI] [PubMed] [Google Scholar]
- Waters, E. , de Silva‐Sanigorski, A. , Hall, B. J. , Brown, T. , Campbell, K. J. , Gao, Y. , … Summerbell, C. D. (2011). Interventions for preventing obesity in children. The Cochrane Database of Systematic Reviews, 12, CD001871 10.1002/14651858.CD001871.pub3 [DOI] [PubMed] [Google Scholar]
- World Health Organization . (2000). Obesity: Preventing and managing the global epidemic: Report of a WHO consultation. In WHO Technical Report Series(Vol. 894). Retrieved from https://www.who.int/nutrition/publications/obesity/WHO_TRS_894/en/ [PubMed] [Google Scholar]
- World Health Organization . (2008). Waist circumference and waist‐hip ratio: Report of a WHO expert consultation. Geneva, Switzerland.
- Yu, B. N. , Protudjer, J. L. P. , Anderson, K. , & Fieldhouse, P. (2010). Weight status and determinants of health in Manitoba children and youth. Canadian Journal of Dietetic Practice and Research: A Publication of Dietitians of Canada = Revue Canadienne de La Pratique et de La Recherche en Dietetique: Une Publication des Dietetistes Du Canada, 71(3), 115–121. 10.3148/71.3.2010.115 [DOI] [PubMed] [Google Scholar]


