Abstract
Silicon carbide nanoparticles (SiCNPs) are durable, physically resilient, chemically inert, and biocompatible. Silicon carbide particles smaller than 10 nm show photoluminescence due to quantum confinement effects and have been reported in imaging different cell lines. To further explore the potential of silicon carbide nanomaterials in cell imaging, we studied the photoluminescence and photoacoustic properties of three SiCNPs of approximately 30, 80, and 620 nm. All these SiCNPs show photoluminescence and photoacoustic signals, and the 620 nm silicon carbide nanoparticles (SiCNP620) show the highest photoluminescence and photoacoustic intensity. SiCNP620 is biocompatible with a good cell labeling capacity. It could image mesenchymal stem cells in vitro for more than 20 days via photoluminescence even when the cells were differentiated into adipocytes and osteocytes. The same SiCNP620 could also produce photoacoustic signals and track stem cells in vivo for over 14 days.
Silicon carbide nanoparticles are capable of long-term tracking of mesenchymal stem cells through both photoluminescence and photoacoustic imaging.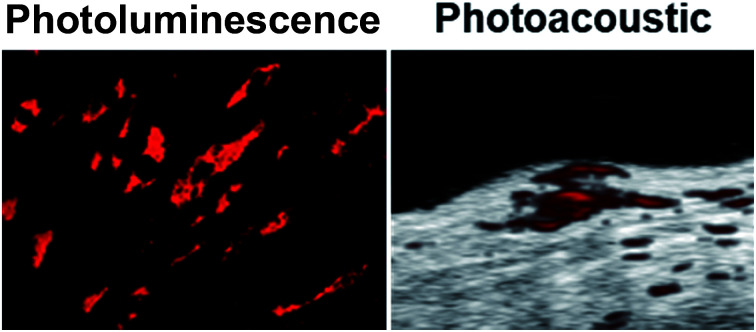
Introduction
Silicon carbide (SiC) materials are used as dental implants, bone prosthetics, coronary heart stents, and brain–machine interface devices.1 Bulk silicon carbide materials are biocompatible, durable, resilient, and inert. Thus, they are often used as coatings for biomedical devices to prevent the leakage of ions and/or reduce biofouling.2 The emergence of silicon carbide nanomaterials two decades ago has resulted in several novel biomedical applications like cell imaging.3
Silicon carbide quantum dots have been used as photoluminescent probes for cell imaging. For silicon carbide, the word photoluminescence more accurately describes the luminescence properties than fluorescence due to the delayed emission time.4 Silicon carbide quantum dots have strong photoluminescence due to their highly improved radiative recombination rates in such small clusters—only few nanometers. Botsoa et al. reported using silicon carbide quantum dots with a cubic symmetry crystalline structure (β-SiC) to image living 3T3-L1 fibroblast cells via fluorescence microscopy.5 Fan et al. synthesized β-SiC quantum dots via electrochemical etching and used these quantum dots to label human fetal osteoblast cells.6 Zakharko et al. demonstrated that silicon carbide quantum dots could label fibroblast cells and the photoluminescence of these quantum dot-labeled cells could be greatly enhanced via localized plasmons.7 Beke et al. showed that silicon carbide quantum dots synthesized by chemical etching could image live neuron cells via two-photon microscopy.8
In addition, sub-micron silicon carbide nanoparticles (SiCNPs) could also enter and visualize cells via nonlinear photoluminescence signals.9,10 For example, Rogov et al. labeled 3T3-L1 fibroblast cells with 3C-SiC nanoparticles larger than 100 nm and then imaged the labeled cells with nonlinear microscopy.9 Boksebeld et al. used folate-modified 3C-SiC nanoparticles with a diameter of 150 nm to label cancer cells via multi-photon microscopy.10 The non-centrosymmetric crystalline structure and relatively large diameter (associated with a large two-photon absorption cross-section) of SiC nanoparticles provided an intense emission peak. Previously, we demonstrated the ability of silicon carbide nanoparticles of approximately 80 nm and 600 nm to track human mesenchymal stem cells (hMSCs) via photoluminescence.11
While many studies have shown the utility of silicon carbide nanoparticles for in vitro cell imaging, there is little evidence that these nanoparticles can be used for in vivo cell tracking—perhaps because photoluminescence has poor tissue penetration depth.12 This poor penetration of photons limits the use of silicon carbide nanomaterials in cell therapy applications that require in vivo tracking of transplanted cells. Photoacoustic imaging is an emerging technique combining the contrast and spectral tuning of optical imaging and the high temporal and spatial resolution of acoustic imaging.13,14 The improved penetration depth of photoacoustic imaging over optical and fluorescence imaging gives it an advantage for in vivo systems.15 Here, we show for the first time that silicon carbide nanoparticles generate photoacoustic signals and can track cells in vivo.
In this work, we used silicon carbide nanoparticles to track mesenchymal stem cells. Mesenchymal stem cells are a promising regenerative medicine but their retention is poor.16 Long-term tracking of the injected cells is important—including the cell location, cell numbers, and cell fate.17 Silicon carbide nanoparticles have great potential in tracking mesenchymal stem cells due to their biocompatibility.11 Here, we compared the photoluminescence and photoacoustic intensities of silicon carbide nanoparticles with three sizes. Then, we used the one with the strongest photoluminescence and photoacoustic intensities to label and track stem cells. This nanoparticle can image mesenchymal stem cells in vitro via fluorescence microscopy and, moreover, track stem cells in vivo via photoacoustic imaging. Both the photoluminescence and photoacoustic signals of this nanoparticle in mesenchymal stem cells are stable for over 10 days. The photoluminescence of this silicon carbide nanoparticle in mesenchymal stem cells was seen even when the cells differentiated to adipocytes and osteocytes.
Materials and methods
Nanoparticle characterization
Silicon carbide nanoparticles of different sizes were purchased from US Research Nanomaterials Inc. (US2161, US2022, and US2011) and were calcined at 600 °C for 2 hours before use as described previously.11
Particle sizes were analyzed with TEM images that were taken on a JEOL1400-Plus with a Gatan Orius 600 camera. High resolution TEM (HRTEM) images were obtained via an FEI Tecnai F20 operated at 200 kV, and element mapping was performed on this electron microscope in STEM mode. STEM images and EDX spectra were taken on an HD-2000 STEM (Hitachi) and a Quantax EDS (Bruker) at an accelerating voltage of 200 kV. X-ray diffraction (XRD) patterns were scanned on a Rigaku Miniflex XRD unit operating at 40 kV and 40 mA using Cu Kα radiation (λ = 1.5418 Å) with a 2θ step size of 0.02° within 20–80°. The zeta potential was measured via a Malvern Zetasizer ZS90.
The absorbance spectra of SiCNPs (20 μg mL−1) were obtained with a UV-vis microplate reader (SpectraMax M5, Molecular Devices). The photoluminescence spectra of SiCNPs suspended in water (20 μg mL−1) were recorded with the same UV-vis microplate reader under time-resolved fluorescence mode. To maximize the signal intensity, the integration time was set to 1.5 ms and 100 flashes were recorded per read. Photoluminescence spectra were also recorded via a customized fiber-coupled spectrometer (Princeton Instruments). A layer of SiC nanoparticles was placed on glass slide, dried, and then excited with 325 nm or 442 nm UV light (∼10 mW) at an angle of ∼45° relative to the sample plane. The emission spectra were collected through a 20× objective and recorded using a fiber-coupled spectrometer. A 450 nm long pass filter was applied in front of the spectrometer when the particles were excited with 442 nm light using the same optical setup laser.
Photoacoustic scans were obtained using a Vevo LAZR from Visualsonics.12 SiCNP samples were resuspended in water at a concentration of 1 mg mL−1. The samples were then loaded into polythene tubing and scanned with an array photoacoustic transducer (LZ250, Visualsonics, Inc.) operating at 25 MHz center frequency. The photoacoustic spectra between 680 nm and 970 nm were scanned with a step size of 5 nm. To determine the limit of detection by photoacoustic imaging, SiCNPs were resuspended in water at different concentrations (100, 50, 25, 10, 5, and 0 μg mL−1) and scanned with a wavelength of 725 nm. The limit of detection was defined as the concentration that had a signal intensity at 3 standards deviations above the mean.
Cell culture
Human mesenchymal stem cells (hMSCs, cat #: PT-2501) and cell culture media (cat #: PT-3001) were purchased from Lonza. Human MSCs from passage 2–10 were used. Mouse mesenchymal stem cells (mMSCs, cat #: MUBMX-01001) were purchased from Cyagen. Mouse MSCs were used between passages 8–12 and were cultured with Dulbecco's modified Eagle medium (DMEM) from Gibco supplemented with 10% fetal bovine serum (Sigma) and 1% antibiotic–antimycotic (Thermo Fisher Scientific). Cell media were replaced every 2–3 days. Cells were grown to 80–90% confluency. For passage and usage, the cells were detached with 0.25% trypsin–EDTA (Gibco), then centrifuged at 1000 rpm for 5 minutes, resuspended, and counted using a hemocytometer.
For labeling condition studies, hMSCs were plated in a 6-well plate and grown until fully confluent. Then, 2 mL of SiCNP suspensions in cell media at concentrations of 0, 50, 100, and 200 μg mL−1 were added to each well separately. After a specific incubation time (1, 4, or 8 hours), the cells were washed with PBS thrice to remove free nanoparticles and then collected. The cell labeling capacity was then quantified by thermogravimetric analysis (TGA) and photoacoustic imaging independently. TGA experiments were performed with approximately 400 000 cells resuspended in 20 μL of Millipore water using a PerkinElmer STA 6000 simultaneous thermal analyzer. The labeled cells were heated from 25 to 600 °C at a heating speed of 10 °C min−1 and then held at 600 °C for 2 hours. SiCNPs were also analyzed by TGA as a positive control. For photoacoustic imaging, the labeled cells were dispersed in a 1 : 1 warm mixture of PBS : agarose (1%), added to polyethene tubes, cooled, and then scanned.
The cytotoxicity of SiCNP620 to mesenchymal stem cells was studied by plating cells in a 96-well plate at a density of 5000 cells per well. The cells were incubated with SiCNP620 suspensions at different particle concentrations—400, 200, 100, 50, 25, and 0 μg mL−1. Positive controls included 400 μg mL−1 SiCNP600 and media only. Eight replicates were tested. After 48 hours, a 3-(4,5-dimethylthiazol-2-yl)-5-(3-carboxymethoxyphenyl)-2-(4-sulfophenyl)-2H-tetrazolium (MTS) (Promega) assay was performed by adding 100 μL of a 1 : 10 v/v MTS : media solution to each well. The cells with the MTS reagent were incubated for four hours. Next, to avoid any interferences of nanoparticles on the absorbance, 70 μL of the supernatant from each well were transferred to a new plate, and the absorbance was read at a wavelength of 490 nm.
The effect of SiCNP620 on the proliferation of mesenchymal stem cells was also studied. The cells were plated in a 96-well plate at a density of 3000 cells per well and then incubated with SiCNP620 suspensions at different particle concentrations—400, 200, 100, 50, 25, and 0 μg mL−1—for different durations—1, 2, 3, and 4 days. Positive controls included 200 μg mL−1 SiCNP600 and media only. Eight replicates were tested for each concentration and duration. At each time point, a resazurin (Sigma-Aldrich) assay was performed by adding 100 μL of a 1 : 10 v/v resazurin : media solution to each well, followed by incubation for 4 hours. We then transferred 70 μL of the supernatant from each well to clean wells and read the fluorescence at an excitation of 550 nm and an emission of 585 nm.
In vitro photoluminescence imaging of cells
Photoluminescence imaging was conducted via an EVOS fluorescence microscope with a Texas red channel, which corresponds most closely to the emission wavelength of SiC. SiCNP620-labeled (50 μg mL−1 of SiCNP620, incubated for 4 hours) and unlabeled cells were plated separately in a 6-well plate. The cell morphology was then observed with photoluminescence imaging on different days for three weeks. The cells plated in other wells were treated with adipogenic or osteogenic induction media for three weeks. The morphology changes were recorded with bright field and photoluminescence imaging.
In vivo cell tracking by photoacoustic imaging
All animal studies were carried out in accordance with the regulations set by the Institutional Animal Care and Use Committee (IACUC) of the University of California, San Diego. Unlabeled mMSCs and SiCNP620-labeled mMSCs were detached, counted, resuspended in PBS, and kept in ice. Subcutaneous injections were performed by mixing the cell solution and cold Matrigel (Corning) at a 1 : 1 v/v ratio. Then, 100 μL of the mixture was injected subcutaneously into a mouse and immediately scanned with a photoacoustic transducer (LZ250, Visualsonics, Inc.) operating at 25 MHz center frequency. The photoacoustic scans were also performed 3, 7, and 14 days after the injections.
Results and discussion
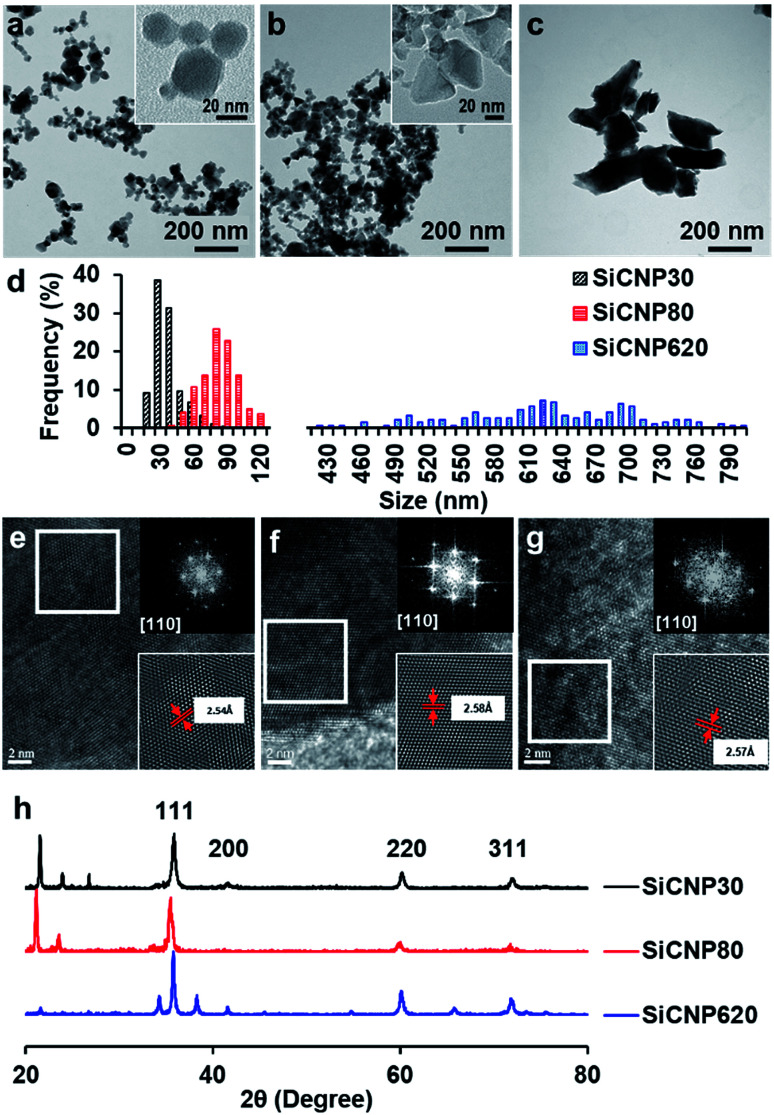
Silicon carbide nanoparticles with three different sizes were synthesized via chemical vapor deposition method by US Research Nanomaterials, Inc. (US2011, US2022, and US2161). The average size of these nanoparticles was 33 ± 12 nm, 78 ± 16 nm, and 624 ± 94 nm based on their TEM images (Fig. 1a–d), which were subsequently labeled SiCNP30, SiCNP80, and SiCNP620. Additionally, SiCNP30 and SiCNP80 are more circular than SiCNP620: the circularity of SiCNP30, SiCNP80, and SiCNP620 was 0.90 ± 0.03, 0.89 ± 0.13, and 0.61 ± 0.09. All three SiCNPs were negatively charged in water, where the pH lies above the isoelectric point of 3C-SiC.18 The zeta potentials of the nanoparticles were −19.0, −25.3, and −30.7 mV for SiCNP30, SiCNP80, and SiCNP620, respectively. According to Chung et al., the differences in the zeta potential of these SiCNPs would have insignificant effects on cellular uptake.19
Fig. 1. TEM images of SiCNPs with average sizes of (a) 30 nm, (b) 80 nm, and (c) 620 nm. The circularity of SiCNP30, SiCNP80, and SiCNP620 was 0.90 ± 0.03, 0.89 ± 0.13, and 0.61 ± 0.09. (d) TEM size distributions of SiCNPs. High resolution TEM images and fast Fourier transformation patterns of (e) SiCNP30, (f) SiCNP80, and (g) SiCNP620 show a typical diffraction pattern of a cubic crystal structure along the [110] zone axis. The measured lattice spacing of the (111) plane for the three types of silicon carbide particles is 2.54 Å, 2.58 Å and 2.57 Å, respectively. (h) X-ray diffraction spectra of all SiCNPs show peaks at around 2θ of 35.77°, 41.54°, 60.2°, and 72.04°, which correspond to the SiC(111), SiC(200), SiC(220), and SiC(311) peaks of cubic 3C-SiC (powder diffraction file card 96-901-8857).
We characterized the crystal structure of these nanoparticles in more detail to confirm that these particles have a similar crystalline structure. The fast Fourier transform patterns in the high resolution TEM images are typical diffraction patterns for a cubic crystal structure along the [110] zone axis. The measured lattice spacing of the (111) plane for the three nanoparticles is 2.54 Å, 2.58 Å and 2.57 Å, respectively (Fig. 1e–g). These measured spacings are close to the standard values of powder diffraction file card 96-900-8857. X-ray diffraction spectra of all SiCNPs show peaks at around 2θ 35.77°, 41.54°, 60.2°, 72.04°, and 75.79°, which correspond to the SiC(111), SiC(200), SiC(220), SiC(311), and SiC(222) peaks of cubic 3C-SiC (PDF 96-901-8857) (Fig. 1h). 3C-SiC, or β-SiC polytype, is the most thermodynamically stable polytype and has the lowest thermal conductivity.20 The other peaks match with SiO2 peaks (powder diffraction file card 96-412-4080, 96-900-0779, and 96-901-4487) and are likely due to the glass sample holder.
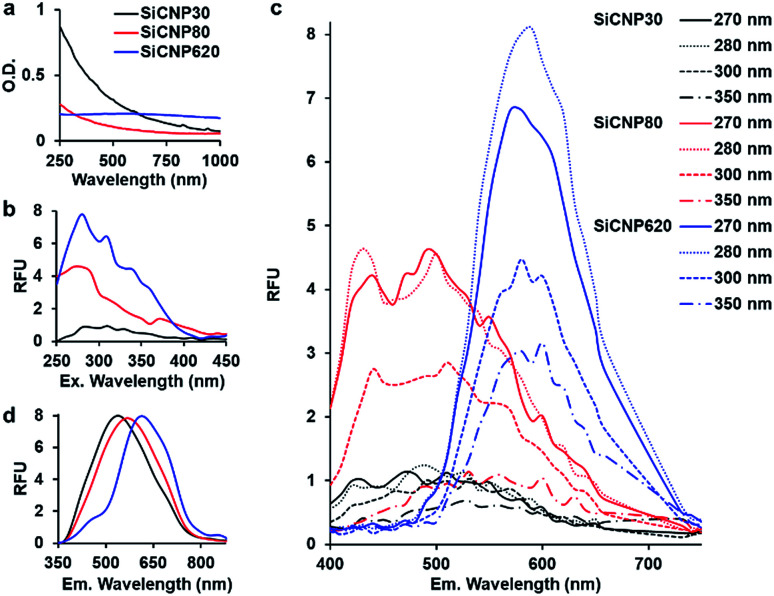
After confirming the crystal structure of these particles, we investigated the effect of size on light absorption and photoluminescence. SiCNPs (20 μg mL−1) showed size-dependent light absorption (Fig. 2a). The absorbance spectra of SiCNP30 and SiCNP80 showed that their absorbance decreased with increasing wavelength, which is similar to the absorbance of 3C-SiC nanocrystals smaller than 10 nm. The sharper decrease in the absorbance of SiCNP30 than SiCNP80 may indicate more quantum confinement events in the smaller SiCNPs.6 Remarkably, SiCNP620 has a very broad absorbance peak at 560 nm (2.2 eV) corresponding to the bandgap of bulk 3C-SiC. The increased absorbance intensity of SiCNP30 and SiCNP80 in the short wavelength range may be due to the high contribution of Rayleigh scattering for smaller particles. The scattering effect decreases with increasing wavelength, explaining the gradual decline in the absorbance intensity.
Fig. 2. Optical properties of all SiCNPs. (a) Absorbance spectra of SiCNP suspensions. (b) Excitation spectra (emission 540 nm) and (c) emission spectra at varying excitation wavelengths of SiCNP suspensions. (d) Emission spectra of dry SiCNPs using a laser excitation source of 325 nm. The intensities were normalized. Black, red, and blue represent SiCNP30, SiCNP80, and SiCNP620, respectively.
The photoluminescence of all SiCNPs was examined at varying excitation and emission conditions. The excitation spectra of 2 mg mL−1 SiCNPs in water were studied at 540 nm emission with a UV-vis microplate reader (SpectraMax M5, Molecular Devices). The excitation peaks of SiCNP30, SiCNP80, and SiCNP620 were at around 280 nm, and the intensity increased with increasing particle size (Fig. 2b). The emission spectra of these SiCNP suspensions were scanned with excitations of 270, 280, 300, and 350 nm (Fig. 2c). SiCNP620 showed the highest photoluminescence intensity among all SiCNPs. The photoluminescence of SiCNP620 was approximately 2-fold that of SiCNP80 and 8-fold that of SiCNP30 when the excitation wavelength was 280 nm. The emission spectra of dry SiCNPs were also studied with a 10 mW laser (325 nm). The emission peaks of SiCNP30, SiCNP80, and SiCNP620 were at 538 nm (2.3 eV), 568 nm (2.2 nm), and 614 nm (2.0 eV), respectively (Fig. 2d), indicating a red shift of photoluminescence as the particle size increases. The red shift in larger particles is due to the size of the quantum-confined region.21 Quantum confinement effects within large dimensions decrease the bandgap energy, and thus increase the emission wavelength.22
Generally, the quantum yield of SiC nanoparticles is lower than that of organic dye fluorophores,23,24 even though it can be improved by decreasing the SiC particle size or introducing porous structures.24,25 Fan et al. reported the quantum yield of silicon carbide nanocrystals smaller than 4 nm to be 17%;6 fluorescein derivatives can reach a 100% quantum yield.23 However, the fluorescence of organic dye fluorophores is unstable, and photobleaching is common.23 In contrast, SiC nanoparticles have stable photoluminescence.6
The photoluminescence mechanisms of silicon carbide nanoparticles are complicated and remain controversial.25 The photoluminescence of silicon carbide nanoparticles can be linear or non-linear. Linear photoluminescence may be produced by the quantum confinement effect in the small features21 or the amorphous fractions of silicon carbide nanoparticles and the Si–O bonds on the surfaces. This might be one reason for the stronger photoluminescence of SiCNP620 than SiCNP30 and SiCNP80, because SiCNP620 showed the lowest circularity—0.6 compared to 0.9 of SiCNP 30 and SiCNP80. Second, non-linear photoluminescence can be second-harmonic generation or two-photon excitation fluorescence (photoluminescence is used in this paper because it more accurately describes the luminescent properties than fluorescence due to the delayed emission time).4,9,10
A larger diameter is favored for non-linear photoluminescence because the two-photon absorption cross-section is larger.10 This might be another reason for the strongest photoluminescence of SiCNP620 among the three nanoparticles.
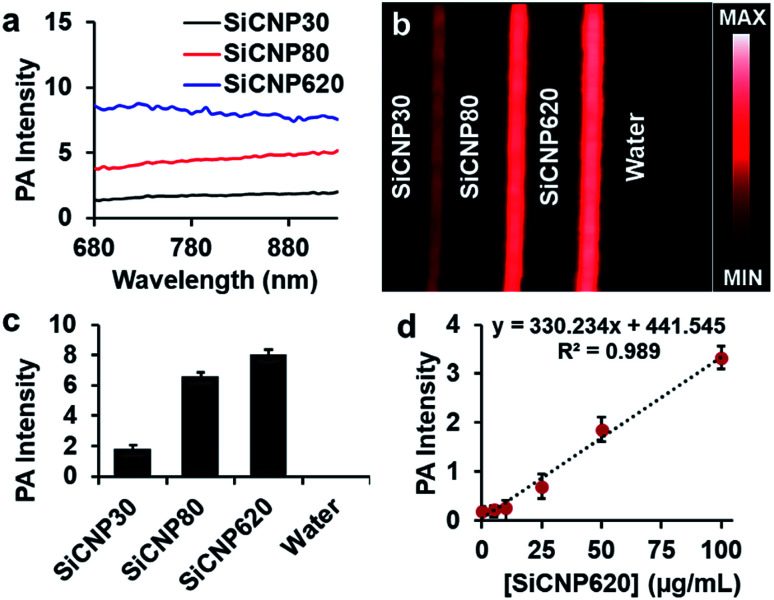
Next, we compared the photoacoustic properties of these silicon carbide nanoparticles. The photoacoustic spectra show that all particles had a broad wavelength signal at a concentration of 1 mg mL−1 in water (Fig. 3a). The nanoparticles were then scanned at a fixed wavelength of 725 nm, and SiCNP620 had the highest photoacoustic intensity (Fig. 3b). The photoacoustic intensity of SiCNP30 and SiCNP80 was 23% and 82% of that of SiCNP620, respectively (Fig. 3c). Hence, we conclude that the photoacoustic intensity increased with increasing particle size. This is expected because the absorbance of near-infrared light by SiCNP620 was higher than that of both SiCNP30 and SiCNP80 (Fig. 2a) and the particles with a larger cross-section, provided that the material and light fluence are the same, will have a greater photoacoustic signal.26,27
Fig. 3. Photoacoustic properties of SiCNPs. (a) Photoacoustic spectra, (b) photoacoustic image and (c) the corresponding quantification of the photoacoustic intensity at 725 nm. (d) Photoacoustic signal of SiCNP620 was linearly dependent on the particle concentration. The limit of detection of SiCNP620 was found to be 10 μg mL−1. Error bars are standard deviations of 5 regions of interest.
Interestingly, the largest nanoparticle had both the strongest photoluminescence and photoacoustic intensity. Photoluminescence and photoacoustic intensity are typically inversely related due to competing radiative and non-radiative decay pathways when the light absorbance is constant.28 However, we see here that both photoluminescence and photoacoustic signal increase with increasing size, which was very likely due to the increased light absorption by larger particles (Fig. 2a).
We also studied the relationship between the nanoparticle concentration and photoacoustic signal with SiCNP620 because SiCNP620 showed the highest photoacoustic signals. The photoacoustic intensity of SiCNP620 was linearly dependent on the particle concentration (Fig. 3d). The limit of detection of SiCNP620 was measured to be 10 μg mL−1.
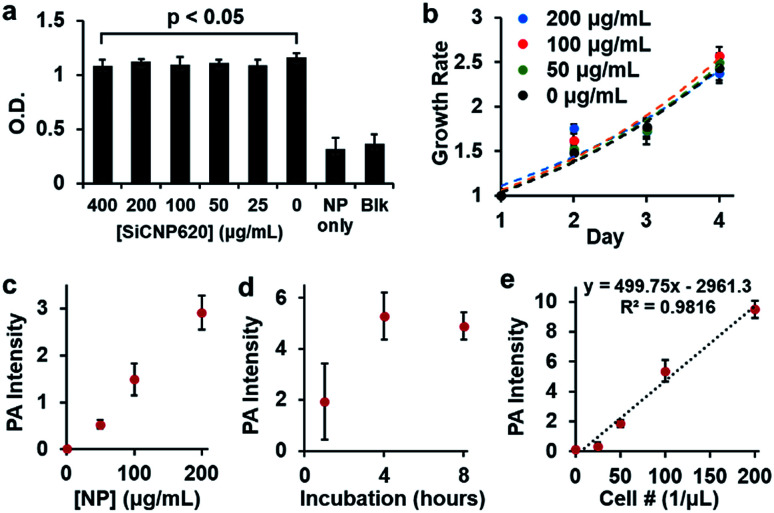
Given the strongest photoluminescence and photoacoustic signals of SiCNP620 among the three SiCNPs, we used SiCNP620 for stem cell imaging and tracking. We first studied the cytotoxicity of SiCNP620 to mouse mesenchymal stem cells at different concentrations via a 3-(4,5-dimethylthiazol-2-yl)-5-(3-carboxymethoxyphenyl)-2-(4-sulfophenyl)-2H-tetrazolium, or MTS, assay (Promega). No significant decrease in cell viability was found over 48 hours when the SiCNP620 concentration was below 400 μg mL−1 (Fig. 4a). Moreover, the SiCNP620-labeled cells showed a similar growth rate to unlabeled cells at labeling concentrations of 50–200 μg mL−1 (Fig. 4b).
Fig. 4. Biocompatibility and labeling conditions of SiCNP620 in MSCs. (a) No significant decrease in cell viability was seen for labeling concentrations smaller than 400 μg mL−1. (b) Cells labeled with SiCNP620 at different concentrations showed similar growth rates to unlabeled cells. Error bars are standard deviations of 8 replicates. (c) A linear relationship is seen between the labeling concentration and photoacoustic signal for four hours of labeling. (d) For a labeling concentration of 50 μg mL−1, a labeling time of four hours was optimal. (e) Photoacoustic intensity was linearly dependent on the concentration of SiCNP620-labeled cells (50 μg mL−1, 4 hours of incubation), and the limit of detection was 37 cells per μL. Error bars are standard deviations of 5 measurements.
Then, we studied the labeling ability of SiCNP620 to mouse mesenchymal stem cells. The overall labeling capacity, which is the average number of nanoparticles entering a cell, was evaluated with photoacoustic imaging. The labeling concentration and incubation time affected the labeling capacity. The photoacoustic signal increases with increasing labeling concentration (Fig. 4c), and a labeling time of 4 hours was found to be optimal (Fig. 4d). The cell labeling capacity was also quantified with thermogravimetric analysis. At labeling concentrations of 50 μg mL−1 and 200 μg mL−1, the cell labeling capacity was 1.87 and 6.88 ng SiCNP per cell, occupying 0.25% and 0.93% of the cell volume, which was higher than that reported for silica nanoparticles.29 For all future experiments, stem cells were labeled with a particle concentration of 50 μg mL−1 unless otherwise specified. There was a linear relationship between the photoacoustic intensity and the number of SiCNP620-labeled cells (50 μg mL−1) (Fig. 4e), and the limit of detection of these labeled cells was approximately 37 cells per μL.
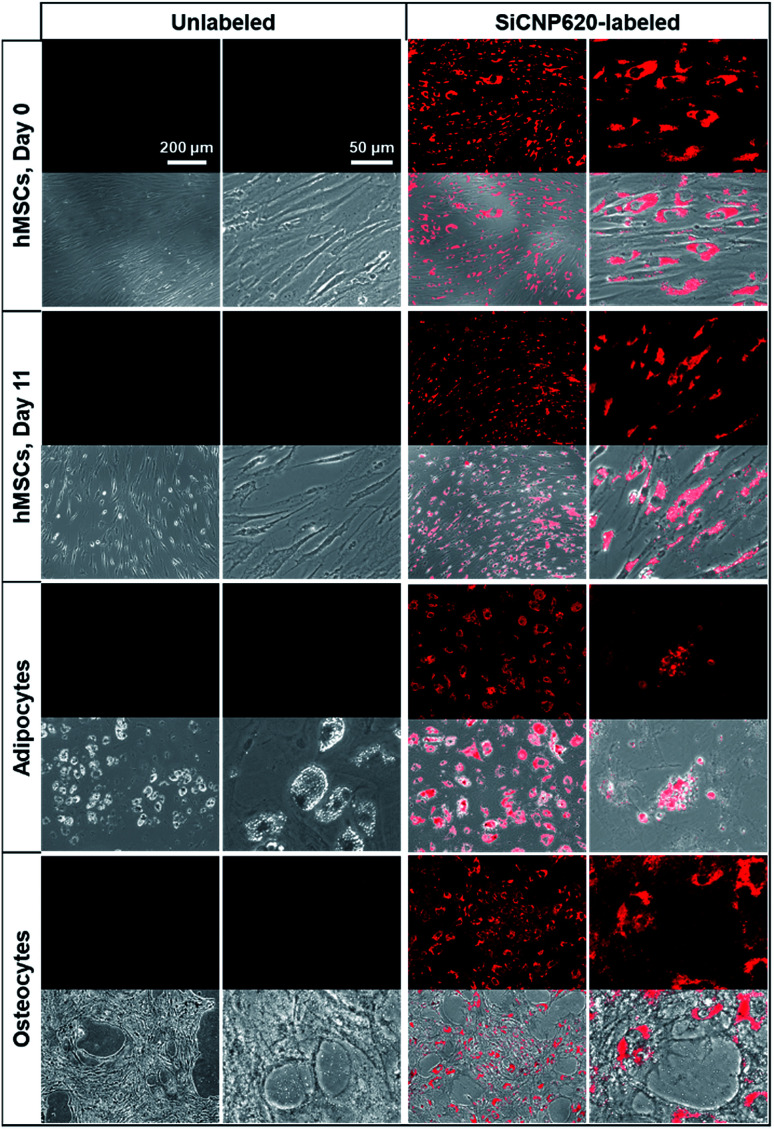
The SiCNP620-labeled mesenchymal stem cells were visible under a fluorescence microscope using a Texas red filter cube (the excitation is 585 nm and the emission is 624 nm). Unlabeled cells showed no photoluminescence signal (Fig. 5). The photoluminescence of SiCNP620 was stable and the labeled stem cells showed strong photoluminescence signals even 11 days after labeling, suggesting the ability of SiCNP620 for long-term imaging and tracking of stem cells. Unlabeled and SiCNP620-labeled mesenchymal stem cells were treated with adipogenic and osteogenic induction media. SiCNP620 labeling did not affect stem cell differentiation. Moreover, SiCNP620 could track mesenchymal stem cell-derived adipocytes and osteocytes (Fig. 5). Interestingly, for the adipogenic induced cells, SiCNP620 could enter and therefore track the lipid vesicles as well.
Fig. 5. Fluorescence image (top) and its overlay with a bright field image (bottom) of unlabeled and SiCNP620-labeled cells. SiCNP620-labeled mesenchymal stem cells are still visible under a fluorescence microscope 11 days after labeling, indicating the long-term cell imaging ability of SiCNP620. In addition, adipocytes and osteocytes differentiated from SiCNP620-labeled mesenchymal stem cells still show photoluminescence three weeks after labeling.
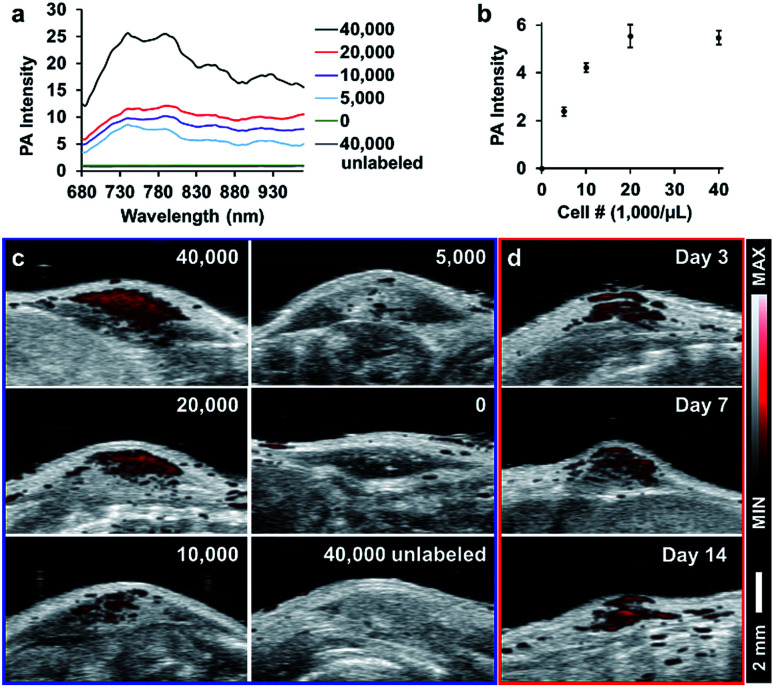
To demonstrate the potential of these particles for in vivo cell tracking, we subcutaneously injected SiCNP620-labeled mouse mesenchymal stem cells into a nude mouse and scanned the cells with photoacoustic imaging. Fig. 6a shows the photoacoustic spectra of injected cells. The photoacoustic intensity from 680 to 730 nm decreased compared to the photoacoustic spectra of SiCNP620 only (Fig. 3a), which may be due to the reduced tissue penetration of shorter wavelengths compared to longer wavelengths. As a result, all cell implants were scanned in 3-dimensions at 770 nm. The photoacoustic intensity increased as the labeled cell concentration increased and then saturated when the cell concentration reached 20 000 cells per μL (Fig. 6b and c). The in vivo limit of detection of SiCNP620-labeled cells was 7800 cells per μL. Unlabeled cells showed no photoacoustic signal even at a high cell concentration. Continuous monitoring of the cell implants showed that we could still track SiCNP620-labeled cells for 14 days after injection via photoacoustic imaging (Fig. 6d).
Fig. 6. Tracking SiCNP620-labeled mesenchymal stem cells in vivo. (a) Photoacoustic spectrum of labeled MSCs implanted at varying cell concentrations. Labels represent injection concentrations in cells per μL. (b) Quantified photoacoustic intensity of injected SiCNP620-labeled cells at a wavelength of 770 nm. Error bars are standard deviations of 5 ROIs. (c) Photoacoustic and ultrasound overlay images of the injections. (d) Long-term tracking of the 20 000 cells per μL implant shows that cells are still visible over a period of 14 days.
Conclusions
Our future work involves understanding the mechanisms of photoacoustic excitation and optimizing the photoacoustic intensity of SiCNPs by surface modification. Coating with additional silica or etching could potentially change the photoacoustic intensity by reducing the thermal interfacial resistance between the nanoparticles and the surrounding medium.30 Studies on quantifying cells and monitoring the cell fate in vivo with photoacoustic imaging are ongoing. The ability of these nanoparticles to track differentiated stem cells and other cells will also be studied in our next study.
Long-term cell tracking is important to understand cell fate post-injection and provides insight for subsequent treatment. In this paper, we report for the first time that SiCNPs have intrinsic photoluminescence and photoacoustic signals, which enable SiCNPs to image cells in vitro and track cells in vivo. The SiCNPs were capable of long-term tracking of stem cells even after differentiation due to stable and strong luminescence. These nanoparticles showed excellent biocompatibility and labeling capacity for mesenchymal stem cells. Thus, SiCNPs are promising for long-term stem cell imaging and tracking.
Conflicts of interest
There are no conflicts to declare.
Supplementary Material
Acknowledgments
Jesse V. Jokerst, Fang Chen, and Eric Zhao acknowledge funding from the NIH R00 HL117048, DP2 HL137187 and the Chancellor's Research Excellence Scholarships (4-G6), and the infrastructure from S10 OD021821. Tao Hu is grateful for the funding support by CSU (grant # 502041001). The authors also thank the American Cancer Society Institutional Research [grant number 14-250-42] provided through the Moores Cancer Center, University of California, San Diego. This work was partially supported through access and utilization of the UC San Diego Department of NanoEngineering's Materials Research Center (NE-MRC). The authors also acknowledge the Cellular and Molecular Medicine Electron Microscopy Core Facility which is supported in part by National Institutes of Health (Award number S10OD023527).
References
- Saddow S. E., Silicon Carbide Materials for Biomedical Applications, Silicon Carbide Biotechnology, ed. S. E. Saddow, Elsevier, 2nd edn, 2016, ch. 1, pp. 1–25, ISBN 9780128029930, 10.1016/B978-0-12-802993-0.00001-0 [DOI] [Google Scholar]
- Allen M. Butter R. Chandra L. Lettington A. Rushton N. Bio-Med. Mater. Eng. 1995;5:151–159. [PubMed] [Google Scholar]
- Yakimova R. Petoral R. M. Yazdi G. R. Vahlberg C. Spetz A. L. Uvdal K. J. Phys. D: Appl. Phys. 2007;40:6435–6442. doi: 10.1088/0022-3727/40/20/S20. [DOI] [Google Scholar]
- Xu S. J. Yu M. B. Rusli Yoon S. F. Che C. M. Appl. Phys. Lett. 2000;76:2550–2552. doi: 10.1063/1.126382. [DOI] [Google Scholar]
- Botsoa J. Lysenko V. Géloën A. Marty O. Bluet J. M. Guillot G. Appl. Phys. Lett. 2008;92:173902. doi: 10.1063/1.2919731. [DOI] [Google Scholar]
- Fan J. Y. Li H. X. Iiang J. So L. K. Y. Lam Y. W. Chu P. K. Small. 2008;4:1058–1062. doi: 10.1002/smll.200800080. [DOI] [PubMed] [Google Scholar]
- Zakharko Y. Serdiuk T. Nychyporuk T. Geloen A. Lemiti M. Lysenko V. Plasmonics. 2012;7:725–732. doi: 10.1007/s11468-012-9364-2. [DOI] [PubMed] [Google Scholar]
- Beke D. Szekrenyes Z. Palfi D. Rona G. Balogh I. Maak P. A. Katona G. Czigany Z. Kamaras K. Rozsa B. Buday L. Vertessy B. Gali A. J. Mater. Res. 2013;28:205–209. doi: 10.1557/jmr.2012.296. [DOI] [Google Scholar]
- Rogov A. Rogov A. Mugnier Y. Le Dantec R. Lysenko V. Geloen A. Timoshenko V. Joulaud C. Kyrychenko A. Tishchenko I. Proc. SPIE. 2016;9722:972213-1. [Google Scholar]
- Boksebeld M. Kilin V. Geloen A. Ceccone G. Jaffal A. Schmidt C. Alekseev S. Lysenko V. Wolf J.-P. Bonacina L. RSC Adv. 2017;7:27361–27369. doi: 10.1039/C7RA03961A. [DOI] [Google Scholar]
- Chen F. Li G. Zhao E. R. Li J. Hableel G. Lemaster J. E. Bai Y. Sen G. L. Jokerst J. V. Biomaterials. 2018;179:60–70. doi: 10.1016/j.biomaterials.2018.06.027. [DOI] [PMC free article] [PubMed] [Google Scholar]
- Kim T. Lemaster J. E. Chen F. Li J. Jokerst J. V. ACS Nano. 2017;11:9022–9032. doi: 10.1021/acsnano.7b03519. [DOI] [PMC free article] [PubMed] [Google Scholar]
- Xu M. H. Wang L. H. V. Rev. Sci. Instrum. 2006;77:041101. doi: 10.1063/1.2195024. [DOI] [Google Scholar]
- Wang J. X. Chen F. Arconada-Alvarez S. J. Hartanto J. Yap L. P. Park R. Wang F. Vorobyova I. Dagliyan G. Conti P. S. Jokerst J. V. Nano Lett. 2016;16:6265–6271. doi: 10.1021/acs.nanolett.6b02557. [DOI] [PMC free article] [PubMed] [Google Scholar]
- Lemaster J. E. Jokerst J. V. Wiley Interdiscip. Rev.: Nanomed. Nanobiotechnol. 2017;9:e1404. doi: 10.1002/wics.1404. [DOI] [PMC free article] [PubMed] [Google Scholar]
- Chen F. Ma M. Wang J. Wang F. Chern S. X. Zhao E. R. Jhunjhunwala A. Darmadi S. Chen H. Jokerst J. V. Nanoscale. 2017;9:402–411. doi: 10.1039/C6NR08177K. [DOI] [PMC free article] [PubMed] [Google Scholar]
- Mercado C. Welling J. Oliva M. Li J. Gurung R. Ruit S. Tabin G. Chang D. Myung D. Journal of Mobile Technology in Medicine. 2017;6:34–42. doi: 10.7309/jmtm.6.3.6. [DOI] [PMC free article] [PubMed] [Google Scholar]
- Singh B. P. Jena J. Besra L. Bhattacharjee S. J. Nanopart. Res. 2007;9:797–806. doi: 10.1007/s11051-006-9121-6. [DOI] [Google Scholar]
- Chung T.-H. Wu S.-H. Yao M. Lu C.-W. Lin Y.-S. Hung Y. Mou C.-Y. Chen Y.-C. Huang D.-M. Biomaterials. 2007;28:2959–2966. doi: 10.1016/j.biomaterials.2007.03.006. [DOI] [PubMed] [Google Scholar]
- La Via F. Severino A. Anzalone R. Bongiorno C. Litrico G. Mauceri M. Schoeler M. Schuh P. Wellmann P. Mater. Sci. Semicond. Process. 2018;78:57–68. doi: 10.1016/j.mssp.2017.12.012. [DOI] [Google Scholar]
- Heinrich J. L. Curtis C. L. Credo G. M. Kavanagh K. L. Sailor M. J. Science. 1992;255:66–68. doi: 10.1126/science.255.5040.66. [DOI] [PubMed] [Google Scholar]
- Yanhong L. Dejun W. Qidong Z. Min Y. Qinglin Z. J. Phys. Chem. B. 2004;108:3202–3206. doi: 10.1021/jp037201k. [DOI] [Google Scholar]
- Zhang X.-F. Zhang J. Liu L. J. Fluoresc. 2014;24:819–826. doi: 10.1007/s10895-014-1356-5. [DOI] [PubMed] [Google Scholar]
- Van de Lagemaat J. Plakman M. Vanmaekelbergh D. Kelly J. Appl. Phys. Lett. 1996;69:2246–2248. doi: 10.1063/1.117142. [DOI] [Google Scholar]
- Fan J. Chu P. K. Small. 2010;6:2080–2098. doi: 10.1002/smll.201000543. [DOI] [PubMed] [Google Scholar]
- Yao J. Wang L. V. Photoacoustics. 2014;2:87–101. doi: 10.1016/j.pacs.2014.04.002. [DOI] [PMC free article] [PubMed] [Google Scholar]
- Yoon H. Luke G. P. Emelianov S. Y. Photoacoustics. 2018;12:46–54. doi: 10.1016/j.pacs.2018.10.001. [DOI] [PMC free article] [PubMed] [Google Scholar]
- Zhang B. Fang C.-Y. Chang C.-C. Peterson R. Maswadi S. Glickman R. D. Chang H.-C. Ye J. Y. Biomed. Opt. Express. 2012;3:1662–1669. doi: 10.1364/BOE.3.001662. [DOI] [PMC free article] [PubMed] [Google Scholar]
- Jokerst J. V. Khademi C. Gambhir S. S. Sci. Transl. Med. 2013;5:177ra135. doi: 10.1126/scitranslmed.3005228. [DOI] [PMC free article] [PubMed] [Google Scholar]
- Chen Y. S. Frey W. Kim S. Kruizinga P. Homan K. Emelianov S. Nano Lett. 2011;11:348–354. doi: 10.1021/nl1042006. [DOI] [PMC free article] [PubMed] [Google Scholar]


