

Abstract
Finding early disease markers using non-invasive and widely available methods is essential to develop a successful therapy for Alzheimer’s Disease. Few studies to date have examined urine, the most readily available biofluid. Here we report the largest study to date using comprehensive metabolic phenotyping platforms (NMR spectroscopy and UHPLC-MS) to probe the urinary metabolome in-depth in people with Alzheimer’s Disease and Mild Cognitive Impairment. Feature reduction was performed using metabolomic Quantitative Trait Loci, resulting in the list of metabolites associated with the genetic variants. This approach helps accuracy in identification of disease states and provides a route to a plausible mechanistic link to pathological processes. Using these mQTLs we built a Random Forests model, which not only correctly discriminates between people with Alzheimer’s Disease and age-matched controls, but also between individuals with Mild Cognitive Impairment who were later diagnosed with Alzheimer’s Disease and those who were not. Further annotation of top-ranking metabolic features nominated by the trained model revealed the involvement of cholesterol-derived metabolites and small-molecules that were linked to Alzheimer’s pathology in previous studies.
Subject terms: Biomarkers, Dementia, Alzheimer's disease, Metabolomics, Genomics
Introduction
Unmet medical need and the repeated failure of clinical trials in Alzheimer’s disease (AD) have together resulted in a surge of research seeking to understand disease mechanisms and generate novel therapeutic approaches. In order for such therapies to succeed it is widely accepted that trials will need to be performed early in the disease process1,2. Currently, the optimal biomarkers used to detect AD processes early in the course of the disease are Positron Emission Tomography (PET) imaging and cerebrospinal fluid (CSF) markers3. However, PET imaging is not universally available and obtaining CSF is a relatively invasive procedure. Progress has been made in the attempt to supplement these relatively specific biomarkers with other biomarkers that might be more applicable to larger populations using, for example, blood biomarkers. Putative markers in blood have been identified using proteomics, transcriptomics, metabolic and lipidomic phenotyping platforms. Efforts are now underway to replicate these and to generate single markers or biomarker panels that might be used as part of a process identifying people with early disease4–6.
There are relatively few studies examining the potential of urine as a biomarker fluid in AD7–10, probably because being separated from the brain not only by the blood–brain barrier but also by glomerular filtration, urine seems inherently unlikely to possess a signature of neurodegeneration. Most of the studies reported to date are small both in terms of the numbers of molecular targets and numbers of individuals examined. However, urine is a complex fluid with metabolites that reflect a response to injury11 and oxidative stress12 amongst other biological events at the systems level and might, therefore, be useful as a target fluid in neurodegeneration and other brain diseases13. An added advantage is that urine carries information on the metabolites arising from the gut microbiome14, an area of research that is gaining greater focus in neurodegeneration and AD15,16. In mouse models a range of methods to characterize the urine metabolome have been employed, with some success in identifying markers that differ between transgenic animals and controls17–20, but these models do not encompass the full systems effect and metabolic progression of AD in humans. Therefore deep exploration of the urinary metabolome for biomarkers relevant to AD may yield valuable mechanistic information. We report here the application of in-depth urinary metabolic phenotyping in a large multi-centre study consisting of four groups of participants. One group consisted of individuals clinically diagnosed with AD. A second group consisted of individuals with no apparent clinical symptoms of cognitive decline or dementia (control group—CTL). The final two groups consisted of individuals diagnosed with Mild Cognitive Impairment (MCI) who either remained cognitively stable throughout the follow-up term of the study (sMCI) or converted to a clinical AD diagnosis at a later study visit (cMCI). All samples that underwent metabolic phenotyping were collected at a single time point (baseline assessment).
Metabolic phenotyping was completed using a complementary dual-platform approach consisting of both proton nuclear magnetic resonance spectroscopy (1H-NMR) and ultra-high-performance liquid chromatography coupled with mass spectrometry (UHPLC-MS) to ensure comprehensive metabolite coverage. Critically, in order to address the challenge of rich metabolic datasets, where analytical variables far exceed the numbers of samples available to study, we applied a novel approach consisting of metabolomic dataset normalisation followed by a feature reduction process that only selected those metabolites which associated with a metabolic regulatory genetic element—a technique known as Quantitative Trait Loci for metabolites (mQTL). In this way, we identified a panel of metabolites that might accurately classify the participant groups. Of particular interest was the ability of the classification model to differentiate between baseline MCI participants, who later either remained cognitively stable (sMCI) or converted to clinical AD (cMCI) which heralds promise for non-invasive scoping for early biomarkers of AD.
The classification model was used to prioritise metabolites for annotation according to their importance to predict AD. The analysis of the annotated metabolites revealed multiple direct and a few indirect links to the etiopathological processes in AD.
Results
We report here the largest study to date of metabolic phenotyping analysis of urine as a potential marker of AD. Metabolic phenotyping was performed on urine obtained from the AddNeuroMed/Dementia Case Registry (ANM/DCR) cohorts21–23 using two analytical platforms: UHPLC-MS ( samples) and 1H-NMR ( samples). The cohort of participants used in the analysis includes participants with normal cognition (control group—CTL), stable mild cognitive impairment (sMCI), mild cognitive impairment converting to dementia (cMCI) and participants with Alzheimer’s disease (AD) (Table 1). The number of available samples and metabolic features is summarised in Table 2. Using an innovative approach to the challenge of very high dimensionality data analysis, we first prioritise a set of metabolites using mQTL mapping, ensuring that features with a degree of genetic regulation were selected. From this reduced feature selection, we were then able to select metabolites that are associated with AD and were able to predict conversion to dementia from MCI.
Table 1.
Overview of study participants.
| CTL | sMCI | cMCI | AD | Total | |
|---|---|---|---|---|---|
| Number of participants | 214 | 200 | 55 | 197 | 666 |
| Age | |||||
| Mean sd | |||||
| Sex | |||||
| Male | 103 | 99 | 20 | 101 | 323 |
| Female | 111 | 101 | 35 | 96 | 343 |
| MMSE score | |||||
| Mean sd | |||||
| Metabolic UHPLC-MS data obtained | 172 | 167 | 45 | 177 | 561 |
| Metabolic NMR data obtained | 174 | 173 | 46 | 182 | 575 |
| Metabolic data obtained (UHPLC-MS and NMR) | 132 | 140 | 36 | 162 | 470 |
| Genetic and metabolic UHPLC-MS data available | 119 | 80 | 24 | 122 | 345 |
| Genetic and metabolic NMR data available | 120 | 83 | 23 | 126 | 352 |
| APOE genotype available | 154 | 155 | 44 | 174 | 527 |
| APOE genotype | |||||
| E3E3 | 84 | 84 | 13 | 70 | 251 |
| E3E4 | 37 | 50 | 24 | 66 | 177 |
| E2E3 | 22 | 10 | 4 | 9 | 45 |
| E4E4 | 7 | 7 | 3 | 27 | 43 |
| E2E4 | 3 | 4 | 0 | 2 | 9 |
| E2E2 | 1 | 1 | 0 | 0 | 2 |
CTL normal cognition (control) participants, sMCI stable mild cognitive impairment, cMCI mild cognitive impairment converting to dementia, AD participants with Alzheimer’s disease, MMSE Mini-Mental State Examination.
Table 2.
Summary of samples and metabolic features available for the analysis.
| Platform | Assay | Abbreviation | # metabolic features | # samples | # metabolic QTL samples |
|---|---|---|---|---|---|
| UHPLC-MS | HILIC ESI+ | UHPOS | 6851 | 561 | 345 |
| RPC ESI− | URNEG | 16,961 | 561 | 345 | |
| RPC ESI+ | URPOS | 13,217 | 561 | 345 | |
| NMR | 1H NMR | NMR | 18,646 | 575 | 352 |
Details of used metabolomic platforms and assays are available in “Methods” section. Number of metabolic QTL samples—genetic and metabolic data availability.
Dimensionality reduction of metabolic features
Given that the number of metabolic features found in the cohort samples was orders of magnitude higher than the number of samples (specifically 55,675 features), as the first step we developed a novel feature reduction method. We utilised the availability of genetic data, in particular, 12 million SNPs obtained in the previous study24 and looked for an association between these SNPs and the metabolic features, performing metabolic quantitative trait locus analysis. We hypothesized that an association between a metabolite and a disease state is more likely to be relevant to an etiopathological mechanism if this metabolite was also associated with a genetic variant previously linked to a relevant disease phenotype.
The mQTL analysis resulted in a total of 1542 individual metabolic features relating to either a chemical shift in the case of 1H NMR (233 metabolic features) or a chromatographic retention time and mass to charge ratio (m/z) feature in the UHPLC-MS data (1309 features). The resultant metabolic features were associated with 6932 SNPs at a q-value (Table 3, Fig. 1). Of these, 6047 unique SNPs were linked to features from the UHPLC-MS data, 876 SNPs to features from the 1H NMR data, with 838 SNPs common to both. Given the 12 million SNPs tested, the probability of observing 838 or more SNPs in the intersection between UHPLC-MS and 1H NMR results by chance is vanishingly small (p-value < 2.23E−308). Previously, a total of 276 metabolomic QTLs have been reported25–30, and 83% of these SNPs were reproduced in the current study (Supplementary Materials Table S2), thereby, validating our pipeline.
Table 3.
Metabolic QTL mapping results.
| Assay | # SNP/metabolic feature associations | # unique SNPs | # unique metabolic features |
|---|---|---|---|
| UHPOS | 26,256 | 3004 | 256 |
| URNEG | 50,251 | 3974 | 518 |
| URPOS | 46,617 | 4479 | 535 |
| NMR | 12,518 | 876 | 233 |
Numbers of associations between metabolic features and SNPs found using q-value cut-off 0.01, resulting in a number of unique metabolic features and a number of unique SNPs for each metabolomic assay.
Figure 1.

Manhattan plots presenting significant QTL associations with metabolic features across the metabolite phenotyping datasets. The x-axis shows each SNP that was analysed, sorted by chromosome and position. The y-axis shows the log10 of the p-value for association with metabolic features concentration. Four sections correspond to four different metabolomic assays presented in our study: UHPOS, URNEG, URPOS and NMR.
Ranking of metabolic features for annotation
Metabolite annotation remains the bottleneck and limitation of metabolic phenotyping studies31,32. After reducing the number of metabolic features to 1542, we aimed to prioritise them according to their relative importance of correctly predicting the AD state of the sample. We first built and tested Random Forests classification models on different combinations of features and diagnostic classes (for details see “Methods”). Briefly, we hypothesised that genomics data in combination with metabolic features and sample covariates could improve the prediction quality and tried combinations of following features: (1) 1542 metabolic features after the mQTL filtering, (2) 6932 SNPs associated with metabolic features and (3) sample covariates—age, sex and study site. Also, to account for the imbalance between the diagnostic classes, with the prevalence of AD and CTL classes over sMCI and cMCI classes, we applied re-sampling. First, we analysed all data in relation to the four original diagnostic categories (AD/CTL/cMCI/sMCI). Then, hypothesising that cMCI would be most similar to AD and sMCI most similar to control, we performed binary over-sampling by creating AD + cMCI and CTL + sMCI groups. Finally, we applied the under-sampling by using AD and CTL groups only. As the model trained on 1542 metabolic features together with sample covariates and only two diagnostic classes (AD and CTL) gave the lowest prediction error, it was selected as the final model (Fig. 2).
Figure 2.
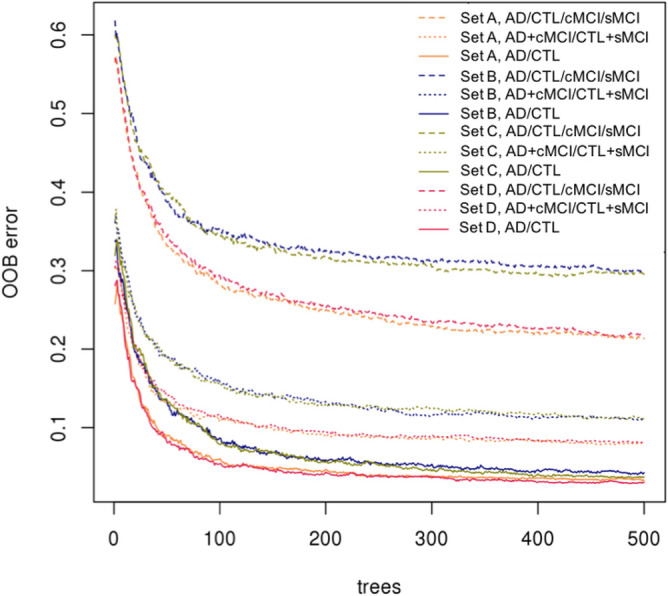
Performance of Random Forest models for different feature sets and three tested ways of classification. Tested feature sets: (A) metabolic features only, (B) metabolic and genomic features, (C) metabolic and genomic features together with sample covariates, and (D) metabolic features with sample covariates. Tested ways of classification: original multi-class—AD/CTL/cMCI/sMCI, binary over-sampling—AD + cMCI/CTL + sMCI, and binary under-sampling— AD/CTL. The best performing final model: set (D), binary under-sampling classification AD/CTL. The x-axis shows a number of trees used in the Random Forest run. The y-axis shows the Out-Of-Bug (OOB) prediction error.
To further validate the performance of the final model, MCI samples were used. The model proved effective in separating MCI samples from individuals who subsequently converted to dementia (cMCI) from those who remained stable (sMCI), finding that 82.96% of cMCI samples were predicted as AD and 77.78% of sMCI samples as CTL (Fig. 3). This provided additional evidence that our feature reduction method resulted in a meaningful set of metabolites enabling the detection of early AD patients, along with the previous validation of 83% of associated SNPs in AD-related literature. The AUROC value of the model was 0.99 (Table 4 and Fig. 3), showing that the final model was quite robust.
Figure 3.
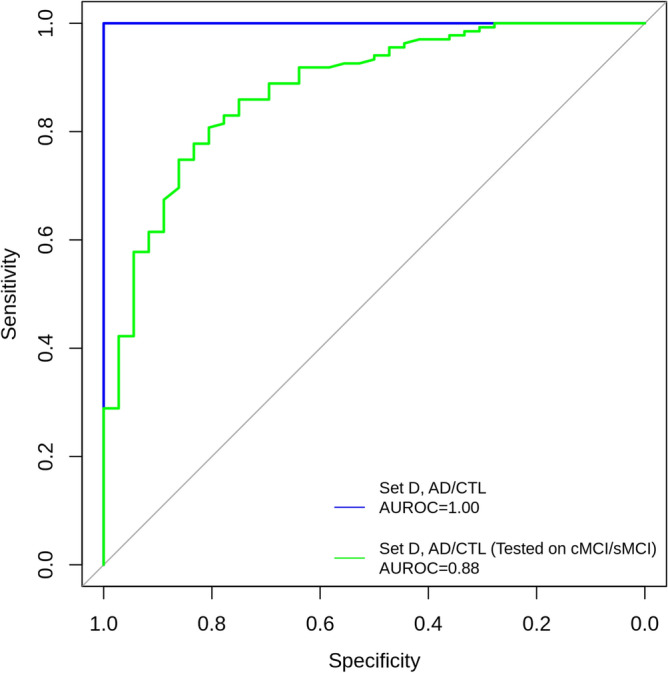
Receiver Operating Characteristic (ROC) curves for RF model discriminating AD vs CTL and then applied to cMCI and sMCI study groups. The model was trained with 1542 prioritised metabolic features and three covariates (age, sex, study site) identified from the AD vs CTL comparison only. The area under the ROC curve (AUROC) value for the AD vs CTL is 0.99. The AUROC value for cMCI vs sMCI classes is 0.88.
Table 4.
Performance of the final classification model.
| Dataset | Balanced accuracy | AUROC | Sensitivity | Specificity | Positive predictive value | Negative predictive value |
|---|---|---|---|---|---|---|
| Final model AD vs CTL | 0.9872 | 1 | 1 | 0.9744 | 0.9796 | 1 |
| Final model cMCI vs sMCI | 0.8037 | 0.8785 | 0.7778 | 0.8296 | 0.5490 | 0.9333 |
Performance of the final classification model in discriminating AD vs CTL and cMCI vs sMCI.
Next, we used the developed Random Forest model for prioritisation of the metabolic features by computing the permutation importance score for each metabolic feature (Supplementary Materials Table S3). This method gave us 235 metabolic features with a score of at least . Out of these, 32 features were successfully annotated by spectral interpretation. Since multiple analytical signals can correspond to the same metabolite, the annotation process resulted in a total list of 23 metabolites (Table 5).
Table 5.
Annotated metabolites.
| Metabolite family | Metabolite annotation | Assay | # | PIC | F (3, 471) | p-value | CTL vs AD | CTL vs cMCI | CTL vs sMCI |
|---|---|---|---|---|---|---|---|---|---|
| Exogenous metabolites | N-Desmethyl O-desacetyl diltiazem glucuronide | UHPOS | 1 | 0.04943 | 112.8 | < 2E − 16 | 1.53 E − 11 | 1.54 E − 11 | 5.94 E − 02 |
| N-Desmethyl O-desacetyl hydroxy diltiazem glucuronide | UHPOS | 1 | 0.02553 | 80.3 | < 2 E − 16 | 1.53 E − 11 | 1.54 E − 11 | 3.32 E − 02 | |
| N-Desmethyl hydroxy diltiazem glucuronide | URPOS | 1 | 0.00741 | 40.13 | < 2 E − 16 | 1.53 E − 11 | 1.54 E − 11 | 1.27 E − 01 | |
| Paracetamol | UHPOS | 1 | 0.02314 | 59.34 | < 2 E − 16 | 1.53 E − 11 | 9.98 E − 01 | 7.30 E − 09 | |
| Paracetamol sulphate | URPOS | 1 | 0.003 | 26.66 | 6.19 E − 16 | 1.53 E − 11 | 9.26 E − 01 | 9.66 E − 01 | |
| 3-Methoxy-paracetamol sulphate | URPOS | 1 | 0.00105 | 11.97 | 1.45 E − 07 | 4.00 E − 07 | 1.26 E − 01 | 7.85 E − 01 | |
| Quinine | UHPOS | 1 | 0.00028 | 13.26 | 2.56 E − 08 | 3.66 E − 07 | 2.66 E − 03 | 1.02 E − 06 | |
| Cholesterol derived metabolites |
Hydroxylated pregnenolone sulphate N-Acetylglucosamine isomer 2* |
URNEG | 1 | 0.0051 | 34.75 | < 2 E − 16 | 1.53 E − 11 | 5.61 E − 02 | 9.86 E − 01 |
| Hydroxylated pregnenolone sulphate N-acetylglucosamine isomer 1* | URNEG | 1 | 0.01073 | 46.28 | < 2 E − 16 | 1.53 E − 11 | 8.84 E − 03 | 8.26 E − 02 | |
| Pregnenolone sulphate N-acetylglucosamine | URNEG | 5 | 0.00463 | 26.42 | 8.39 E − 16 | 1.54 E − 11 | 4.87 E − 03 | 8.22 E − 02 | |
| Pregnanediol sulphate N-acetylglucosamine | URNEG | 1 | 0.00025 | 13.06 | 3.34 E − 08 | 3.02 E − 07 | 9.49 E − 01 | 9.30 E − 01 | |
| Taurochenodeoxycholicc or taurodeoxycholic acid Nacetylglucosaminide* | URNEG | 1 | 0.00052 | 20.31 | 2.18 E − 12 | 3.14 E − 10 | 9.99 E − 01 | 9.03 E − 01 | |
| Nucleosides, amines, carnitines, glycines | 3-Aminoisobutyrate | NMR | 2 | 0.00015 | 2.18 | 8.99 E − 02 | 9.44 E − 01 | 6.25 E − 01 | 3.75 E − 01 |
| N,N,N-Trimethyl-L-alanyl-L-proline betaine | URPOS | 2 | 0.00299 | 34.09 | < 2 E − 16 | 1.53 E − 11 | 8.65 E − 02 | 5.57 E − 02 | |
| Butyryl or isobutyryl carnitine* | UHPOS | 1 | 0.00054 | 14.54 | 4.57 E − 09 | 1.16 E − 08 | 7.25 E − 03 | 3.53 E − 01 | |
| Trimethylamine | NMR | 1 | 0.00014 | 1.68 | 1.71 E − 01 | 2.81 E − 01 | 9.48 E − 01 | 1.67 E − 01 | |
| L-Lysine | NMR | 1 | 0.00011 | 1.33 | 2.56 E − 01 | 9.90 E − 01 | 9.07 E − 01 | 4.65 E − 01 | |
| 5-Methylcytidine | UHPOS | 2 | 0.00075 | 18.56 | 2.16 E − 11 | 2.67 E − 11 | 1.79 E − 01 | 9.89 E − 02 | |
| 2-O-Methylcytidine | UHPOS | 1 | 0.00033 | 20.54 | 1.62 E − 12 | 1.93 E − 09 | 7.12 E − 01 | 9.79 E − 01 | |
| Unknown nucleoside with adenosyl moiety | UHPOS | 1 | 0.00026 | 9.24 | 5.99 E − 06 | 2.90 E − 06 | 1.71 E − 01 | 3.18 E − 01 | |
| N-Acetylisoputreanine-gamma-lactam | URPOS | 2 | 0.00046 | 13.42 | 2.06 E − 08 | 4.55 E − 09 | 1.74 E − 02 | 5.36 E − 03 | |
| Sugars | Sucrose | NMR | 1 | 0.00027 | 0.17 | 9.20 E − 01 | 6.78 E − 04 | 5.99 E − 01 | 1.56 E − 01 |
| Galactose | NMR | 2 | 0.0001 | 0.17 | 9.20 E − 01 | 9.05 E − 01 | 9.77 E − 01 | 9.74 E − 01 |
Note (*) signifies isomers that cannot be differentiated using mass spectrometry fragmentation data. Column headers: Assay—metabolomic assay; #—a number of metabolic features in the dataset; PIC—Permutation Importance Score from Random Forest algorithm showing the importance of metabolite for classification purpose; F (3, 471)—ANOVA results (MANOVA in case of multiple metabolic features) presented as F-statistic; p-value—ANOVA (MANOVA in case of multiple metabolic features) results presented as adjusted p-value; CTL vs AD, CTL vs cMCI and CTL vs sMCI—post hoc tests results presented as adjusted p-value. In the last four columns, Scientific Notation is used due to the presence of very small numbers.
Analysis of annotated metabolites
We found three broad groups of annotated metabolites differentially present in the disease state: (1) conjugated metabolites of cholesterol derived compounds, (2) small molecule metabolites and (3) metabolites of exogenous sources.
Following the annotation, we quantified the differences in the levels of assigned metabolites across study groups using ANOVA (Table 5). A heatmap demonstrating inter-annotation correlations is shown in Fig. 4.
Figure 4.
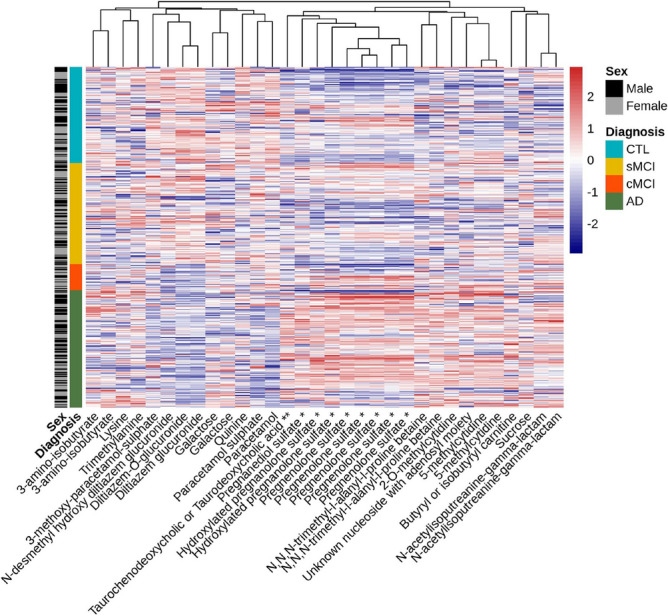
The heatmap showing concentrations of the annotated metabolic features. Note (*) indicates metabolite conjugation with N-acetylglucosamine, note (**) indicates metabolite conjugation with N-acetylglucosaminide. Columns sharing the same metabolite names are isomers of each other.
Having assigned chemical identity, we then investigated whether the associated SNPs were linked to any previously reported GWAS traits to gain potential insight into the relationship between metabolomic and genomic variations. We mapped any polymorphisms associated with our annotated metabolites to the GWAS Catalog’s SNPs48 by genomic regions ans summarised them in Table 6.
Table 6.
Annotated metabolites with mQTL results, phenotypic traits and literature findings.
| Metabolic pathway | Metabolite annotation | Chr | Genes/genomic region | Phenotypic traits | Relationship to AD |
|---|---|---|---|---|---|
| N-Desmethyl O-desacetyl diltiazem glucuronide | |||||
| N-Desmethyl O-desacetyl hydroxy diltiazem glucuronide | 1 | Regulatory feature: ENSR00000006069 | Anxiety and major depressive disorder, Obesity-related traits | ||
| N-Desmethyl hydroxy diltiazem glucuronide | 15 | MESP2 | Coronary artery aneurysm in Kawasaki disease | ||
| Paracetamol | |||||
| Paracetamol sulphate | |||||
| 3-Methoxy-paracetamol sulphate | 4 AND 17 | SORCS2 AND CNTROB | Biopolar disorder, Interleukin-10 levels | SORCS2 belongs to the Vps10 receptor family that has previously been linked to neurodegeneration and AD34–35, and is known to play functional roles in protein transport. In addition, the receptor family includes the SORL1 gene that encodes protein SorLA—a key protein in amyloid-beta precursor protein (APP) processing36. | |
| Quinine | 2 | AOX1 | Late-onset Alzheimer’s disease | The mQTL association links aldehyde oxydase 1 (AOX1) gene and quinine. AOX1 gene has a previously reported GWAS trait “Late-onset Alzheimer’s disease”37. | |
| Cholesterol metabolism (CM) | Hydroxylated pregnenolone sulphate N-acetylglucosamine isomer 2* | 7 | CHN2 | Age at onset, Alzheimer’s disease, Obesity-related traits, Psychosis | Beta-chimaerin (CHN2) gene plays a role in neural development by regulating Rac1 activity38 and is known to be downregulated with age. Through Rac1 activation, gene CHN2 is linked with Alzheimer’s disease39. |
| Hydroxylated pregnenolone sulphate N-acetylglucosamine isomer 1* | |||||
| Pregnenolone sulphate N-acetylglucosamine | |||||
| Pregnanediol sulphate N-acetylglucosamine | |||||
| Tauro(cheno) deoxycholic acid N-acetylglucosaminide * | 5 | UGT3A1 | Blood metabolite levels, Primary biliary cholangitis (PBC) | Neither the gene UGT3A1 nor the PBC has a known relationship to AD, although we note that a progressive cognitive impairment different to delirium is a feature of PBC, independently of liver pathology40,41. In animal models of biliary cirrhosis that has led to memory impairment, hippocampal pregnenolone sulphate infusion resulted in a memory-enhancing effect42. | |
| CM, gut microbiota | 3-Aminoisobutyrate | 5 | AGXT2 | Metabolite levels, Asymmetrical dimethylarginine levels, Symmetrical dimethylarginine levels | |
| Gut microbiota | N,N,N-Trimethyl-l-alanyl-l-proline betaine | 11 AND 21 | Regulatory feature: ENSR00000961656 AND intergenic variant | ||
| Butyryl or isobutyryl carnitine * | 15 | intergenic variant | |||
| Trimethylamine | 10 | PYROXD2 | General cognitive ability, Obesity-related traits, Metabolite levels | ||
| l-Lysine | 19 | SLC7A9 | Estimated glomerular filtration rate, Creatinine levels | ||
| DNA methylation | 5-Methylcytidine | 4 | CC2D2, FBXL5, FAM200B, BST1 | Parkinson’s disease, Blood protein levels, Cerebrospinal fluid biomarker levels | The FBXL5 gene is a critical component of iron metabolism43. It is associated with Parkinson’s disease (PD) in a region of chromosome 4. Iron dysregulation has long been associated with both PD and AD44. |
| 2-O-methylcytidine | 9 | NUP188, DOLK, PHYHD1, SH3GLB2 | Body mass index | The PHYHD1 gene encodes 2-oxoglutarate oxygensase, an amyloid-beta interacting protein that has been shown to be dysregulated in both AD brain and in transgenic models with plaque pathology45,46. | |
| Unknown nucleoside with adenosyl moiety | 12 | Intergenic variant | The nearest gene to mQTL region is SYT1. It encodes protein synaptotagmin—a novel cerebrospinal fluid biomarker for Alzheimer’s disease47. | ||
| Polyamine metabolism | N- Acetylisoputreanine-gamma-lactam | 2 | Long intergenic non-protein coding RNA LINC01914 | ||
| CM, insulin resistance | Sucrose | 8 | Intergenic variant | ||
| Galactose | 19 | FUT2 | Estimated glomerular filtration rate, Cholesterol levels |
Note (*) signifies isomers that cannot be differentiated using mass spectrometry fragmentation data. We present phenotypic traits previously associated with a genomic region of interest, and possible linkage of found genes to AD processes.
We speculate that all endogenous annotated metabolites are linked to AD processes through alteration of DNA methylation, gut microbiota malfunction and possibly altered metabolism of polyamines, cholesterol and sugar (Table 6, Fig. 5). The key observations from these analyses are reported in the sections below.
Figure 5.

Annotated metabolites and their linkage to AD. Red colour indicates metabolites annotated in the study. Up arrow next to the metabolite’s name indicates increased levels in AD patients samples. Down arrow shows decreased levels in AD patients samples.
Cholesterol metabolism
There are three unique metabolites derived from cholesterol metabolism, all in the conjugated form: tauro(cheno)deoxycholic acid, pregnenolone and pregnanediol. These metabolites have higher levels in the AD and cMCI study groups (Table 5).
We found the two hormones, pregnenolone and pregnanediol, conjugated with sulfate and N-acetylglucosamine, both biotransformations were observed in human urine previously49.
Annotated tauro(cheno)deoxycholic bile acid (an isomer of taurochenodeoxycholic or taurodeoxycholic acid) is conjugated with an N-acetylglucosamine, known biotransformation prior to bile acid renal excretion50. There is an increased level of taurochenodeoxycholic or taurodeoxycholic acid conjugates in AD patients (see “Discussion” section).
Sugar metabolism and gut microbiota
We identified sucrose and galactose sugars with sucrose levels significantly higher in AD study group.
The following annotated metabolites are produced in or derived from gut microbiota processes: N,N,N-trimethyl-l-alanyl-l-proline betaine, 3-aminoisobutyrate, trimethylamine, lysine, butyrylcarnitine, and mentioned above, taurodeoxycholic acid. These metabolites have increased levels in AD patients (Table 5).
DNA methylation and polyamine metabolism
Evidence of DNA methylation in AD patients’ urine is found in the observation of two methylcytidine metabolites: 5-methylcytidine, and 2-O-methylcytidine. Another metabolite that shared the pattern of alterations with two methylated cytidine metabolites was annotated as “unknown nucleoside with adenosyl moiety”. We were not able to identify its structure definitively in this analysis but the mass spectrometric data provided the molecular formula C10H11N5O3, and fragmentation data indicated the presence of adenosyl moiety in the molecule (some details regarding structure elucidation effort are presented in the “Supplementary Document” “Metabolite_Annotation_details.docx”).
Another annotated metabolite is N-acetylisoputreanine-gamma-lactam, a catabolic product of spermidine. This metabolite levels alter not only in AD but also in cMCI and sMCI groups (Table 5).
Exogenous metabolites
Amongst exogenous metabolites, we found two prescribed medications, paracetamol and the calcium channel blocker diltiazem, in addition to the metabolite quinine. All three exogenous metabolites have associations with genetic variants (Table 6) and their levels significantly alter in study groups, as shown in Table 5.
Discussion
Previous studies have reported data suggesting that a panel of metabolites circulating in blood was able to predict incipient AD with very high degrees of accuracy51,52, raising considerable hopes for finding pre-clinical AD biomarkers in blood. Subsequent studies using a similar, if not identical approach, in multiple, larger cohorts failed to replicate these findings53–55. Other studies have reported metabolic and lipidomic differences in blood from people with disease compared to age-matched controls with various degrees of power, success and outcome56–59. However, none of these studies have been unequivocally replicated. One of the limitations of studies with high dimensionality datasets and relatively small numbers of samples is susceptibility to over-fitting. Additionally, because of the inherent problems of heterogeneity in neurodegenerative disease and the diversity of analytical platforms used in metabolic profiling (1H-NMR, GC-MS, UHPLC-MS, CE-MS etc.), it is perhaps not surprising that there has been relatively little replication of metabolic phenotyping studies that seek biomarkers of disease. Similar problems plagued early genetic studies seeking susceptibility factors, but these have been largely overcome by the introduction of studies based on tens of thousands of individuals. In genetics it was possible to combine data from different cohorts using imputation techniques. This approach is more challenging for metabolic phenotyping approaches, which often utilize heterogeneous technologies and independent assays, the results from which are more difficult to build a comprehensive picture of the metabolic landscape. With increased throughput and lower cost of metabolic assays, such larger studies will become possible in future.
In the absence of studies with large sample size, one approach to combat the limitation of high dimensionality in molecular studies is to reduce the dimensionality of the data. To achieve this, here we used the mQTL approach. In doing so, we provide for the possibility of a degree of validation in other, much larger dataset derived from genetic associations studies, also enabling the inference of a degree of causality when an association is discovered. While this work requires replication, this finding holds promise for biomarkers in urine—arguably the most readily available biomarker fluid. Using this mQTL targeting approach, we show a highly significant association of a relatively small set of 32 metabolic features with AD. A model generated from these features not only accurately predicts the disease state, but more importantly, the same model when applied to samples from participants with the clinical diagnosis of mild cognitive impairment (MCI), distinguishes those subjects that subsequently progress to dementia (cMCI) from those that remain stable (sMCI). Note that, MCI is commonly referred to as a prodromal condition, but in fact, is a highly heterogeneous state defined by impaired cognitive function relative to age-adjusted norms. An easy to perform test to identify people in the prodromal phase of AD, distinguishing the subjects with MCI that are likely to convert to AD from those remaining stable, would be an important advance for the field. Our results suggest that the analysis of urinary metabolites might provide such a test.
Given that the sample size in our study is small, in the absence of a larger replication cohort, it is important to provide as much additional evidence as possible showing that the method we developed is reliable. One such type of evidence comes from the analysis of the annotated metabolites. One set of metabolites that we found is related to cholesterol—a critical biological precursor, required for the biosynthesis of downstream metabolites such as bile acids, hormones and steroids, which are commonly found in their conjugated form in the urine. Hormones and related steroidal structures derived from cholesterol are known to have a role in brain function. Observed in this study pregnenolone sulfate is a known neuro-steroid species60,61 reported to influence cognition in rodent models62 and patient studies, perhaps through its role in modulating gamma-aminobutyric acid subunit A (GABAA) and N-methyl d-aspartate (NMDA) receptors61. The other hormone we annotated—pregnanediol, a metabolite of pregnenolone, was previously reported to be lower in the urine of older men62, however, this has not been linked to AD. Concentrations of non-conjugated bile acids were observed to be altered in AD in human blood and brain samples and in transgenic models of the disease58,63. A recent study on mouse models discovered that bile acids strongly inhibit the cysteine dioxygenase type-1-mediated (CDO1-mediated) cysteine catabolic pathway resulting in depletion of the free cysteine pool and reduction of the glutathione concentration64. Here, we found an increased level of taurochenodeoxycholic or taurodeoxycholic acid conjugates in AD patients. Taurodeoxycholic acid, is the secondary bile acid that was previously observed to be increased in AD patients as the result of hypothesised gut microbiota malfunction65. The need for further investigation of cholesterol related metabolites in AD pathology is strongly supported both by previous research and by our study results.
Sugar metabolism was previously implicated in AD pathophysiology linking dysregulation in glucose metabolism and insulin resistance56. We found sucrose and galactose sugars to be important for the AD classification. Studies in mice suggest that sucrose disrupts mitochondrial activity and promotes amyloid deposition in the brains of transgenic AD mice66. Additionally, treatment of ovariectomised rats using d-galactose leads to AD-like pathology and the development of AD in a rodent model67. The researchers reported the observed AD pathology was prevented following injections of 17- estradiol, suggesting a potential interlinked role for disruptions in sugar and sex hormone metabolism, alternations of both are reported in our results. However, it is necessary to highlight that we have very limited known covariates of this retrospective data cohort that was collected ten years ago. Original study participants exclusion criteria included other neurological or psychiatric diseases, significant unstable systemic illness or organ failure and alcohol or substance misuse21. That knowledge gives us some assurance that study participants did not have other diagnosed medical conditions like diabetes mellitus type 2 and renal disease.
Evidence of gut microbiota malfunction is a noticeable trait in our findings. We annotated trimethylamine, N,N,N-trimethyl-l-alanyl-l-proline betaine, 3-aminoisobutyrate, l-lysine and butyrylcarnitine metabolites with different levels of concentrations amongst study groups. We detected several metabolites closely linked to betaine, though not betaine directly. Betaine is a source for trimethylamine production and an alternate methyl source for converting homocysteine to methionine68, increasing DNA methylation and altering gene expression69. We detected trimethylamine, a metabolite released in gut microbiota from trimethylamine-containing dietary phospholipid components such as choline, lecithin, l-carnitine and mentioned above betaine. The oxidation of trimethylamine generates trimethylamine N-oxide that was reported to be elevated in Alzheimer’s patients15. In addition, observed here N,N,N-trimethyl-l-alanyl-l-proline betaine is a recently discovered plasma biomarker of kidney function. Plausibly this metabolite is a product of betaine and myosin light chain degradation70, though this hypothesis has yet to be confirmed. Another detected product of gut microbiota processes is butyrylcarnitine—a product of l-carnitine processing in the human body. Previous research conducted in the mouse brain has shown that in old age, the AD genetic load significantly increase levels of butyrylcarnitine71. Changes in butyrylcarnitine concentrations together with the observation of elevated levels of lysine in AD patients suggest alterations of carnitine in AD, since lysine is one of the sources for carnitine production in humans. These complex metabolic processes in gut microbiota require further investigation.
We speculate that changes in DNA methylation during AD processes are verified through observed alterations of 5-methylcytidine and 2-O-methylcytidine. These results correlate with recent reports showing significant alterations in 5-methylcytidine in early stages of Alzheimer’s disease72. Alterations in the concentrations of N-acetylisoputreanine-gamma-lactam, a catabolic product of spermidine that is formed from N-actetylspermidine73 support a potentially altered metabolism of polyamines in AD: the stimulation of ornithine decarboxylase in the AD process leads to increased levels of N-acetylspermidine and spermidine74.
Exogenous metabolites found in this study and their linkage with genomic variants (paracetamol and quinine) or with possible dementia protective effect (diltiazem metabolomic profile) are significant findings for further investigation. Given that the prescription of quinine preparations is recommended only for malaria prophylaxis, this is an unlikely explanation for the quinine finding in this European population of older people. However, its prevalence in dietary sources may explain its presence in the population. This finding, along with the reporting of altered levels of diltiazem and paracetamol in AD is not obviously explicable, although reverse causality, where the disease state is resulting in a change in either prescription or compliance with medication, is an obvious possible explanation of the finding.
While the strengths of the study lie in the mQTL approach and the acquisition of a large amount of metabolic phenotyping data, there are undoubtedly limitations to consider. First, although large compared to previously reported urine studies, the analysis remains vulnerable to over-fitting and bias as the number of features is three times that of the number of samples, even following the mQTL based feature reduction. Clearly, larger and independent datasets are necessary to replicate the findings we report here. This could be achieved using a targeted quantitative mass spectrometry assay, specifically designed to quantitate the metabolic pathways of the key metabolites identified here. This would both help validate the findings and provide greater insight into pathway mechanisms and the networks involved. Secondly, the cohort used here, lacks specific diagnostic biomarkers (such as PET or CSF measures) indicative of pathological load and the diagnostic categorisation rests on experienced clinician assessment together with systematic assessment by a research worker, albeit using a widely tested and proven methodology. Ideally, data would also be collected on diet and life-style factors such as exercise and other environmental exposures together with detailed assessments of co-morbid and prior medical history and medication use. Such exploration of factors beyond diagnostic category that might influence the metabolic profile will be important topics for future studies. Lastly, by focusing on the metabolites with an associated genetic variant, we may exclude metabolites that have a significant association with AD but are largely influenced by the environment, lifestyle and not as strongly by genetics. The further research of exogenous metabolites, such as medicines and dietary compounds, as well as effects of environmental factors on metabolic processes in AD is necessary.
Methods
We confirm that: all experiments were performed in accordance with relevant guidelines and regulations; all methods were carried out in accordance with relevant guidelines and regulations; all experimental protocols were approved by the European Union AddNeuroMed program.
Study participants
The data and biospecimens were collected (AddNeuroMed/Dementia Case Registry (ANM/DCR) cohort) in European, multi-site study, public-private partnership21–23. The cohort includes participants with established AD, MCI and normal cognition who were evaluated using well-established systematic interviews for diagnosis. Formally, the diagnoses are not pathologically confirmed or supported by specific biomarkers of pathology, but it has been shown that this diagnostic method is highly predictive using MRI scans21 and subsequent post-mortem classification75. In addition, all disease categories, and conversion to dementia from MCI, were diagnosed by an experienced clinician according to criteria as described below. Briefly, the inclusion and exclusion criteria for study groups were as follows. Inclusion criteria for AD study group: (1) ADRDA/NINCDS and DSM-IV criteria for probable Alzheimer’s disease; (2) mini Mental State Examination score ranged from 12 to 28; (3) age 65 years or above. Inclusion criteria for MCI and CTL study groups: (1) mini Mental State Examination score range between 24 and 30; (2) geriatric Depression Scale score less than or equal to 5; (3) age 65 years or above; (4) medication stable; (5) good general health. The distinction between MCI and controls was based on two criteria: (1) subject scores 0 on Clinical Dementia Rating Scale = control; (2) Subject scores 0.5 on Clinical Dementia Rating scale = MCI. For the MCI subjects it was preferable that the subject and informant reported occurrence of memory problems. All AD subjects had a CDR score of 0.5 or above. The distinction between cMCI (converted MCI) and sMCI (stable MCI): based on follow-up interviews and tests. Exclusion criteria (all study groups): (1) significant neurological or psychiatric illness other than AD; (2) significant unstable systematic illness or organ failure; (3) alcohol or substance misuse.
All samples were collected under human participant research protocols, including informed consent containing the clause necessary for allowing bio-specimens and data sharing abroad. Blood and urine were collected at baseline and stored at . Genetic data from blood samples were obtained using the Illumina 610-Quad chip in two different batches as previously described24, while the third batch was obtained using HumanOmniExpress 24 v1.1. For this study morning (non-first void) urine samples were collected at baseline assessment and were subjected to metabolic profiling analysis via UHLC-MS and by 1H NMR spectroscopy (561 and 575 samples respectively) (Table 1).
1H NMR metabolic phenotyping
Samples were analyzed by 1H-NMR spectroscopy in-line with previously published standard protocols for the study of human urine samples76. In brief, samples were prepared using a Gilson 215 liquid handling robot and transferred to 4 in. length 5 mm outer diameter NMR tubes in batches of 80 patient samples and four QC pooled samples. Racks of 96 prepared NMR tubes were transferred to a refrigerated SampleJet sample handler robot (Bruker Co) working at . One dimensional 1H-NMR general profile and two-dimensional J-resolved (Jres) experiments were acquired on a Bruker Avance III HD 600 spectrometer following the set up previously described76. Experiments were acquired and processed in automation using TopSpin 3.2 and ICON NMR. Phasing, baseline correction and calibration to TSP were also carried out in automation after each acquisition. Spectra quality was assessed using an in-house developed bioinformatics tool nPYc77 following the quality criteria previously described76.
UHPLC-MS metabolic phenotyping
UHPLC-MS analysis of urine samples was performed as previously described78 utilizing a combination of reversed-phase chromatography (RPC) and hydrophilic interaction chromatography (HILIC). UHPLC was performed using Waters Acquity UPLC systems (Waters Corp., Milford, MA, USA), coupled to Waters Xevo G2-S QTOF mass spectrometers (Waters Corp., Wilmslow, UK) via Z-spray electrospray ionization (ESI) sources. RPC separations were paired with both positive and negative ion mode detection (generating URPOS and URNEG datasets respectively), while the HILIC separation was paired with positive ion mode detection only (UHPOS). All UHPLC-MS datasets underwent feature extraction using Progenesis QI 2.1 software (Nonlinear Dynamics, Newcastle, UK) as previously described, and feature filtering was performed using previously described quality control materials78. Preprocessing including batch and run order correction was performed using an in-house developed bioinformatics tool nPYc77. Features were removed from the data sets where their analytical variation, assessed by repeated measurement of a pooled quality control sample (study reference), exceeded 30% (relative standard deviation) or where the analytical variation exceeded the total observed variation among all study samples. Features were also inspected for correlation between their observed intensity and sample dilution within a pooled QC dilution series and features with Pearson correlation coefficients less than 0.7 were removed.
Metabolic QTL mapping
The goal of QTL mapping is to identify associations between genetic markers and phenotypic variation79, in the case of metabolic QTL, the genome-wide contribution of individual alleles to a metabolic feature concentration27. The R package MatrixEQTL80 was used for QTL mapping by modelling the effect of genotype as additive linear including covariates to account for: age, sex, data collection centre and cohort. The null-hypothesis, “there is no QTL effect for the metabolic feature concentration”, was tested against the alternative, “there is QTL effect between SNP and metabolic feature concentration”, for each pair of metabolic feature and SNP. We corrected results for multiple comparisons by calculating q-value using the Benjamini–Hochberg procedure81. The number of metabolic features and SNPs found to be associated using stringent q-value threshold 0.01 is presented in Table 3.
Data preparation For mQTL analysis
UHPLC-MS metabolic datasets UHPOS, URPOS and URNEG were normalised with EigenMS method82 that removes bias of unknown complexity from this type of metabolomics experiment at the same time preserving known bias, diagnoses in the case of this study. Subsequently, both EigenMS processed UHPLC-MS data, and raw one-dimensional 1H NMR metabolic data were normalised using the quantile normalisation83 method to make metabolomics data suitable for the QTL mapping.
Imputation and quality control of genomics data
After quality control using PLINK84, genomics data from separate batches were assembled and remapped to “hg19-build37” reference genome. The imputation was performed with IMPUTE2 software85. Since SNPs with low minor allele frequency are non-informative and have a potential of creating spurious findings, the imputation results were converted into matrix form and filtered using minor allele frequency threshold 10%. The final genomics matrix includes 12,105,785 SNPs. The results of population stratification indicated biases by cohort and data collection centres (Supplementary materials Figures S1 and S2).
Model selection
We used the Random Forests algorithm86 to prioritise metabolic features that can potentially be used as Alzheimer’s disease biomarkers. The main focus of this study is on metabolic features. However, there are also 6923 SNPs that metabolic features are associated with and covariates available for the samples: age, gender and data collection centre. To find the best prediction model, we considered the following sets of features:
-
A.
Metabolic features only;
-
B.
Metabolic features and SNPs;
-
C.
Metabolic features, SNPs and covariates;
-
D.
Metabolic features and covariates.
As discussed earlier, we tested three different ways of classifying diagnostic groups: four original diagnostic categories (AD/CTL/cMCI/sMCI), binary over-sampling AD + cMCI/CTL + sMCI, and binary under-sampling AD/CTL by removing cMCI and sMCI data. We explored different classifications approaches and feature sets by using the R implementation of RF87,88 to find the best combination. As the comparison criteria, we used the Out-Of-Bag (OOB) errors which is a standard approach for Random Forests. OOB error is a method of measuring the prediction error utilising bootstrap aggregation to subsample data used for training. It helps to avoid the need for an independent validation dataset89. Results in the form of OOB errors of the RF models built for the different combinations of feature set and diagnostic groups are shown in Fig. 2. Each model was repeated ten times, using an increasing number of trees per run. The binary classification AD/CTL gives the best OOB errors for all four feature sets: the feature set A—0.0325, B—0.0404, C—0.0363 and D—0.0292, correspondingly. The feature set D, metabolic features and covariates, and binary classification AD/CTL, Alzheimer’s disease and healthy control samples only, after the tuning of RF parameters, gave the OOB predicted error 0.0241. The value of the area under the receiver operating characteristic curve (AUROC)90 for the model is 0.99 (Table 4 and Fig. 3). This model is our final RF model used in further analysis.
Tuning of random forests parameters
There are two parameters to tune for the RF algorithm: the number of trees used in the forest—ntree, and the number of variables used in each tree-mtry. We applied the alternating iterative procedure to find the best possible parameters values for ntree and mtry. The results plotted on Supplementary materials Figure S3 shows that with the ntree value equal to 680 the out-of-bag error rate stabilises and reaches its minimum 0.0254 with standard deviation 0.0056. The best mtry value we found is 90 (Supplementary materials Figure S4). It gives minimal OOB error rate 0.0241 with standard deviation equals to 0.0046.
Ranking of metabolic features
We ranked metabolic features using the permutation importance score obtained from the final RF model. This score is based on the idea that if the feature is not essential, then rearranging the values of that variable does not degrade classification accuracy. The list of ranked metabolic features with calculated permutation importance score and added metabolite annotations are presented in the Supplementary materials Table S3.
Metabolite annotation
For metabolite identification features of interest derived from the UHPLC-MS datasets first underwent correlation analysis using an R script developed in-house. This enabled the observation of co-eluting adducts and in-source fragments that are characteristic of metabolites. Further structural data were obtained via the use of high-resolution accurate mass to charge ratio (m/z) values and collision-induced dissociation (CID) fragmentation patterns. CID experiments were completed at a range of collision voltages at 5 V step intervals (5–45 V). The front quadrupole of the QTOF MS system was engaged to select for the feature of interest prior to CID. Chromatographic retention time matching to in-house standards was also completed where the standard was available for purchase. Online databases such as METLIN91, and the Human Metabolome Database (HMDB)92 were also used to assist with metabolite identification. Where available, analytical standards were purchased and spiked into representative samples to increase confidence in the annotation.
Tentative annotation of features of interest derived from 1H NMR analysis was completed by searching on literature and using in-house databases to match possible patterns of interest with the relevant spectra of standard compounds. The multiplicity of the signals of interest was confirmed using the corresponding Jres spectrum and a cassette of 2D spectra of representative samples including 1H,1H-COSY, 1H,1H-TOCSY, 1H,13C-HSQC.
Supplementary information
Acknowledgements
The work was supported by the Innovative Medicines Initiative (IMI) Joint Undertaking under EMIF Grant agreement No. 115372, resources of which are composed of financial contribution from the European Union’s Seventh Framework Programme (FP7/2007-2013) and EFPIA companies’ in kind contribution, and by the Medical Research Council and National Institute for Health Research [Grant number MC_PC_12025], and infrastructure support was provided by the National Institute for Health Research (NIHR) Imperial Biomedical Research Centre (BRC). AddNeuroMed was a pilot project for the Innovative Medicines Initiative funded through the EU FP6 programme. The UK Dementia Research Institute (DRI) is an initiative funded by the Medical Council, Alzheimer’s Society and Alzheimer’s Research UK. The views expressed are those of the authors and not necessarily those of the NHS, the NIHR or the Department of Health or other funders. We thank Dr Aditya Nori and Laurence G. Bourn from Microsoft Research Lab Cambridge for advising in machine learning algorithms. Hilkka Soininen, Iwona Kloszewska, Patrizia Mecocci, Magda Tsolaki, Bruno Vellas, Dag Aarsland, Simon Lovestone—on behalf of AddNeuroMed consortium.
Author contributions
The study was conceived and designed by S.L., E.H. and J.K.N. carried out the metabolic profiling design, N.K. designed the analytical pipeline; experimental NMR profiling assays were carried out by B.J., UPLC-MS analysis was conducted by M.G.R., E.C., L.W. and M.R.L., Statistical analysis of the metabolomic data was carried out by T.K., J.P., A.N.H. and A.H.; Data integration and analysis was undertaken by N.K. M.G. repeated the analysis with updated inputs. Interpretation of the metabolomics data was carried out by E.H., J.K.N., L.W., S.S. and C.L.Q. A literature search and linkage of annotated metabolites to AD pathology was done by N.K. in conjunction with S.L. The manuscript was written by N.K. and S.L. in conjunction with A.B., M.G., L.W. All authors reviewed the manuscript.
Funding
Open Access funding enabled and organized by Projekt DEAL.
Data availability
Genomics data in European Nucleotide Archive PRJNA266531.
Code availability
Competing interests
The authors declare no competing interests.
Footnotes
Publisher's note
Springer Nature remains neutral with regard to jurisdictional claims in published maps and institutional affiliations.
Supplementary information
is available for this paper at 10.1038/s41598-020-78031-9.
References
- 1.Hampel H, et al. Perspective on future role of biological markers in clinical therapy trials of Alzheimer’s disease: A long-range point of view beyond 2020. Biochem. Pharmacol. 2014;88:426–449. doi: 10.1016/j.bcp.2013.11.009. [DOI] [PubMed] [Google Scholar]
- 2.Blennow K, Hampel H, Zetterberg H. Biomarkers in Amyloid- immunotherapy trials in Alzheimer’s disease. Neuropsychopharmacology. 2014;39:189–201. doi: 10.1038/npp.2013.154. [DOI] [PMC free article] [PubMed] [Google Scholar]
- 3.Lista S, et al. CSF A 1–42 combined with neuroimaging biomarkers in the early detection, diagnosis and prediction of Alzheimer’s disease. Alzheimer’s Dementia. 2014;10:381–392. doi: 10.1016/j.jalz.2013.04.506. [DOI] [PubMed] [Google Scholar]
- 4.O’Bryant SE, et al. Blood-based biomarkers in Alzheimer disease: Current state of the science and a novel collaborative paradigm for advancing from discovery to clinic. Alzheimer’s Dementia J. Alzheimer’s Assoc. 2017;13:45–58. doi: 10.1016/j.jalz.2016.09.014. [DOI] [PMC free article] [PubMed] [Google Scholar]
- 5.Olsson B, et al. CSF and blood biomarkers for the diagnosis of Alzheimer’s disease: A systematic review and meta-analysis. Lancet Neurol. 2016;15:673–684. doi: 10.1016/S1474-4422(16)00070-3. [DOI] [PubMed] [Google Scholar]
- 6.Ashton NJ, et al. Increased plasma neurofilament light chain concentration correlates with severity of post-mortem neurofibrillary tangle pathology and neurodegeneration. Acta Neuropathol. Commun. 2019;7:5. doi: 10.1186/s40478-018-0649-3. [DOI] [PMC free article] [PubMed] [Google Scholar]
- 7.Wang C. Combining serum and urine biomarkers in the early diagnosis of mild cognitive impairment that evolves into Alzheimer’s disease in patients with the apolipoprotein E 4 genotype. Biomarkers Biochem. Indicators Exposure Response Suscept. Chem. 2015;20:84–88. doi: 10.3109/1354750X.2014.994036. [DOI] [PubMed] [Google Scholar]
- 8.Ma L, et al. The level of Alzheimer-associated neuronal thread protein in urine may be an important biomarker of mild cognitive impairment. J. Clin. Neurosci. Off. J. Neurosurg. Soc. Aust. 2015;22:649–652. doi: 10.1016/j.jocn.2014.10.011. [DOI] [PubMed] [Google Scholar]
- 9.Igarashi K, Yoshida M, Waragai M, Kashiwagi K. Evaluation of dementia by acrolein, amyloid- and creatinine. Clin. Chim. Acta Int. J. Clin. Chem. 2015;450:56–63. doi: 10.1016/j.cca.2015.07.017. [DOI] [PubMed] [Google Scholar]
- 10.Zengi O, et al. Urinary 8-hydroxy-2’-deoxyguanosine level and plasma paraoxonase 1 activity with Alzheimer’s disease. Clin. Chem. Lab. Med. 2011;50:529–534. doi: 10.1515/CCLM.2011.792. [DOI] [PubMed] [Google Scholar]
- 11.Lindsay A, Costello JT. Realising the potential of urine and saliva as diagnostic tools in sport and exercise medicine. Sports Med. (Auckland, N.Z.) 2017;47:11–31. doi: 10.1007/s40279-016-0558-1. [DOI] [PubMed] [Google Scholar]
- 12.Roszkowski K. Oxidative DNA damage-the possible use of biomarkers as additional prognostic factors in oncology. Front. Biosci. (Landmark Edn.) 2014;19:808–817. doi: 10.2741/4248. [DOI] [PubMed] [Google Scholar]
- 13.An M, Gao Y. Urinary biomarkers of brain diseases. Genom. Proteom. Bioinform. 2015;13:345–354. doi: 10.1016/j.gpb.2015.08.005. [DOI] [PMC free article] [PubMed] [Google Scholar]
- 14.Nicholson JK, et al. Host-gut microbiota metabolic interactions. Science. 2012;336:1262–1267. doi: 10.1126/science.1223813. [DOI] [PubMed] [Google Scholar]
- 15.Vogt NM, et al. Gut microbiome alterations in Alzheimer’s disease. Sci. Rep. 2017;7:1–11. doi: 10.1038/s41598-017-13601-y. [DOI] [PMC free article] [PubMed] [Google Scholar]
- 16.Giau VV, et al. Gut microbiota and their neuroinflammatory implications in Alzheimer’s disease. Nutrients. 2018;10:1765. doi: 10.3390/nu10111765. [DOI] [PMC free article] [PubMed] [Google Scholar]
- 17.Kimball BA, Wilson DA, Wesson DW. Alterations of the volatile metabolome in mouse models of Alzheimer’s disease. Sci. Rep. 2016;6:19495. doi: 10.1038/srep19495. [DOI] [PMC free article] [PubMed] [Google Scholar]
- 18.Peng J, et al. Development of isotope labeling liquid chromatography mass spectrometry for mouse urine metabolomics: Quantitative metabolomic study of transgenic mice related to Alzheimer’s disease. J. Proteome Res. 2014;13:4457–4469. doi: 10.1021/pr500828v. [DOI] [PubMed] [Google Scholar]
- 19.Fukuhara K, et al. NMR-based metabolomics of urine in a mouse model of Alzheimer’s disease: Identification of oxidative stress biomarkers. J. Clin. Biochem. Nutr. 2013;52:133–138. doi: 10.3164/jcbn.12-118. [DOI] [PMC free article] [PubMed] [Google Scholar]
- 20.Yu J, et al. High-throughput metabolomics for discovering potential metabolite biomarkers and metabolic mechanism from the APPswe/PS1dE9 transgenic model of Alzheimer’s disease. J. Proteome Res. 2017;16:3219–3228. doi: 10.1021/acs.jproteome.7b00206. [DOI] [PubMed] [Google Scholar]
- 21.Simmons A, et al. MRI measures of Alzheimer’s disease and the AddNeuroMed study. Ann. N. Y. Acad. Sci. 2009;1180:47–55. doi: 10.1111/j.1749-6632.2009.05063.x. [DOI] [PubMed] [Google Scholar]
- 22.Lovestone S, et al. AddNeuroMed-the European collaboration for the discovery of novel biomarkers for Alzheimer’s disease. Ann. N. Y. Acad. Sci. 2009;1180:36–46. doi: 10.1111/j.1749-6632.2009.05064.x. [DOI] [PubMed] [Google Scholar]
- 23.Hye A, et al. Proteome-based plasma biomarkers for Alzheimer’s disease. Brain J. Neurol. 2006;129:3042–3050. doi: 10.1093/brain/awl279. [DOI] [PubMed] [Google Scholar]
- 24.Proitsi P, et al. Genetic predisposition to increased blood cholesterol and triglyceride lipid levels and risk of Alzheimer disease: A mendelian randomization analysis. PLoS Med. 2014;11:e1001713. doi: 10.1371/journal.pmed.1001713. [DOI] [PMC free article] [PubMed] [Google Scholar]
- 25.Robinette SL, Dumas ME. Genetic determinants of metabolism in health and disease: From biochemical genetics to genome-wide associations. Genome Med. 2012 doi: 10.1186/gm329. [DOI] [PMC free article] [PubMed] [Google Scholar]
- 26.Suhre K, et al. A genome-wide association study of metabolic traits in human urine. Nat. Genet. 2011;43:565–569. doi: 10.1038/ng.837. [DOI] [PubMed] [Google Scholar]
- 27.Nicholson G, et al. A genome-wide metabolic QTL analysis in Europeans implicates two loci shaped by recent positive selection. PLoS Genet. 2011;7:e1002270. doi: 10.1371/journal.pgen.1002270. [DOI] [PMC free article] [PubMed] [Google Scholar]
- 28.Rueedi R, et al. Genome-wide association study of metabolic traits reveals novel gene-metabolite-disease links. PLoS Genet. 2014;10:e1004132. doi: 10.1371/journal.pgen.1004132. [DOI] [PMC free article] [PubMed] [Google Scholar]
- 29.Raffler J, et al. Genome-wide association study with targeted and non-targeted NMR metabolomics identifies 15 novel loci of urinary human metabolic individuality. PLoS Genet. 2015;11:e1005487. doi: 10.1371/journal.pgen.1005487. [DOI] [PMC free article] [PubMed] [Google Scholar]
- 30.Paterson AD, et al. Genome-wide association identifies the ABO blood group as a major locus associated with serum levels of soluble E-selectin. Arteriosclerosis Thromb. Vasc. Biol. 2009;29:1958–1967. doi: 10.1161/ATVBAHA.109.192971. [DOI] [PMC free article] [PubMed] [Google Scholar]
- 31.Whiley L, et al. Systematic isolation and structure elucidation of urinary metabolites optimized for the analytical-scale molecular profiling laboratory. Analyt. Chem. 2019;91:8873–8882. doi: 10.1021/acs.analchem.9b00241. [DOI] [PMC free article] [PubMed] [Google Scholar]
- 32.Chaleckis R, Meister I, Zhang P, Wheelock CE. Challenges, progress and promises of metabolite annotation for LC–MS-based metabolomics. Curr. Opin. Biotechnol. 2019;55:44–50. doi: 10.1016/j.copbio.2018.07.010. [DOI] [PubMed] [Google Scholar]
- 33.Reitz C, et al. Independent and epistatic effects of variants in VPS10-d receptors on Alzheimer disease risk and processing of the amyloid precursor protein (APP) Transl. Psychiatry. 2013;3:e256. doi: 10.1038/tp.2013.13. [DOI] [PMC free article] [PubMed] [Google Scholar]
- 34.Reitz C. The role of intracellular trafficking and the VPS10d receptors in Alzheimer’s disease. Future Neurol. 2012;7:423–431. doi: 10.2217/fnl.12.31. [DOI] [PMC free article] [PubMed] [Google Scholar]
- 35.Lane RF, et al. Vps10 family proteins and the retromer complex in aging-related neurodegeneration and diabetes. J. Neurosci. 2012;32:14080–14086. doi: 10.1523/JNEUROSCI.3359-12.2012. [DOI] [PMC free article] [PubMed] [Google Scholar]
- 36.Campion D, Charbonnier C, Nicolas G. SORL1 genetic variants and Alzheimer disease risk: A literature review and meta-analysis of sequencing data. Acta Neuropathol. 2019;138:173–186. doi: 10.1007/s00401-019-01991-4. [DOI] [PubMed] [Google Scholar]
- 37.Mez J, et al. Two novel loci, COBL and SLC10a2, for Alzheimer’s disease in African Americans. Alzheimer’s Dementia J. Alzheimer’s Assoc. 2017;13:119–129. doi: 10.1016/j.jalz.2016.09.002. [DOI] [PMC free article] [PubMed] [Google Scholar]
- 38.Estep JA, Wong W, Wong Y-CE, Loui BM, Riccomagno MM. The RacGAP -Chimaerin is essential for cerebellar granule cell migration. Sci. Rep. 2018 doi: 10.1038/s41598-017-19116-w. [DOI] [PMC free article] [PubMed] [Google Scholar]
- 39.Borin M, et al. Rac1 activation links tau hyperphosphorylation and a dysmetabolism in Alzheimer’s disease. Acta Neuropathol. Commun. 2018;6:61. doi: 10.1186/s40478-018-0567-4. [DOI] [PMC free article] [PubMed] [Google Scholar]
- 40.Newton JL, et al. Functional capacity is significantly impaired in primary biliary cirrhosis and is related to orthostatic symptoms. Eur. J. Gastroenterol. Hepatol. 2011;23:566–572. doi: 10.1097/MEG.0b013e3283470256. [DOI] [PubMed] [Google Scholar]
- 41.Newton JL, et al. Cognitive impairment in primary biliary cirrhosis: Symptom impact and potential etiology. Hepatology. 2008;48:541–549. doi: 10.1002/hep.22371. [DOI] [PubMed] [Google Scholar]
- 42.Dastgheib M, Dehpour AR, Heidari M, Moezi L. The effects of intra-dorsal hippocampus infusion of pregnenolone sulfate on memory function and hippocampal BDNF mRNA expression of biliary cirrhosis-induced memory impairment in rats. Neuroscience. 2015;306:1–9. doi: 10.1016/j.neuroscience.2015.08.018. [DOI] [PubMed] [Google Scholar]
- 43.Ruiz JC, Bruick RK. F-box and leucine-rich repeat protein 5 (FBXL5): Sensing intracellular iron and oxygen. J. Inorg. Biochem. 2014;133:73–77. doi: 10.1016/j.jinorgbio.2014.01.015. [DOI] [PMC free article] [PubMed] [Google Scholar]
- 44.Horowitz MP, Greenamyre JT. Mitochondrial iron metabolism and its role in neurodegeneration. J. Alzheimer’s Dis. JAD. 2010;20(Suppl 2):S551–568. doi: 10.3233/JAD-2010-100354. [DOI] [PMC free article] [PubMed] [Google Scholar]
- 45.Miyashita A, et al. Genes associated with the progression of neurofibrillary tangles in Alzheimer’s disease. Transl. Psychiatry. 2014;4:e396. doi: 10.1038/tp.2014.35. [DOI] [PMC free article] [PubMed] [Google Scholar]
- 46.Castillo E, et al. Comparative profiling of cortical gene expression in Alzheimer’s disease patients and mouse models demonstrates a link between amyloidosis and neuroinflammation. Sci. Rep. 2017;7:17762. doi: 10.1038/s41598-017-17999-3. [DOI] [PMC free article] [PubMed] [Google Scholar]
- 47.Öhrfelt A, et al. The pre-synaptic vesicle protein synaptotagmin is a novel biomarker for Alzheimer’s disease. Alzheimer’s Res. Ther. 2016;8:41. doi: 10.1186/s13195-016-0208-8. [DOI] [PMC free article] [PubMed] [Google Scholar]
- 48.Buniello A, et al. The NHGRI-EBI GWAS catalog of published genome-wide association studies, targeted arrays and summary statistics 2019. Nucleic Acids Res. 2019;47:D1005–D1012. doi: 10.1093/nar/gky1120. [DOI] [PMC free article] [PubMed] [Google Scholar]
- 49.Meng LJ, Griffiths WJ, Sjövall J. The identification of novel steroid N-acetylglucosaminides in the urine of pregnant women. J. Steroid Biochem. Mol. Biol. 1996;58:585–598. doi: 10.1016/0960-0760(96)00080-5. [DOI] [PubMed] [Google Scholar]
- 50.Marschall HU, et al. Bile acid n-acetylglucosaminidation. in vivo and in vitro evidence for a selective conjugation reaction of 7 beta-hydroxylated bile acids in humans. J. Clin. Invest. 1992;89:1981–1987. doi: 10.1172/JCI115806. [DOI] [PMC free article] [PubMed] [Google Scholar]
- 51.Mapstone M, et al. Plasma phospholipids identify antecedent memory impairment in older adults. Nat. Med. 2014;20:415–418. doi: 10.1038/nm.3466. [DOI] [PMC free article] [PubMed] [Google Scholar]
- 52.Fiandaca MS, et al. Plasma 24-metabolite panel predicts preclinical transition to clinical stages of Alzheimer’s disease. Front. Neurol. 2015 doi: 10.3389/fneur.2015.00237. [DOI] [PMC free article] [PubMed] [Google Scholar]
- 53.de Leeuw FA, et al. Blood-based metabolic signatures in Alzheimer’s disease. Alzheimer’s Dementia Diag. Assess. Disease Monit. 2017;8:196–207. doi: 10.1016/j.dadm.2017.07.006. [DOI] [PMC free article] [PubMed] [Google Scholar]
- 54.Voyle N, et al. Blood metabolite markers of neocortical amyloid- burden: Discovery and enrichment using candidate proteins. Transl. Psychiatry. 2016;6:e719–e719. doi: 10.1038/tp.2015.205. [DOI] [PMC free article] [PubMed] [Google Scholar]
- 55.Casanova R, et al. Blood metabolite markers of preclinical Alzheimer’s disease in two longitudinally followed cohorts of older individuals. Alzheimer’s Dementia J. Alzheimer’s Assoc. 2016;12:815–822. doi: 10.1016/j.jalz.2015.12.008. [DOI] [PMC free article] [PubMed] [Google Scholar]
- 56.An Y, et al. Evidence for brain glucose dysregulation in Alzheimer’s disease. Alzheimer’s Dementia. 2018;14:318–329. doi: 10.1016/j.jalz.2017.09.011. [DOI] [PMC free article] [PubMed] [Google Scholar]
- 57.Proitsi P, et al. Association of blood lipids with Alzheimer’s disease: A comprehensive lipidomics analysis. Alzheimer’s Dementia. 2017;13:140–151. doi: 10.1016/j.jalz.2016.08.003. [DOI] [PubMed] [Google Scholar]
- 58.Pan X, et al. Metabolomic profiling of bile acids in clinical and experimental samples of Alzheimer’s disease. Metabolites. 2017;7:28. doi: 10.3390/metabo7020028. [DOI] [PMC free article] [PubMed] [Google Scholar]
- 59.Han X, et al. Metabolomics in early Alzheimer’s disease: Identification of altered plasma sphingolipidome using shotgun lipidomics. PLOS ONE. 2011;6:e21643. doi: 10.1371/journal.pone.0021643. [DOI] [PMC free article] [PubMed] [Google Scholar]
- 60.Mayo W, Le Moal M, Abrous DN. Pregnenolone sulfate and aging of cognitive functions: Behavioral, neurochemical, and morphological investigations. Hormones Behav. 2001;40:215–217. doi: 10.1006/hbeh.2001.1677. [DOI] [PubMed] [Google Scholar]
- 61.Rajagopal L, Soni D, Meltzer HY. Neurosteroid pregnenolone sulfate, alone, and as augmentation of lurasidone or tandospirone, rescues phencyclidine-induced deficits in cognitive function and social interaction. Behav. Brain Res. 2018;350:31–43. doi: 10.1016/j.bbr.2018.05.005. [DOI] [PubMed] [Google Scholar]
- 62.Romanoff LP, Thomas AW, Baxter MN. Effect of age on pregnanediol excretion by men. J. Gerontol. 1970;25:98–101. doi: 10.1093/geronj/25.2.98. [DOI] [PubMed] [Google Scholar]
- 63.Marksteiner J, Blasko I, Kemmler G, Koal T, Humpel C. Bile acid quantification of 20 plasma metabolites identifies lithocholic acid as a putative biomarker in Alzheimer’s disease. Metabolomics. 2018 doi: 10.1007/s11306-017-1297-5. [DOI] [PMC free article] [PubMed] [Google Scholar]
- 64.Wang Y, et al. Bile acids regulate cysteine catabolism and glutathione regeneration to modulate hepatic sensitivity to oxidative injury. JCI Insight. 2018;3(8):e99676. doi: 10.1172/jci.insight.99676. [DOI] [PMC free article] [PubMed] [Google Scholar]
- 65.MahmoudianDehkordi S, et al. Altered bile acid profile associates with cognitive impairment in Alzheimer’s disease-an emerging role for gut microbiome. Alzheimer’s Dementia J. Alzheimer’s Assoc. 2019;15:76–92. doi: 10.1016/j.jalz.2018.07.217. [DOI] [PMC free article] [PubMed] [Google Scholar]
- 66.Carvalho C, et al. Metabolic alterations induced by sucrose intake and Alzheimer’s disease promote similar brain mitochondrial abnormalities. Diabetes. 2012;61:1234–1242. doi: 10.2337/db11-1186. [DOI] [PMC free article] [PubMed] [Google Scholar]
- 67.Hua X, et al. Long-term d-galactose injection combined with ovariectomy serves as a new rodent model for Alzheimer’s disease. Life Sci. 2007;80:1897–1905. doi: 10.1016/j.lfs.2007.02.030. [DOI] [PubMed] [Google Scholar]
- 68.Joseph Loscalzo. Lipid metabolism by gut microbes and atherosclerosis. Circ. Res. 2011;109:127–129. doi: 10.1161/RES.0b013e3182290620. [DOI] [PubMed] [Google Scholar]
- 69.Aslibekyan S, et al. Genome- and CD4+ T-cell methylome-wide association study of circulating trimethylamine-N-oxide in the genetics of lipid lowering drugs and diet network (GOLDN) J. Nutr. Intermediary Metab. 2017;8:1–7. doi: 10.1016/j.jnim.2017.03.002. [DOI] [PMC free article] [PubMed] [Google Scholar]
- 70.Velenosi TJ, et al. Untargeted metabolomics reveals N,N,N-trimethyl-l-alanyl-l-proline betaine (TMAP) as a novel biomarker of kidney function. Sci. Rep. 2019;9:1–13. doi: 10.1038/s41598-019-42992-3. [DOI] [PMC free article] [PubMed] [Google Scholar]
- 71.Dong Y, Brewer GJ. Global metabolic shifts in age and Alzheimer’s disease mouse brains pivot at NAD+/NADH redox sites. J. Alzheimer’s Dis. 2019;71:119–140. doi: 10.3233/JAD-190408. [DOI] [PMC free article] [PubMed] [Google Scholar]
- 72.Ellison EM, Abner EL, Lovell MA. Multiregional analysis of global 5-methylcytosine and 5-hydroxymethylcytosine throughout the progression of Alzheimer’s disease. J. Neurochem. 2017;140:383–394. doi: 10.1111/jnc.13912. [DOI] [PMC free article] [PubMed] [Google Scholar]
- 73.Fitzgerald BL, et al. Elucidating the structure of N1-acetylisoputreanine: A novel polyamine catabolite in human urine. ACS Omega. 2017;2:3921–3930. doi: 10.1021/acsomega.7b00872. [DOI] [PMC free article] [PubMed] [Google Scholar]
- 74.Inoue K, et al. Metabolic profiling of Alzheimer’s disease brains. Sci. Rep. 2013;3:1–9. doi: 10.1038/srep02364. [DOI] [PMC free article] [PubMed] [Google Scholar]
- 75.Foy CML, et al. Diagnosing Alzheimer’s disease-non-clinicians and computerised algorithms together are as accurate as the best clinical practice. Int. J. Geriatric Psychiatry. 2007;22:1154–1163. doi: 10.1002/gps.1810. [DOI] [PubMed] [Google Scholar]
- 76.Dona AC, et al. Precision high-throughput proton NMR spectroscopy of human urine, serum, and plasma for large-scale metabolic phenotyping. Analyt. Chem. 2014;86:9887–9894. doi: 10.1021/ac5025039. [DOI] [PubMed] [Google Scholar]
- 77.Sands CJ, et al. The nPYc-toolbox, a python module for the pre-processing, quality-control and analysis of metabolic profiling datasets. Bioinformatics. 2019;35:5359–5360. doi: 10.1093/bioinformatics/btz566. [DOI] [PMC free article] [PubMed] [Google Scholar]
- 78.Lewis MR, et al. Development and application of ultra-performance liquid chromatography-TOF MS for precision large scale urinary metabolic phenotyping. Analyt. Chem. 2016;88:9004–9013. doi: 10.1021/acs.analchem.6b01481. [DOI] [PubMed] [Google Scholar]
- 79.Miles, C. M. & Wayne, M. Quantitative trait locus (QTL) analysis. Nat. Educ.1, (2008).
- 80.Shabalin AA. Matrix eQTL: Ultra fast eQTL analysis via large matrix operations. Bioinformatics. 2012;28:1353–1358. doi: 10.1093/bioinformatics/bts163. [DOI] [PMC free article] [PubMed] [Google Scholar]
- 81.Benjamini Y, Hochberg Y. Controlling the false discovery rate: A practical and powerful approach to multiple testing. J. R. Stat. Soc. Series B (Methodol.) 1995;57:289–300. doi: 10.1111/j.2517-6161.1995.tb02031.x. [DOI] [Google Scholar]
- 82.Karpievitch YV, Nikolic SB, Wilson R, Sharman JE, Edwards LM. Metabolomics data normalization with EigenMS. PLoS One. 2014;9:e116221. doi: 10.1371/journal.pone.0116221. [DOI] [PMC free article] [PubMed] [Google Scholar]
- 83.Bolstad BM, Irizarry RA, Astrand M, Speed TP. A comparison of normalization methods for high density oligonucleotide array data based on variance and bias. Bioinformatics. 2003;19:185–193. doi: 10.1093/bioinformatics/19.2.185. [DOI] [PubMed] [Google Scholar]
- 84.Purcell S, et al. PLINK: A toolset for whole-genome association and population-based linkage analysis. Am. J. Hum. Genet. 2007;81:559–575. doi: 10.1086/519795. [DOI] [PMC free article] [PubMed] [Google Scholar]
- 85.Howie B, Marchini J, Stephens M. Genotype imputation with thousands of genomes. G3 Genet. Genes Genom. 2011;1:457–470. doi: 10.1534/g3.111.001198. [DOI] [PMC free article] [PubMed] [Google Scholar]
- 86.Breiman L. Random forests. Mach. Learn. 2001;45:5–32. doi: 10.1023/A:1010933404324. [DOI] [Google Scholar]
- 87.Ho, T. K. Random decision forests. in Proceedings of the 3rd International Conference on Document Analysis and Recognition, Montreal, QC 278–282. 10.1109/ICDAR.1995.598994 (1995).
- 88.Ho TK. The random subspace method for constructing decision forests. IEEE Trans. Pattern Anal. Mach. Intell. 1998;20:832–844. doi: 10.1109/34.709601. [DOI] [Google Scholar]
- 89.Gareth J, Witten D, Hastie T, Tibshirani R. Introduction to Statistical Learning. New York: Springer; 2013. [Google Scholar]
- 90.Fawcett T. An introduction to ROC analysis. Pattern Recognit. Lett. 2006;27:861–874. doi: 10.1016/j.patrec.2005.10.010. [DOI] [Google Scholar]
- 91.Smith C, et al. METLIN: A metabolite mass spectral database. Therap. Drug Monit. 2005;27:747–751. doi: 10.1097/01.ftd.0000179845.53213.39. [DOI] [PubMed] [Google Scholar]
- 92.Wishart DS, et al. HMDB: The human metabolome database. Nucleic Acids Res. 2007;35:D521–D526. doi: 10.1093/nar/gkl923. [DOI] [PMC free article] [PubMed] [Google Scholar]
Associated Data
This section collects any data citations, data availability statements, or supplementary materials included in this article.
Supplementary Materials
Data Availability Statement
Genomics data in European Nucleotide Archive PRJNA266531.