Abstract
Background
Osteosarcoma (OS) is very common worldwide, and the mechanisms underlying its development remain unclear. This study aims to identify key genes promoting the reproduction, invasion, and transfer of osteosarcoma cells.
Material/Methods
Gene expression profile data (GSE42352 and GSE42572) were downloaded from the Gene Expression Omnibus database. Differentially expressed genes were calculated using R software. Gene ontology and enriched pathway analysis of mRNAs were analyzed by using FunRich. Verification of the genes was conducted by using quantitative real-time polymerase chain reaction and western blot analyses to measure gene expression. Transwell and wound-healing assays were performed on osteosarcoma cells after knockdown to detect whether the genes enhanced the aggressiveness of osteosarcoma.
Results
In total, 34 genes were selected after filtering. Kyoto Encyclopedia of Genes and Genomes enrichment analysis demonstrated that the genes were enriched in multiple tumor pathways. N-acetylgalactosaminyltransferase 1 (GALNT1) was identified for further study, and its expression was higher in osteosarcoma cells than in human osteoblasts. The invasion ability of cells was significantly decreased after gene knockdown.
Conclusions
Through the use of microarray and bioinformatics analysis, differentially expressed genes were selected and a complete gene network was constructed. Our findings provide new biomarkers for the treatment and prognosis of osteosarcoma. These biomarkers may contribute to the discovery of new therapeutic targets for clinical application.
MeSH Keywords: Genes, vif; Medical Oncology; Osteosarcoma
Background
Osteosarcoma (OS) is the most common primary malignant bone tumor in children and adolescents [1]. It usually occurs in rapidly growing bone such as the distal femur, proximal tibia, or humerus. In addition, it is a highly aggressive malignancy that often metastasizes to the lungs and other organs [2]. With the use of adjuvant chemotherapy, the long-term survival rate of individuals with OS has gradually increased from less than 20% to about 65–70% in recent years, but some patients are still at risk of amputation or death [3]. Further, the toxicity of some chemotherapy drugs is unavoidable, which causes adverse effects for patients. With the rapid development of high-throughput sequencing technology and improved data analysis techniques, it has become easier to find important genes related to cancer [4]. The purpose of this study was to investigate the biological significance of certain genes in the prognosis of OS.
N-acetylgalactosaminyltransferase 1 (GALNT1) is a member of a large family of Golgi resident polypeptide N-acetylgalactosamine (GalNAc)-transferases (GALNT). It regulates mucin-type O-glycosylation according to transfer of α-GalNAc from UDP-GalNAc to Ser or Thr residues of proteins [5,6]. Previous studies reported that GALNT1 is highly expressed in a variety of tumors, promotes tumor growth and metastasis, and is associated with poor prognosis of tumors [5], including hepatocellular carcinoma [7], gastric cancer [8,9], renal cell carcinoma [10], and breast cancer [11]. However, the role of GALNT1 in OS has not been explored, and it is unknown whether it is similar to that in other cancers.
In this study, we analyzed the differentially expressed genes (DEGs) in OS and normal osteoblasts (hFOB1.19) through a bioinformatics analysis. In addition, we used quantitative real-time polymerase chain reaction (qRT-PCR), western blot, functional experiment, and other experiments to prove that GALNT1 is overexpressed in OS and promotes its invasion. We found that high expression of GALNT1 may be associated with poor prognosis in patients with OS.
Material and Methods
Microarray data
The Gene Expression Omnibus (GEO; https://www.ncbi.nlm.nih.gov/gds) database is a gene expression database created and maintained by the National Center for Biotechnology Information (NCBI). It was founded in 2000 and contains high-throughput gene expression data submitted by research institutions around the world. We downloaded gene expression profile data (GSE42352 and GSE42572) from GEO. Dataset GSE42352 included 25 samples from healthy donors and 25 samples from patients with OS. Gene expression profiling analysis of these samples was performed on Illumina human-6 v2.0 expression beadchip (using nuIDs as identifier) (GPL10295). Dataset GSE42572 was processed by Illumina HumanWG-6 v2.0 expression beadchip (GPL13376). Mesenchymal stromal cells were harvested from the iliac crest of 5 healthy donors and 7 OS patients at diagnosis and cultured until passages 2–5, after which cells were harvested and total RNA was isolated.
Functional and pathway enrichment analysis
FunRich (http://www.funrich.org) is publicly accessible software that enables identifying enriched transcription factors and performing Gene Ontology (GO) functional analysis of uploaded DEGs. Kyoto Encyclopedia of Genes and Genomes (KEGG) enrichment analysis was performed by using Cytoscape software. ClueGO is a Cytoscape plug-in that visualizes the nonredundant biological terms for large clusters of genes in a functionally grouped network. The network graph of ClueGO is created based on kappa statistics. Each node in the graph represents a term. The connection between nodes reflects the correlation between terms, while the color of nodes reflects the enrichment and classification of the node (i.e., which functional group it belongs to).
DEGS analysis
We used R software to compare the 2 groups of samples. Furthermore, the absolute value of log2 fold change (|log2FC|) ≥2 and P<0.05 were set as the cutoff criteria. If the results met these criteria, they were considered to be statistically significant.
Protein–protein interaction network analysis
The protein–protein interaction (PPI) network, which provides information about the identified and predicted interactions between proteins, was performed by using String and Cytoscape software. DEGs were then entered into the String. Genes that scored >0.7 were considered significant. Then, the PPI network was constructed using Cytoscape.
Cell transfection
The sh-GALNT1 sequence was cloned into pLKO.1 vector, and the stable system with knockdown GALNT1 was constructed for the next experiment. The sequence of sh-GALNT1 was shRNA1 (5′-CAAGAAGUCUGAGAUCUGGA-3′) and shRNA2 (5′-CCUAAUGCUCAUCUAUGUUG-3′). GALNT1 siRNA was purchased from GenePharma Co. Ltd. (Suzhou, China). Lipofecmine 2000 and Lipofectamine® RNAiMAX were purchased from Thermo Fisher Scientific (Shanghai, China) and used as the transfection reagents according to the manufacturer’s instructions.
Quantitative real-time PCR
Total RNA was extracted from OS cell lines using TRIzol reagents (Invitrogen, Carlsbad, CA, USA) per the manufacturer’s instructions. The extracted RNA was reverse-transcribed into cDNA using a PrimeScript™ RT kit with gDNA Eraser (TaKaRa, China). We also performed qRT-PCR by using SYBR Select Master Mix for CFX (Invitrogen) and the CFX Connect Real-Time PCR System (BioRad) at 95°C for 15 s, followed by 40 cycles of 95°C for 5 s, and 60°C for 34 s. The 2−ΔΔCt method was used to analyze and process the recorded data. The primer pairs are shown in Table 1 [12]. GAPDH was used as the reference group to avoid errors caused by RNA quantitative error, sample adding error, uneven amplification efficiency in each PCR system, and temperature difference between wells.
Table 1.
The primers for quantitative real-time polymerase chain reaction, with GAPDH used as the control.
| Forward | Reverse | |
|---|---|---|
| GALNT1 | 5′-CGCTGCAATCCAGACAGTAA-3′ | 5′-TCCCAGATCCTGATCCAGAG-3′ |
| GAPDH | 5′-TGGTATCGTGGAAGGACTCATGAC-3 | 5′-ATGCCAGTGAGCTTCCCGTTCAGC-3 |
Cell culture and antibodies
The human OS cell lines (143B, U2OS, U2R, MG63) were provided by Professor Kang Tie Bang (Sun Yat-sen University Cancer Center, State Key Laboratory of Oncology in South China, Collaborative Innovation Center for Cancer Medicine, Guangzhou, China). All OS cells and hFOB1.19 cells were cultured in Dulbecco’s modified Eagle’s medium (DMEM; Thermo Fisher Scientific) supplemented with 10% fetal bovine serum (FBS; Gibco). All cells grew in a 37°C humidified incubator with 5% CO2. Anti-β-actin and anti-GALNT1 (rabbit) antibodies were purchased from Santa Cruz Biotechnology (New York, USA).
Transwell assays
OS cells in the logarithmic growth phase were digested with trypsin and washed with phosphate-buffered saline (PBS) and serum-free medium. Transwell chambers were placed on a 24-well plate, and 1×10⁵ cells and serum-free medium were inoculated in the upper compartment of each well. DMEM containing 10% FBS was added to the lower compartment. For cell invasion assay, 50 μL of diluted matrix glue (BD Biosciences, Franklin Lakes, NJ) was added to the upper chamber, followed by incubation at 37°C for 4–5 h. The cells were cultured in a 37°C incubator for 22 h in the migration experiment and 24 h in the invasion experiment. The cells that migrated or invaded were fixed, stained, and counted at a specified time. PBS, trypsin, and serum-free medium were purchased from Thermo Fisher Scientific.
Wound-healing assays
Wound-healing assays were constructed to measure cell migration and repair. We used a 20 U pipette tip to scratch a line in the central growth area of adherent cells cultured on a 12-well plate. The floating cells from the central part were washed out with PBS, and the cells were cultured for another 24 h. In addition, we observed and filmed the migration process from the time of the scratch to 36 h afterward. We then measured and calculated the distance between the 2 edges of the scratch.
Western blot analysis
Radioimmunoprecipitation assay (RIPA) buffer (Thermo Fisher Scientific) containing the protease inhibitor was added to cultured cells, and the cells were lysed on ice for 30 min. After centrifugation at 12 000×g at 4°C for 25 min, protein concentrations in the supernatant were determined using a bicinchoninic (BCA) protein assay kit (Pierce, Rockford, IL, USA). Total protein extracts were isolated by 10% sodium dodecyl sulfate polyacrylamide gel (SDS-PAGE) and transferred to polyvinylidene fluoride (PVDF) membrane (Millipore, USA). The hydrophilic PVDF membrane was blocked in 5% skim milk for 1 h. Afterward, the membrane and the corresponding antibody were incubated at 4°C overnight. The membrane was washed with 1×PBS with Tween (PBST, Thermo Fisher Scientific) 3 times the next day and incubated with anti-rabbit (anti-mouse) antibody for 1 h, then washed with PBST 3 times, and finally developed with enhanced chemiluminescence (ECL) Western Blotting Substrate (Thermo Fisher Scientific). The developed strip was compared with the β-actin control.
Results
Identification of the differently expressed genes between normal samples and tumor samples
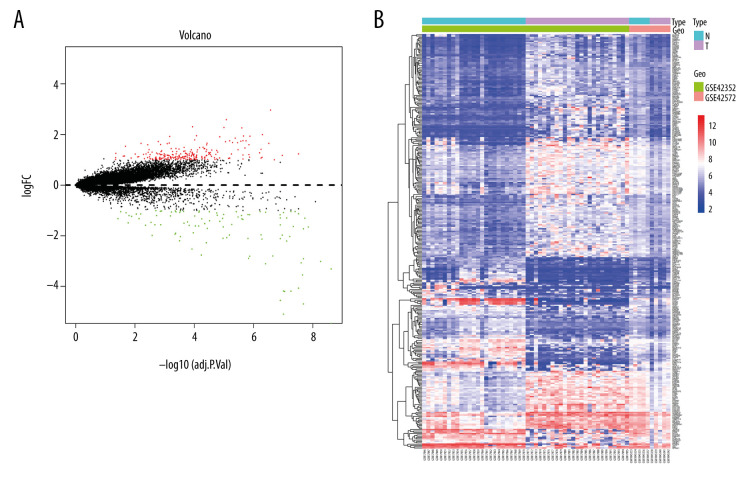
According to the cutoff standards (P<0.05 and |log2FC| ≥2), 314 DEGs were selected, including 213 upregulated genes and 101 downregulated genes. A volcano plot and a heatmap were performed to show upregulated and downregulated genes in tumor samples relative to normal samples (Figure 1).
Figure 1.
(A) Volcano plot and (B) Heat map of differentially expressed genes. Upregulated (red) and downregulated (blue) genes in tumor samples compared with normal samples.
Screening of potential enrichment analysis
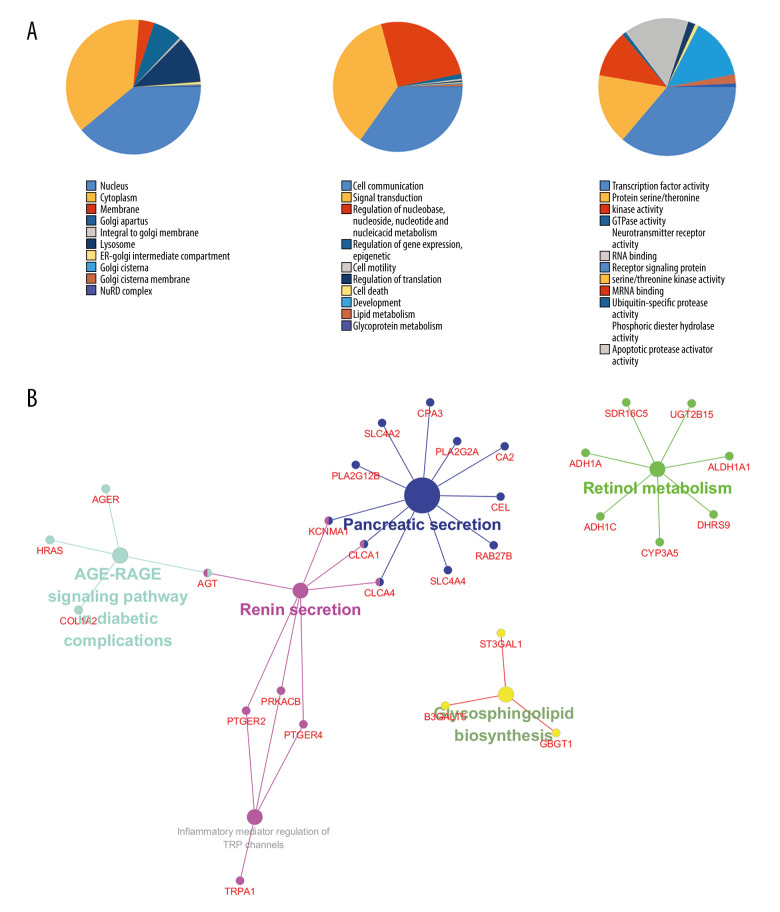
To understand the functions of the DEGs, we entered them into FunRich to perform GO analysis. The results showed that DEGs were most enriched in the nucleus and involved transcription factor activity, cell communication, and signal transduction. KEGG pathway analysis of these target genes was performed by using Cytoscape and ClueGO. The genes were mainly enriched in 6 pathways including glycosphingolipid biosynthesis, retinol metabolism, Advanced glycation end products/receptor for advanced glycation end products (AGE/RAGE) signaling pathway in diabetic complications, pancreatic secretion, inflammatory mediator regulation of transient receptor potential (TRP) channels, and renin secretion (Figure 2).
Figure 2.
(A) The top 10 biological processes, cellular components, and molecular functions of identified genes. (B) Kyoto Encyclopedia of Genes and Genomes (KEGG) pathway enriched by selected genes.
Construction of a PPI network
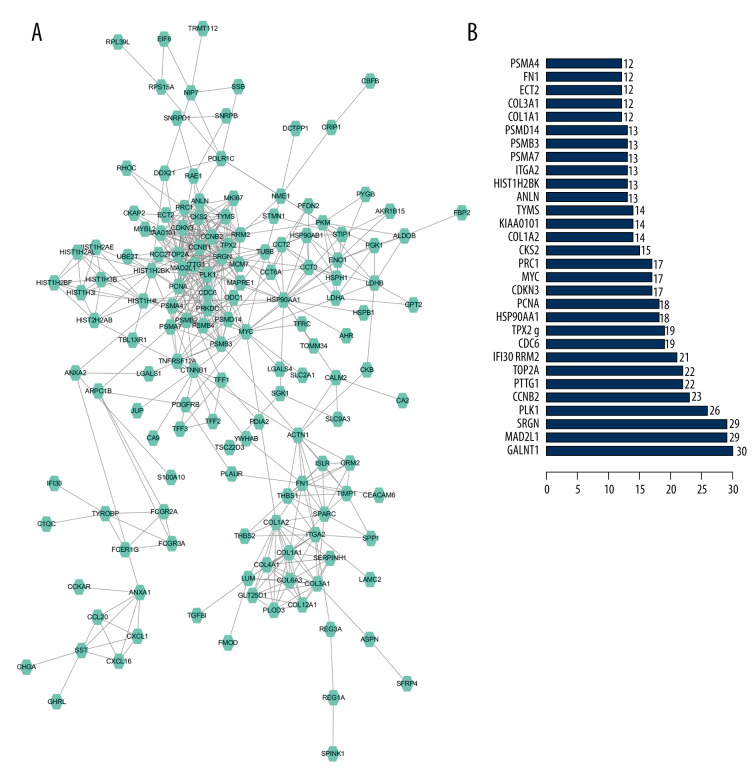
We input 314 genes into the String website. If the comprehensive score was greater than or equal to 0.7, we selected those genes to construct a PPI network. In the PPI network, 8 hub genes, including GALNT1, SRGN, MAD2L1, PLK1, CCNB2, PTTG1, TOP2A, and RRM2, were identified. In addition, a histogram of the frequency of each hub gene was drawn (Figure 3). GALNT1 appeared the most frequently (30 times), and we selected it for further study.
Figure 3.
(A) Protein-protein interaction (PPI) network analysis. (B) The frequency with which each core gene appears in the network diagram.
GALNT1 is overexpressed in OS
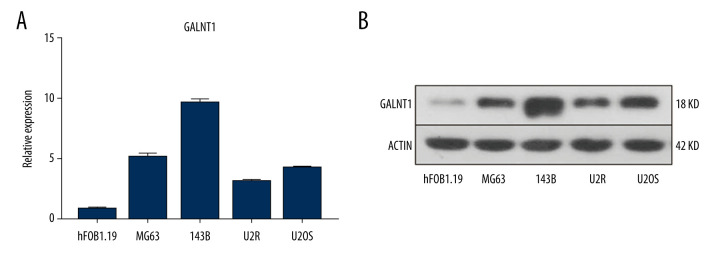
Quantitative RT-PCR was carried out to analyze the expression level of GALNT1 mRNA in each OS cell line. The results showed that the highest expression level of GALNT1 mRNA in 143B cells, while that in U2R was the lowest (Figure 4A). To verify whether the expression of GALNT1 at the protein level conforms to the mRNA results, western blot analysis was conducted. As shown in Figure 4B, the protein expression conformed to the mRNA expression. The expression level of GALNT1 in 143B was much higher than in normal human osteoblasts (hFOB1.19).
Figure 4.
(A) The relative mRNA expression level of GALNT1 in 5 cell lines is conducted by a quantitative polymerase chain reaction. Data are presented as mean±SD. * P<0.05 vs. hFOB1.19. (B) Expression of GALNT1 by western blot in hFOB1.19 and osteosarcoma cell lines.
Overexpression of GALNT1 promoted the aggressiveness of 143B cells in the OS cell line
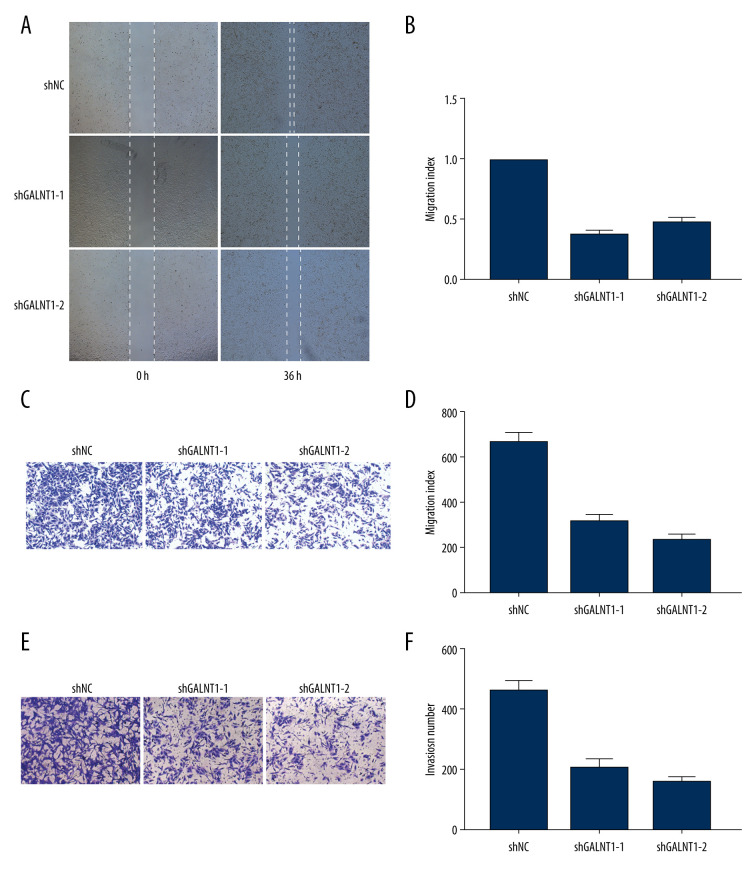
According to the expression level results obtained in the above experiments, we selected the 143B cell line, which had the highest expression level, for determine the biological significance of GALNT1. We transfected 143B cells with 3 shRNAs (shGALNT1-1, shGALNT1-2, and shRNA negative control [shNC]) to downregulate GALNT1 gene expression. The 3 shRNAs were introduced into 143B cells by lentiviral vectors to establish stable cell lines (143B/shGALNT1-1, 143B/shGALNT1-2, and 143B/shNC). Previous studies on GALNT1 have found that high expression of GALNT1 promotes the invasion and repair of many tumors. Therefore, to determine whether GALNT1 plays the same roles in OS, we conducted migration, invasion, and wound-healing assays. The results of the wound-healing assays showed that the healing rate of 143B/shGALNT1-1 and 143B/shGALNT1-2 stable cells was significantly slower than that of 143B/shNC stable cells at 36 h. In the transwell experiment, 143B/shGALNT1 and 143B/shGALNT1 stable cells migrated and invaded the lower compartment in significantly reduced numbers compared with 143B/shNC cells. These results indicate that knockdown of GALNT1 could inhibit the migration, invasion, and healing of 143B cells and that high GALNT1 expression promoted the invasiveness of 143B cells in an OS cell line (Figure 5).
Figure 5.
(A, B) Wound-healing assays in the 3 knockdown cell lines and migration index. (C, D) The migration assays and migration index. (E, F) The invasion assays and migration index. Measurements were in triplicate, and data are presented as the mean±SD. ** P<0.01 vs. hFOB1.19.
Discussion
In recent years, the 5-year survival rate for patients with OS after treatment has been about 65–70%, but the survival rate for patients with metastatic disease remains low, at less than 20% [13]. In the absence of a good treatment for metastatic OS, studying the disease at the molecular level can determine which genes promote metastasis and increase the aggressiveness of OS. If the activity of these genes can be inhibited, it is possible to assess whether they affect the aggressiveness of OS and spread to other organs, and it could enable developing new molecular-targeted drugs.
In this study, GSE42352 and GSE42572 were downloaded from the GEO. We identified 314 cancer-related gene expression patterns, suggesting that these 314 mRNAs play a role in promoting the development of OS. To better understand the regulatory mechanism of these genes in OS, we used FunRich, an open access standalone functional enrichment and network analysis tool, to further study them. Gene enrichment analysis demonstrated that these mRNAs were primarily associated with the nucleus and with transcription factor activity, cell communication, and signal transduction. These associations are consistent with defects in the cell cycle and cell proliferation regulator functions being main causes of tumor occurrence and development [14,15]. Ion transport in cancer cells is substantially different from that in normal cells [16]. KEGG pathway analysis indicated that the identified genes were mainly enriched in 6 pathways, including glycosphingolipid biosynthesis, retinol metabolism, AGE/RAGE signaling pathway in diabetic complications, pancreatic secretion, inflammatory mediator regulation of TRP channels, and renin secretion. Several studies on cancer-related glycosylation have shown that abnormal glycosylation is a common feature in various stages of malignant transformation and tumor progression [17,18]. It is important to note that the glycosylation changes observed so far have been relatively specific to the type and stage of cancer, making glycans potential biomarkers and targets for drug therapy. As for the AGE/RAGE signaling pathway in diabetic complications, a previous study provides evidence that glycine might inhibit the AGE/RAGE pathway and subsequent oxidative stress by improving Glo1 function, thus protecting against diabetic macrovascular complications [19]. TRP channels are regulated by proinflammatory mediators, neuropeptides, and cytokines. Antagonists or agonists targeting these receptors have achieved large breakthroughs in the treatment of pain [20]. However, the regulation mechanism of these pathways in OS has not been studied yet.
In this study, we screened many different genes through bioinformatics analysis. By constructing the PPI network, we found that GALNT1 had the highest frequency. In the published literature, we found that GALNT1 was highly expressed in a variety of tumors and played a role in promoting tumor invasion. Therefore, we selected and detected whether the expression level of GALNT1 in normal human osteoblasts differed from that in OS cell lines. Our western blot and qRT-PCR results revealed that the expression level of GALNT1 in OS was indeed much higher than that in human osteoblasts (hFOB1.19), especially in the 143B cell line. Therefore, we selected 143B cells for GALNT1 knockdown experiments, and conducted transwell assays and wound-healing assays on GALNT1-knockdown cells. The results showed that GALNT1 knockdown reduced the invasion and healing ability of 143B cells. In conclusion, we can infer that GALNT1 plays a role in promoting tumorigenesis and aggressiveness in OS as in other tumors.
As for GALNT1, a previous study found that overexpression of GALNT1 suppresses epidermal growth factor (EGF)-induced EGF receptor (EGFR) activation and enhances its degradation [21]. Another study reported that knockdown of SNHG7 inhibited GALNT1 and epithelial-mesenchymal transition markers (E-cadherin and vimentin) and may play an important role in colorectal cancer progression [22]. It also identified a bladder cancer stem cell subpopulation in human bladder cancers that seems to be responsive to the inhibition of GALNT1 and Sonic Hedgehog signaling, and therefore highlights a potential method for preventing the rapid progress typical in patients with bladder tumor [23].
At present, with the progress of medical and health services, the treatment of individual differences has drawn increased attention. Therefore, it is very important to find new biomarkers for patients. Our study concluded that many DEGs are involved in the development of OS by certain signaling pathways and had prognostic value. However, our data are entirely obtained from the GEO database through bioinformatics analysis, and the number of relevant samples was limited. Therefore, further data analysis and clinical trials are needed to verify our results.
Conclusions
Our study demonstrated some mechanisms for the development of OS. Many DEGs were identified between normal samples and tumor samples by using bioinformatics methods. We also examined the expression level and invasiveness of the GALNT1 gene in OS and found that its overexpression enhanced the invasiveness of OS, which may be related to the malignant prognosis of OS. These findings should be tested in future investigations.
Footnotes
Conflict of interests
None.
Availability of data and materials
The datasets used and/or analyzed during the current study are available from the corresponding author on reasonable request.
Source of support: Departmental sources
References
- 1.Luetke A, Meyers PA, Lewis I, Juergens H. Osteosarcoma treatment – where do we stand? A state of the art review. Cancer Treat Rev. 2014;40(4):523–32. doi: 10.1016/j.ctrv.2013.11.006. [DOI] [PubMed] [Google Scholar]
- 2.Kempf-Bielack B, Bielack SS, Jurgens H, et al. Osteosarcoma relapse after combined modality therapy: An analysis of unselected patients in the Cooperative Osteosarcoma Study Group (COSS) J Clin Oncol. 2005;23(3):559–68. doi: 10.1200/JCO.2005.04.063. [DOI] [PubMed] [Google Scholar]
- 3.Isakoff MS, Bielack SS, Meltzer P, Gorlick R. Osteosarcoma: Current treatment and a collaborative pathway to success. J Clin Oncol. 2015;33(27):3029–35. doi: 10.1200/JCO.2014.59.4895. [DOI] [PMC free article] [PubMed] [Google Scholar]
- 4.Sun W, Ma X, Shen J, et al. Bioinformatics analysis of differentially expressed pathways related to the metastatic characteristics of osteosarcoma. Int J Mol Med. 2016;38(2):466–74. doi: 10.3892/ijmm.2016.2657. [DOI] [PMC free article] [PubMed] [Google Scholar]
- 5.Bennett EP, Mandel U, Clausen H, et al. Control of mucin-type O-glycosylation: A classification of the polypeptide GalNAc-transferase gene family. Glycobiology. 2012;22:736–56. doi: 10.1093/glycob/cwr182. [DOI] [PMC free article] [PubMed] [Google Scholar]
- 6.Gerken TA, Raman J, Fritz TA, Jamison O. Identification of common and unique peptide substrate preferences for the UDP-GalNAc: Polypeptide alpha-N-acetylgalactosaminyltransferases T1 and T2 derived from oriented random peptide substrates. J Biol Chem. 2006;281:32403–16. doi: 10.1074/jbc.M605149200. [DOI] [PubMed] [Google Scholar]
- 7.Huang MJ, Hu RH, Chou CH, et al. Knockdown of GALNT1 suppresses malignant phenotype of hepatocellular carcinoma by suppressing EGFR signaling. Oncotarget. 2015;6:5650–65. doi: 10.18632/oncotarget.3117. [DOI] [PMC free article] [PubMed] [Google Scholar]
- 8.Hua D, Shen L, Xu L, et al. Polypeptide N-acetylgalactosaminyltransferase 2 regulates cellular metastasis-associated behavior in gastric cancer. Int J Mol Med. 2012;30:1267–74. doi: 10.3892/ijmm.2012.1130. [DOI] [PMC free article] [PubMed] [Google Scholar]
- 9.Wu YM, Liu CH, Hu RH, et al. Mucin glycosylating enzyme GALNT2 regulates the malignant character of hepatocellular carcinoma by modifying the EGF receptor. Cancer Res. 2011;71:7270–79. doi: 10.1158/0008-5472.CAN-11-1161. [DOI] [PubMed] [Google Scholar]
- 10.Kitada S, Yamada S, Kuma A, et al. Polypeptide N-acetylgalactosaminyl transferase 3 independently predicts high-grade tumours and poor prognosis in patients with renal cell carcinomas. Br J Cancer. 2013;109:472–81. doi: 10.1038/bjc.2013.331. [DOI] [PMC free article] [PubMed] [Google Scholar]
- 11.Milde-Langosch K, Schutze D, Oliveira-Ferrer L, et al. Relevance of betaGal-betaGalNAc-containing glycans and the enzymes involved in their synthesis for invasion and survival in breast cancer patients. Breast Cancer Res Treat. 2015;151:515–28. doi: 10.1007/s10549-015-3425-0. [DOI] [PubMed] [Google Scholar]
- 12.Liao D, Zhong L, Duan T, et al. Aspirin suppresses the growth and metastasis of osteosarcoma through the NF-kappaB pathway. Clin Cancer Res. 2015;21(23):5349–59. doi: 10.1158/1078-0432.CCR-15-0198. [DOI] [PubMed] [Google Scholar]
- 13.Harrison DJ, Geller DS, Gill JD, et al. Current and future therapeutic approaches for osteosarcoma. Expert Rev Anticancer Ther. 2018;18(1):39–50. doi: 10.1080/14737140.2018.1413939. [DOI] [PubMed] [Google Scholar]
- 14.Perez R, Wu N, Klipfel AA, Beart RW., Jr A better cell cycle target for gene therapy of colorectal cancer: cyclin G. J Gastrointest Surg. 2003;7(7):884–89. doi: 10.1007/s11605-003-0034-8. [DOI] [PubMed] [Google Scholar]
- 15.Tominaga O, Nita ME, Nagawa H, et al. Expressions of cell cycle regulators in human colorectal cancer cell lines. Jpn J Cancer Res. 1997;88(9):855–60. doi: 10.1111/j.1349-7006.1997.tb00461.x. [DOI] [PMC free article] [PubMed] [Google Scholar]
- 16.Djamgoz MB, Coombes RC, Schwab A. Ion transport and cancer: From initiation to metastasis. Philos Trans R Soc Lond B Biol Sci. 2014;369(1638):20130092. doi: 10.1098/rstb.2013.0092. [DOI] [PMC free article] [PubMed] [Google Scholar]
- 17.Hakomori S. Tumor-associated carbohydrate antigens defining tumor malignancy: Basis for development of anti-cancer vaccines. Adv Exp Med Biol. 2001;491:369–402. doi: 10.1007/978-1-4615-1267-7_24. [DOI] [PubMed] [Google Scholar]
- 18.Yue T, Goldstein IJ, Hollingsworth MA, et al. The prevalence and nature of glycan alterations on specific proteins in pancreatic cancer patients revealed using antibody-lectin sandwich arrays. Mol Cell Proteomics. 2009;8(7):1697–707. doi: 10.1074/mcp.M900135-MCP200. [DOI] [PMC free article] [PubMed] [Google Scholar]
- 19.Wang Z, Zhang J, Chen L, et al. Glycine suppresses AGE/RAGE signaling pathway and subsequent oxidative stress by restoring Glo1 function in the aorta of diabetic rats and in HUVECs. Oxid Med Cell Longev. 2019;2019 doi: 10.1155/2019/4628962. 4628962. [DOI] [PMC free article] [PubMed] [Google Scholar]
- 20.Premkumar LS, Abooj M. TRP channels and analgesia. Life Sci. 2013;92(8–9):415–24. doi: 10.1016/j.lfs.2012.08.010. [DOI] [PMC free article] [PubMed] [Google Scholar]
- 21.Wu YM, Liu CH, Hu RH, et al. Mucin glycosylating enzyme GALNT2 regulates the malignant character of hepatocellular carcinoma by modifying the EGF receptor. Cancer Res. 2011;71:7270–79. doi: 10.1158/0008-5472.CAN-11-1161. [DOI] [PubMed] [Google Scholar]
- 22.Shan Y, Ma J, Pan Y, et al. LncRNA SNHG7 sponges miR-216b to promote proliferation and liver metastasis of colorectal cancer through upregulating GALNT1. Cell Death Dis. 2018;9:722. doi: 10.1038/s41419-018-0759-7. [DOI] [PMC free article] [PubMed] [Google Scholar]
- 23.Li C, Du Y, Yang Z, et al. GALNT1-mediated glycosylation and activation of Sonic Hedgehog signaling maintains the self-renewal and tumor-initiating capacity of bladder cancer stem cells. Cancer Res. 2016;76:1273–83. doi: 10.1158/0008-5472.CAN-15-2309. [DOI] [PubMed] [Google Scholar]


