Abstract
Objective
To construct and validate a clinically accurate and histology-specific nomogram to predict overall survival (OS) among liposarcoma (LPS) patients.
Methods
We retrospectively screened eligible patients with LPS diagnosed between 2004 and 2015 from the Surveillance, Epidemiology, and End Results database. We screened independent predictors for the nomogram using univariate and multivariate analyses. We then evaluated the prognostic accuracy of the nomogram by receiver operating characteristic (ROC) curve analysis and Harrell’s concordance index. The prognostic performances of the nomogram and the American Joint Committee on Cancer (AJCC) seventh edition staging system were compared using integrated discrimination improvement (IDI), net reclassification improvement (NRI), and decision curve analyses (DCA).
Results
A novel nomogram was developed using independent prognostic variables, which exhibited excellent predictive performances for 3- and 5-year OS according to ROC curves. The C-index proved that the proposed nomogram had better prognostic accuracy for LPS than the traditional AJCC system, while the NRI, IDI, and DCA of the nomogram indicated better clinical net benefit.
Conclusions
The proposed nomogram can predict 3- and 5-year OS of LPS patients with reliable accuracy and may thus help clinicians to develop appropriate clinical therapies and counseling strategies to prolong the life expectancy of these patients.
Keywords: Liposarcoma, nomogram, overall survival, SEER database, prediction, prognosis
Introduction
Sarcomas develop from mesenchymal tissue and comprise a heterogeneous group of malignant tumors with more than 70 histological subtypes.1 Soft tissue sarcoma (STS) includes more than 50 histological subtypes,2 of which liposarcoma (LPS) is the most common type, accounting for approximately 20% of all mesenchymal STS.3–5 LPS includes four major histological groups,6 and its incidence typically peaks in the fifth and sixth decades of life.7 LPS arises from malignantly transformed adipose cells and lipoblasts and can occur at any site in the body,5,8,9 including the extremities and retroperitoneum, thus affecting human health and survival. LPS is linked to poor overall survival (OS).10,11
Previous studies have identified mechanisms linked to the prognosis of LPS, but population-based prognostic studies are scant. The establishment of a prognostic system with independent variables would aid the diagnosis, development of treatment strategies, and prediction of OS in patients with LPS. The identification of appropriate clinical variables related to prognosis might help clinicians conduct accurate assessments of critical long-term outcomes.12 To the best of our knowledge however, there is currently no information on systematic treatment strategies for LPS, and few correlational pieces of research on radiotherapy (RT), surgery, and chemotherapy in the context of population-based studies. Hence, identifying suitable variables for LPS patients is essential for the development of an accurate prognostic system.
The creation of an accurate prognostic model presents a challenge for outcome counseling and for determining adjuvant therapy recommendations. The main prognostic model is currently the American Joint Committee on Cancer (AJCC) staging system. According to the AJCC system, some variables (tumor size, lymph node metastasis, and distant metastasis) were proven to be independent of OS in patients with STS.13 Previous studies indicated that other variables, such as age,13,14 surgery,15 RT,14,15 grade,13,14,16 histology type,13,16 and socioeconomic status (SES) were also associated with prognosis in patients with STS.17 However, specific prognostic variables for LPS are lacking.
Different subtypes of LPS have different prognoses and biological performances; for example, the 5-year survival in patients with pleomorphic LPS (PLS) was 47.6%, whereas the 5-year OS in patients with dedifferentiated LPS (DDLPS) was 54.4%.11,18 The importance of early identification and accurate prognostic assessment of the subtypes of LPS, and the fact that the AJCC staging system can only roughly assess partial clinical features and OS in LPS patients, highlight the need for a histology-specific prognostic model for predicting OS in LPS patients.
Nomograms can predict the prognosis and outcomes of STS patients.2,13,19–21 However, there is a lack of histology-specific nomograms for evaluating the prognoses and assisting clinical decision making regarding LPS on the basis of an extensive database. Previous models considered the effect of subtypes on prognosis, but analyses of variables have been limited and lacking external validation.11 The Surveillance, Epidemiology, and End Results (SEER) database is a high-quality extensive population database covering approximately 28% of the population of the United States,22 which has been widely used in clinical research of rare tumors.23,24
We aimed to identify several independent and histology-specific prognostic variables in LPS patients. We then constructed a novel comprehensive nomogram using these variables and the SEER database with the goal of predicting 3- and 5-year OS in LPS patients. We also evaluated the performance of our model by comparing it with the traditional AJCC system.
Materials and methods
Enrollment and collection of participant data
The SEER database is a population database that provides cancer survival data from 18 states in the United States.22,25 We retrospectively screened the SEER database. There were four major histological groups of LPS: well-differentiated LPS (WDLPS; ICD-O-3 8851), myxoid LPS (MLS; ICD-O-3 8852)/round cell LPS (RCL; ICD-O-3 8853), PLS (ICD-O-3 8854), and DDLPS (ICD-O-3 8858).6,11,26 RCL is currently considered to represent a high-grade MLS,20 and mixed-type LPS (MixLPS; ICD-O-3 8855) can be observed in the clinic. Moreover, LPS (NOS) (ICD-O-3 8850/3) is an integral part of the LPS data in the SEER database. To accurately predict survival, we therefore distinguished six types of histology. We registered and queried the SEER program database (by SEER*Stat version 8.3.6, Information Management Services, Inc. Calverton, MD, USA) for records of LPS from 2004 to 2015.
The inclusion criteria for cohort selection were: (1) patients with ICD-O-3 codes 8850/3, 8851/3, 8852/3, 8853/3, 8854/3, 8858/3, and 8855/3; (2) patients with a diagnosis between 2004 and 2015; and (3) primary sites C38.0-3, C38.8, C40.0, C40.2, C41.1, C41.3, C47.1, C47.5, C48.0-2, C48.8, C49.0-6, C49.8, and C49.9. The exclusion criteria were: (1) grade, tumor size, lymph nodes, extension, and race categorized as “NA” or unknown; (2) survival status categorized as “NA” or unknown; (3) survival time categorized as zero or unknown; (4) performance status of a surgery categorized as unknown; and (5) unknown AJCC stage.
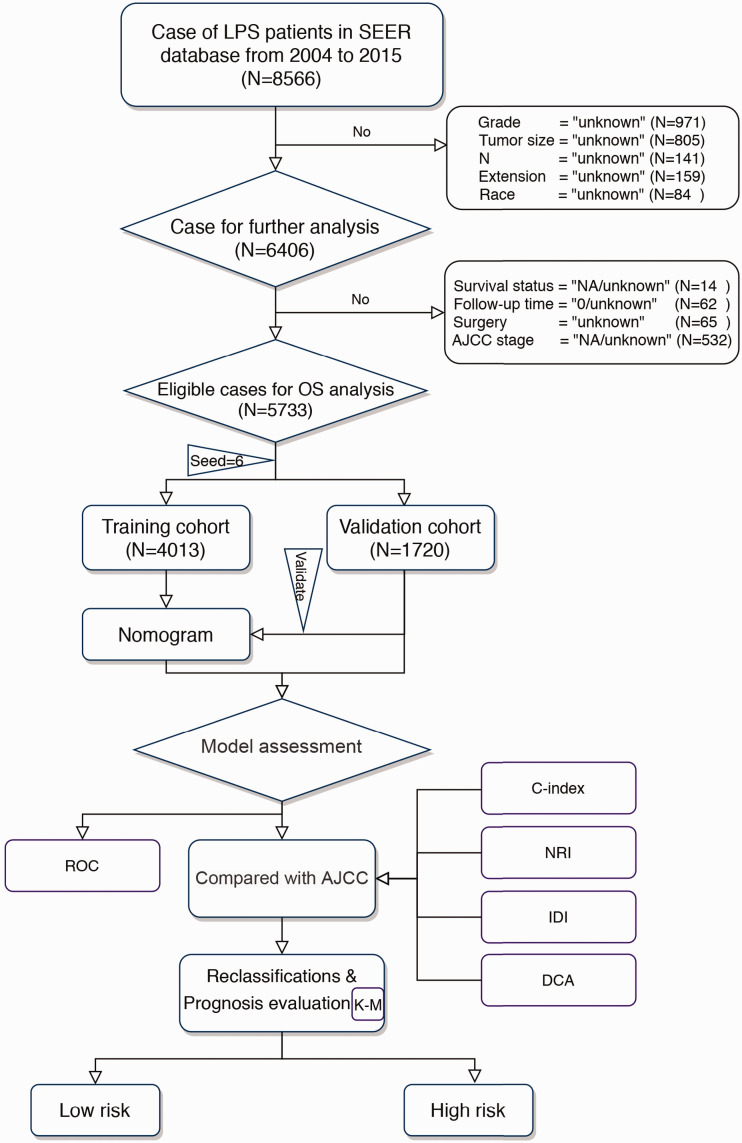
Figure 1 shows the data selection process. After applying the criteria, LPS patients diagnosed between 2004 and 2015 who qualified for the study were randomly separated into two groups (training cohort and validation cohort) using R software (set seed = 6; R version 3.6.1 [https://www.r-project.org]), according to a ratio of 7:3. The “survival” package in R (Survdiff function) was used to verify the homogeneity of the two groups (training cohort and test cohort). The authors registered with and were approved by the SEER database (free registration), and this study was approved by the Institutional Review Board of Xi’an Jiaotong University.
Figure 1.
Flowchart of selection process and experimental procedure in patients with liposarcoma
LPS, liposarcoma; OS, overall survival, SEER, Surveillance, Epidemiology, and End Results; AJCC, American Joint Committee on Cancer; NRI, net reclassification improvement; IDI, integrated discrimination improvement; DCA, decision curve analysis; ROC, receiver operating characteristic curve.
Technical and statistical information
Stepwise approach for screening independent variables and nomogram development
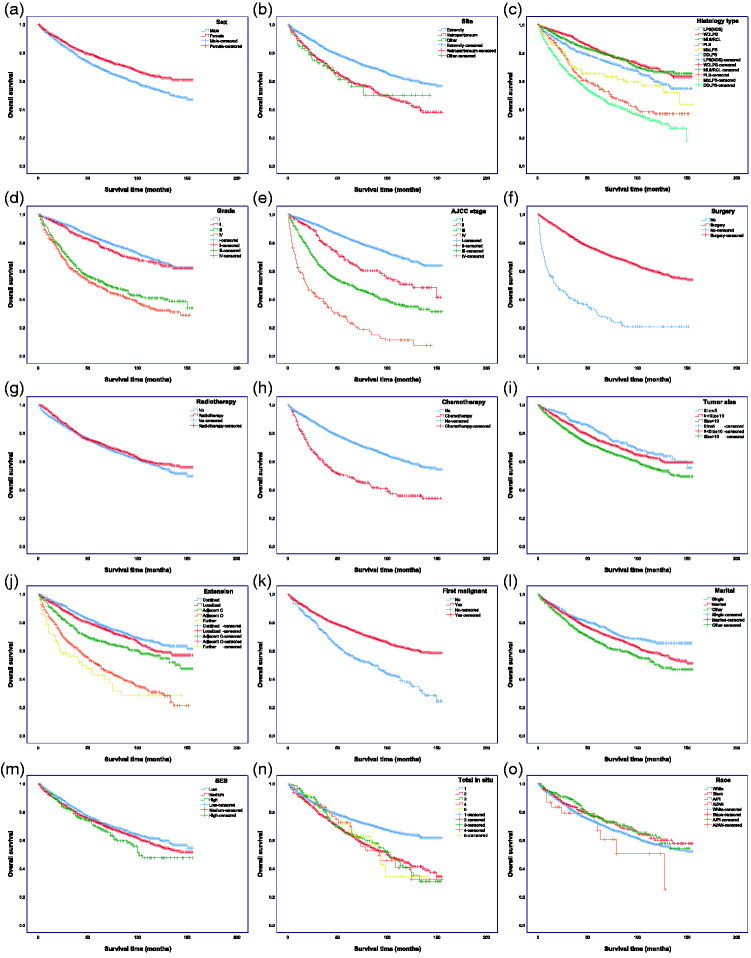
We first used a data-driven nonparametric approach to identify potential differential variables from the original dataset, including identified prognostic indicators. We then used the Kaplan–Meier method to estimate OS and detect intersections between the variables, using a two-sided log-rank test (Figure 2). We determined the risk variables by univariate analysis, including informative variables identified from the last step and those significant in predicting outcome measurement in OS. Third, based on the training cohort (n = 4013), we performed multivariate Cox proportional hazards analysis to screen the variables used to build the novel nomogram to predict 3- and 5-year OS. Finally, the nomogram was validated internally based on the validation cohort (n = 1720).
Figure 2.
Kaplan–Meier curves of overall survival in patients with liposarcoma (LPS). (a) Sex, (b) race, (c) site, (d) histology type, (e) grade, (f) AJCC stage, (g) surgery, (h) radiotherapy strategy, (i) chemotherapy strategy, (j) tumor size, (k) extension, (l) first malignant (LPS first malignant tumor), (m) total in situ, (n) marital status, (o) SES. The P values are shown in Supplementary Table 2
SES, socioeconomic status.
Performance evaluation of the LPS nomogram and comparison with the AJCC system
Receiver operating characteristic curve (ROC) and area under the curve (AUC) were used to assess the sensitivity and specificity of the nomogram, and the C-index (Z test) was constructed to compare the performance of the nomogram model and the traditional AJCC staging system. Thereafter, we performed net reclassification improvement (NRI) and integrated discrimination improvement (IDI) analyses, which can measure discrimination or improvement of the predictive accuracy, using the R “survival” package (version 3.1). Furthermore, we performed decision curve analysis (DCA) to visualize the net benefit for clinical decisions. For the sake of validation, we added calibration plots (bootstrap = 500).27,28
The final score was calculated as the sum of each item of the nomogram. An optimal cut-off score was determined using the prognostic index with R and was used to divide the LPS patients into high-risk and low-risk groups for survival analysis using the Kaplan–Meier method (Figure 1).
Continuous variables with a normal distribution were presented as mean ± standard deviation. Hazard ratios (HRs) and 95% confidence intervals (CI) were calculated. Statistical analyses were carried out using R software (R Foundation for Statistical Computing, Vienna, Austria) and SPSS Statistics for Windows, Version 25.0 (SPSS Inc., Chicago, IL, USA). A two-tailed P-value < 0.05 was considered significant.
Results
Clinical baseline data and OS analysis
A total of 5733 LPS patients diagnosed between 2004 and 2015 met the inclusion and none of the exclusion criteria. They were randomly separated into a training cohort (n = 4013) and a validation cohort (n = 1720). Baseline data are shown in Supplementary Table 1. The average age was 59.90 ± 15.49 years (range 7–101 years) at the time of diagnosis. LPS was observed in the extremities (77.1%), retroperitoneum (21.1%), and other primary sites (1.8%). The histological types were as follows: 12.7%, LPS (NOS); 38.0%, WDLPS; 19.6%, ML/RC; 6.8%, PLS; 19.9%, DDLPS; and 3.1%, MixLPS. The most common tumor size was >10 cm (65.1%) and the most common grade was grade I (54.5%). Similarly, according to the AJCC system, more than half of the patients were categorized as AJCC stage I (67.1%). Most LPS patients (55.9%) were 10% to 20% below the poverty line. Homogeneity test found no significant differences in clinical characteristics between the validation and training cohorts.
Screening for independent informative prognostic variables
According to the clinical evaluation, we selected the following variables as potential prognostic variables: age, sex, race, tumor site, histology type, grade, AJCC stage, surgery, RT, chemotherapy, tumor size, extension, first malignant (i.e. LPS was the first malignant tumor in the patient), total in situ (tumor number), marital status, and SES. Based on the assumptions of the Cox proportional hazards regression model, we tested these variables using Kaplan–Meier curves (Figure 2; log-rank test). RT and race were not significant in the univariate analysis; however, given that RT is generally considered useful in the clinical context and has substantial potential to interact with other variables, it was included in the subsequent multifactor analysis. The Kaplan–Meier survival curves for race and total in situ displayed nonsignificant intersections and were excluded from the subsequent multifactor analysis. We accordingly identified 14 variables that were significantly associated with OS.
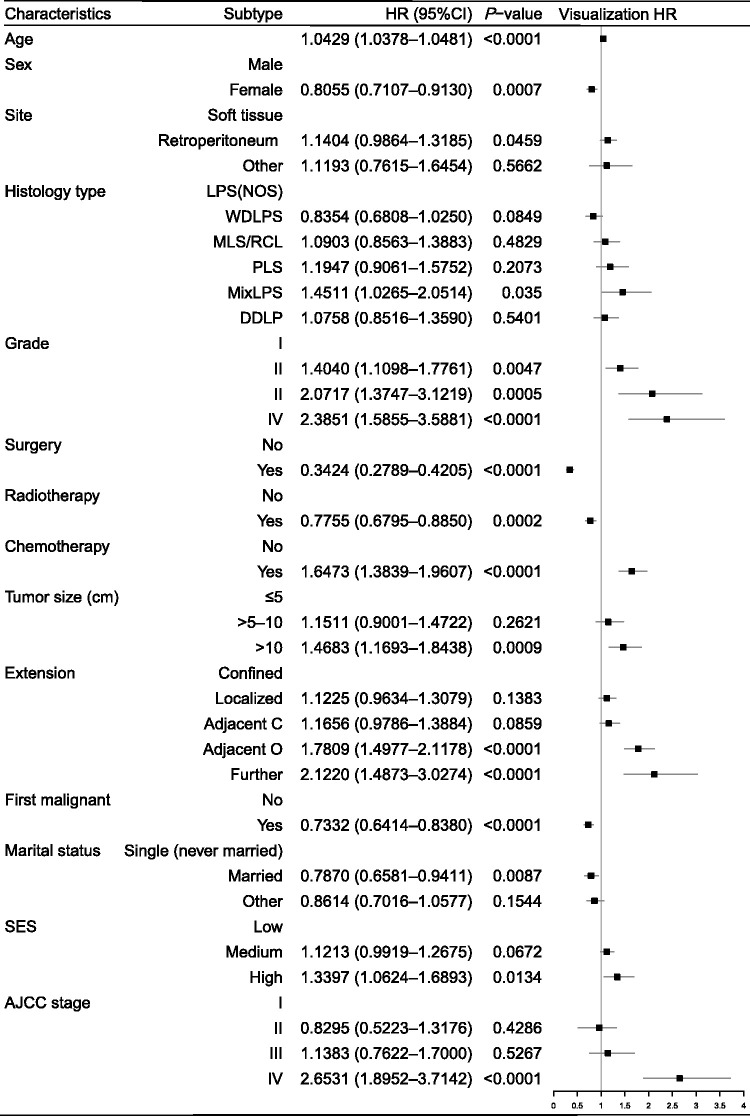
The Cox proportional hazards model revealed that all 14 variables were independent prognostic variables for OS, of which six had not previously been associated with OS in LPS patients. Age, site, histology type, grade, chemotherapy, tumor size, extension, SES, and AJCC stage were independent negative predictors of OS, while sex, surgery, RT, first malignant, and marital status were independent positive predictors of OS (Figure 3).
Figure 3.
Prognostic values of selected indicators by Cox multivariate analysis for overall survival in patients with liposarcoma
HR, hazard ratio; CI, confidence interval; SES, economic status (persons below poverty); Adjacent C, adjacent connective tissue; Adjacent O, adjacent organ; LPS (NOS), liposarcoma; WDLPS, well-differentiated liposarcoma; MLS/RCL, myxoid/round cell liposarcoma; PLS, pleomorphic liposarcoma; MixLPS, mixed-type liposarcoma; DDLPS, dedifferentiated liposarcoma; AJCC, American Joint Committee on Cancer.
Nomogram construction
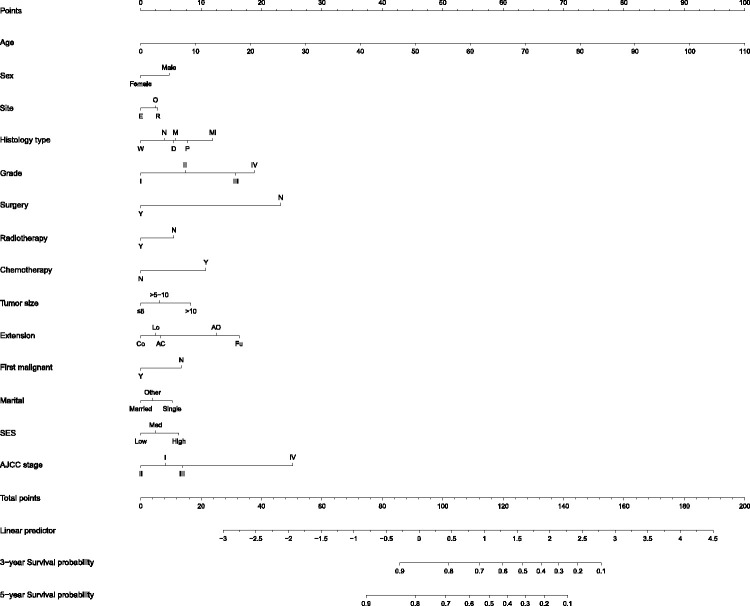
Fourteen significant potential variables were identified on the basis of the Cox multivariate logistic regression analysis. All independent variables were incorporated to develop a more accurate nomogram for optimizing personalized prognostic assessment and predicting 3- and 5-year OS in LPS patients (Figure 4).
Figure 4.
Nomogram for predicting 3-year and 5-year overall survival in patients with liposarcoma (LPS)
Histology type: N, LPS, NOS; W, well-differentiated LPS; M, myxoid/round cell LPS; P, pleomorphic LPS; Mi, mixed LPS; D, dedifferentiated LPS. Extension: Co, confined; Lo, localized; AC, adjacent tissue; AO, adjacent organ/structure; Fu, further contiguous. SES, socioeconomic status: L, low, M, medium; H, high.
Performance and validation of the nomogram
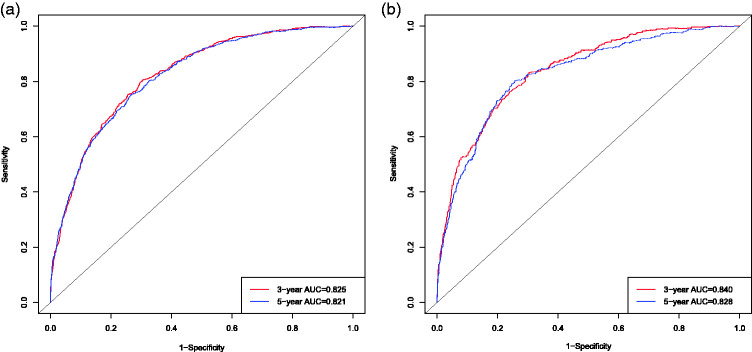
The AUCs for OS according to the nomogram showed excellent discriminative ability in the training set (3-year OS, 0.825; 5-year OS, 0.821) and the validation set (3-year OS, 0.840; 5-year OS, 0.828). Moreover, the degree of smoothness and relationship between the ROC curves and the axis showed that the proposed nomogram had good discrimination in the training and validation cohorts (Figure 5).
Figure 5.
Receiver operating characteristic curves (ROC) and areas under the curves for predicting 3-year and 5-year overall survival for novel nomograms and 7th AJCC staging systems in patients with liposarcoma. (a) 3-year and 5-year ROC in training cohort; (b) 3-year and 5-year ROC in validation cohort.
The C-index of the proposed nomogram showed better predictive performance than that of the AJCC system in the training set (79.40% [79.36%–79.44%] vs. 68.20% [68.15%–68.25%], respectively) and validation set (80.20% [80.11%–80.29%] vs. 71.30% [71.19%–71.41%], respectively). Moreover, all the 95% CIs were very narrow, and the Z-values differed significantly from zero in the training and validation cohorts (current model = 46.39 and 31.84; AJCC = 23.49 and 18.27) (Table 1). We demonstrated that the proposed nomogram was more accurate and showed better predictive probability than the AJCC system (Table 1).
Table 1.
Performance of current nomogram and 7th AJCC staging systems in patients with liposarcoma.
|
Training (n = 4013) |
Test (n = 1720) |
|||||
|---|---|---|---|---|---|---|
| Statistical index | Z | P | Statistical index | Z | P | |
| C-index (95%CI) | ||||||
| Nomogram | 79.40% (79.36%–79.44%) | 46.39 | * | 80.20% (80.11%–80.29%) | 31.84 | * |
| AJCC | 68.20% (68.15%–68.25%) | 23.49 | * | 71.30% (71.19%–71.41%) | 18.27 | * |
| IDI (%) | ||||||
| 3-year | 9.76% (9.12%–10.40%) | 17.59 | * | 8.26% (7.27%–9.25%) | 9.41 | * |
| 5-year | 12.05% (11.30%–12.80%) | 18.87 | * | 10.05% (8.88%–11.21%) | 9.89 | * |
| NRI (95%CI) | ||||||
| 3-year | 0.5392 (0.4754–0.6365) | 0.4966 (0.3399–0.6488) | ||||
| 5-year | 0.6470 (0.5907–0.7299) | 0.5244 (0.3567–0.6879) | ||||
*P < 0.00001AJCC.
American Joint Committee on Cancer; C-index, Harrell’s C-index; IDI, integrated discrimination improvement; NRI, net reclassification improvement; CI, confidence interval.
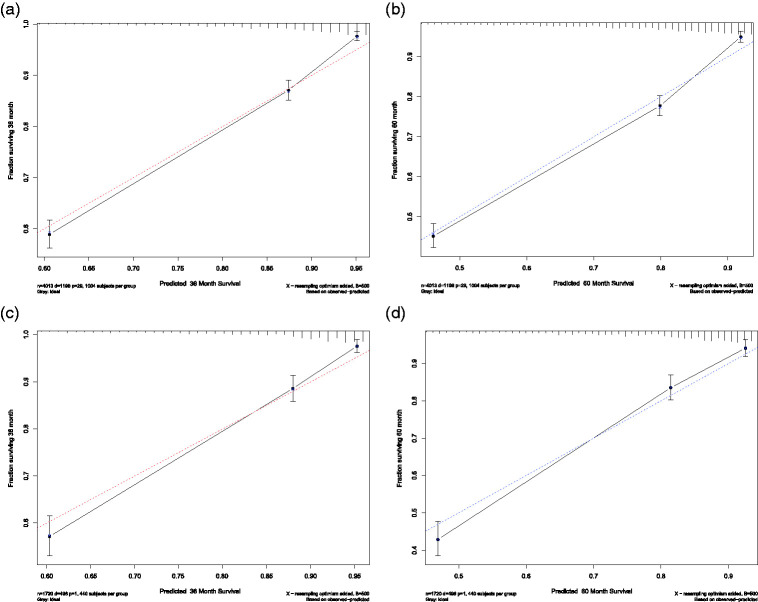
In the training cohort, the 3- and 5-year calibration curves showed good agreement and satisfactory consistency between the predicted survival and the actual observations. Similar consistency was displayed in the validation cohort (Figure 6).
Figure 6.
Calibration plots for predicting 3-year and 5-year overall survival (OS) in the training and validation cohorts. X-axis: bootstrap-predicted survival; y-axis: actual outcome. Calibration plots for (a) 3-year OS in the training cohort, (b) 5-year OS in the training cohort, (c) 3-year OS in the validation cohort, and (d) 5-year OS in the validation cohort.
Reclassification analyses
Reclassification analyses were performed to strengthen the multivariate analysis. NRI and IDI helped provide estimates of the added value to the classical AJCC staging system provided by these variables. Both the 3-year NRIs (training, 0.5392 [0.4754–0.6365]; validation, 0.4966 [0.3399–0.6488]) and 5-year NRIs (training, 0.6470 [0.5907–0.7299]; validation, 0.5244 [0.3567–0.6879]) demonstrated that our proposed nomogram was more effective than the AJCC system. Moreover, when comparing the prediction accuracies of the two models, the IDI functioned as a quantitative indicator for the comparison of the degree of improvement in the diagnostic accuracy of the current model and the AJCC staging system. In the training cohort, the 3-year IDI was 9.76% [9.12%–10.40%] (P < 0.00001) and the 5-year IDI was 12.05% [11.30%–12.80%] (P < 0.00001). In the validation cohort, the 3-year IDI was 8.26% [7.27%–9.25%] (P < 0.00001) and the 5-year IDI was 10.05% [8.88%–11.21%] (P < 0.00001). The IDIs also confirmed that the current nomogram had stronger prognostic power than the AJCC staging system (Table 1).
DCA
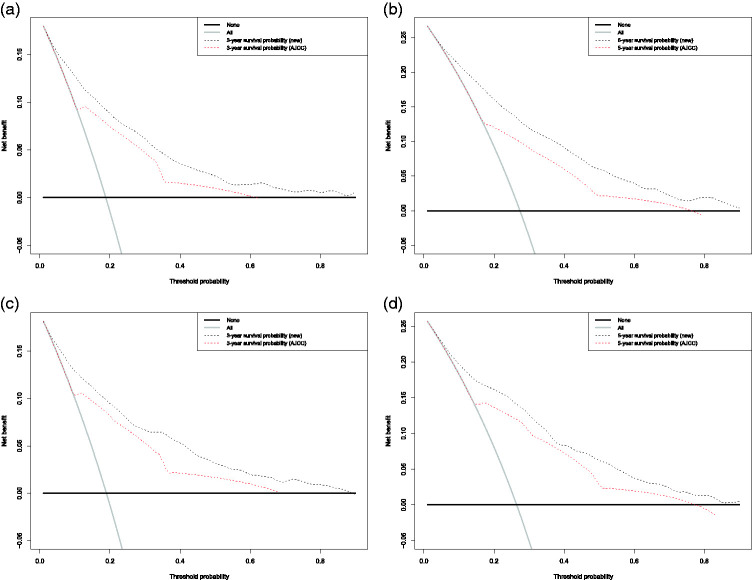
We conducted ROC analysis to assess the sensitivity and specificity and DCA analysis to evaluate the clinical value of our nomogram. The DCA curve revealed a more extensive range of cut-off probabilities shown by the new nomogram. The threshold probabilities of the new model had excellent net benefits and enhanced performance for predicting the 3- and 5-year OS in LPS patients in both the training and validation cohorts compared with the AJCC system (Figure 7).
Figure 7.
Decision curve analysis (DCA) of the novel nomogram and 7th AJCC staging system for predicting overall survival (OS) in patients with liposarcoma. X-axis: cut-off probability; y-axis: net benefit. DCA for (a) 3-year OS in the training cohort, (b) 5-year OS in the training cohort, (c) 3-year OS in the validation cohort, and (d) 5-year OS in the validation cohort.
Prognostic score
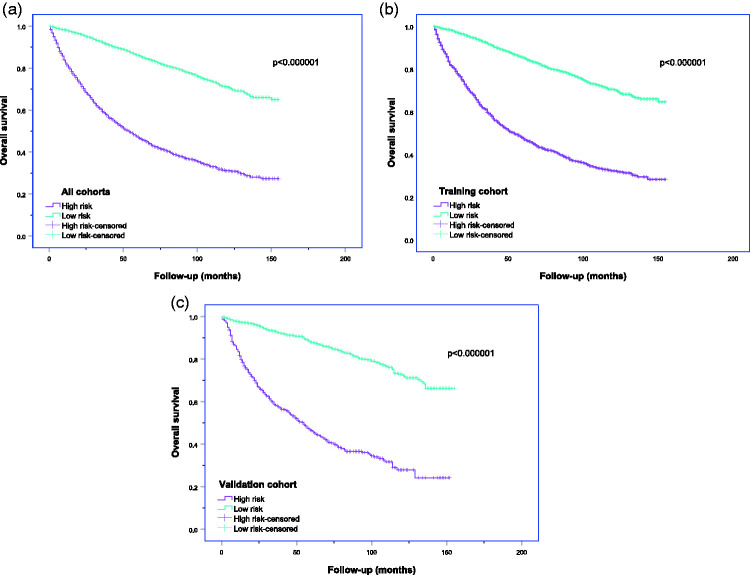
Seventy was the optimal cut-off value for the proposed nomogram, and the Kaplan–Meier curves revealed that the total points in the nomogram > 70 (high-risk group) was significantly correlated with a poor prognosis in both cohorts (Figure 8). The high- and low-risk groups showed significantly different prognoses (log-rank test, P < 0.0001) in both cohorts.
Figure 8.
Kaplan–Meier curves of overall survival for patients with liposarcoma in the high- and low-risk groups. High risk: scores of current nomogram > 70; low risk: scores of current nomogram ≤70; (a) all cohort, (b) training cohort, (c) validation cohort.
Discussion
Decisions regarding systematic treatment strategies in patients with LPS are still considered on a case-by-case basis by a specialist multidisciplinary team. Such decisions should balance the specifics of tumor anatomy and subtype biology with aggressive upfront strategies. Accurate prognostication using a predictive model would thus support therapy recommendations and prognostic counseling. Prediction by an accurate prognostic model would allow clinicians to provide individualized treatment strategies. A satisfactory prognostic nomogram should include substantial indicators (more than 10 variables) and be based on an extensive database (SEER database) to stabilize the model and ensure its predictive accuracy. Nomograms have been used widely to predict individual survival outcomes and calculate the cumulative effect of survival probability.19,20,29 In the current study, we aimed to develop an accurate prediction system using an optimized individual nomogram to predict the 3- and 5-year OS in patients with LPS.
Nomograms have previously been constructed with good C-indexes for LPS or other STS.2,30 However, these nomograms were limited by a lack of relevant studies on OS in LPS patients. Furthermore, relevant variables, including treatment strategies (RT or chemotherapy), SES, and marital status, were not distinguished and developed on the basis of the SEER database.30 The use of more indicators generated from a large database, as in the current study, increased the likelihood of developing a more accurate nomogram.
The AJCC staging system is widely used to predict the OS for all STS patients in clinical practice; however, the system does not show excellent prognostic stratification for LPS patients (C-index 68.20%). Although the eighth edition of the AJCC staging system includes tumor quantity, tumor size, lymph node metastasis, and vascular invasion as new staging parameters, it still fails to address crucial variables such as surgery, chemotherapy, and RT.
Information on the HRs and OS linked to these variables is required as a basis for systematic treatment decision making, including surgical and nonsurgical options (chemotherapy and RT). The current study thus clarified the effects of surgery, RT, and chemotherapy, which are related to the prognosis of LPS patients but which are excluded from the prognostic evaluation of AJCC.
Compared with the traditional AJCC staging system, the C-indexes of the current model showed better discrimination and predictive accuracy for OS in both cohorts. Furthermore, the calibration curves indicated excellent concordance. The DCA curves with higher cut-off probability levels demonstrated that the new model provided superior estimations of decision outcomes (net benefit) compared with the AJCC system in terms of both the 3- and 5-year OS. The novel nomogram was thus ideal for clinical-treatment decision making. Overall, our proposed nomogram for predicting OS in LPS patients represented a major improvement compared with the AJCC system. A more accurate prognostic nomogram is required to incorporate more independent prognostic factors that might contribute to cancer prognosis and assist clinicians in treatment decision making, based on their HRs.31–33 We identified 14 independent variables that were involved in the prognosis of LPS, including 10 indicators, namely, age, site, histology subtypes, grade, chemotherapy, tumor size, extension, first malignant, SES, and AJCC stage, that were associated with a poor prognosis. In contrast, surgery, RT, and marital status displayed a protective effect. Although some risk variables associated with OS in LPS patients, such as primary site,11,34,35 tumor grade,11,34,35 histology subtype,11,34–36 and surgical margin,11,35 have previously been identified, external verification was lacking resulting in lower stability of the results. The clinicopathological variables associated with OS in LPS patients were validated in the present study based on the SEER database. We were therefore able to develop a nomogram with superior predictive accuracy for OS in LPS patients by combining these clinicopathological variables.
The treatment options for LPS include surgery, RT, and chemotherapy.34,36–38 Radical curative treatment consists of wide local excision with a clear surgical margin in localized LPS.5,39–41 The current multivariate analysis identified surgery (HR, 0.34) as a protective factor. However, the role of systematic and nonsurgical treatment in LPS remains contentious, and the roles of RT and chemotherapy in treating localized STS remain unclear.37,42 The results of our research provide treatment options for addressing this problem.
The therapeutic role of RT, including its implementation and effect on OS in LPS patients, is controversial,34 and it has only been proven to reduce the risk of local recurrence.34,43 The present population study showed that RT (HR, 0.78) was a protective factor. Accordingly, we demonstrated that adjuvant RT might help to reduce overall mortality, consistent with a previous study on retroperitoneal sarcomas reviewed by a single institution (HR1, 0.3444; HR2, 0.5545).
Our multivariate analysis indicated that chemotherapy was associated with significantly worse OS. This may be because of the frequent use of conventional chemotherapy (standard cytotoxic agents) in palliative treatment,46,47 and in patients with metastatic or advanced LPS who cannot undergo surgery.48 Chemotherapy itself might thus not be a poor prognostic factor, but it might be administered to patients who already have a poor prognosis. Chemotherapy should thus be chosen carefully in patients with LPS for whom biology-driven therapeutics are an alternative.
This study had some limitations. Targeted therapies for LPS have been developed based on epigenetic deregulation, genetic aberrations, and mechanisms of abnormal adipogenesis in different LPS subtypes.49–52 A new nomogram including variables such as gene expression or experimental tumor biomarkers may thus open another door to perfect the prognosis system.
In summary, we developed a new individualized nomogram integrating multiple independent variables that could be used to predict 3- and 5-year OS in patients with LPS. Evaluation of its predictive performance in the validation cohort indicated that the model had good sensitivity and specificity and the prognosis results were objective, stable, and accurate. The proposed nomogram, including all the histological subtypes, could provide valuable prognostic information to guide suitable treatment strategies (surgical or adjuvant treatment) and counseling strategies to prolong the life expectancy of patients with LPS.
Footnotes
Declaration of conflicting interest: The authors declare that there is no conflict of interest.
Funding: This research received no specific grant from any funding agency in the public, commercial, or not-for-profit sectors.
ORCID iD: Haopeng Li, https://orcid.org/0000-0002-2162-6358
Supplemental material: Supplemental material for this article is available online.
References
- 1.Burns J, Wilding CP, Jones RL, et al. Proteomic research in sarcomas - current status and future opportunities. Semin Cancer Biol 2020; 61: 56–70. [DOI] [PMC free article] [PubMed] [Google Scholar]
- 2.Callegaro D, Miceli R, Mariani L, et al. Soft tissue sarcoma nomograms and their incorporation into practice. Cancer 2017; 123: 2802–2820. [DOI] [PubMed] [Google Scholar]
- 3.Compton ML, Al-Rohil RN. The utility of perilipin in liposarcomas: PLIN1 differentiates round cell liposarcoma from other round cell sarcomas. Appl Immunohistochem Mol Morphol 2020. [DOI] [PubMed] [Google Scholar]
- 4.Dei Tos AP. Liposarcoma: new entities and evolving concepts. Ann Diagn Pathol 2000; 4: 252–266. [DOI] [PubMed] [Google Scholar]
- 5.Lee ATJ, Thway K, Huang PH, et al. Clinical and molecular spectrum of liposarcoma. J Clin Oncol 2018; 36: 151–159. [DOI] [PMC free article] [PubMed] [Google Scholar]
- 6.Fletcher CD. The evolving classification of soft tissue tumours - an update based on the new 2013 WHO classification. Histopathology 2014; 64: 2–11. [DOI] [PubMed] [Google Scholar]
- 7.Huh WW, Yuen C, Munsell M, et al. Liposarcoma in children and young adults: a multi-institutional experience. Pediatr Blood Cancer 2011; 57: 1142–1146. [DOI] [PMC free article] [PubMed] [Google Scholar]
- 8.Jo VY, Fletcher CD. WHO classification of soft tissue tumours: an update based on the 2013 (4th) edition. Pathology 2014; 46: 95–104. [DOI] [PubMed] [Google Scholar]
- 9.Knight JC, Renwick PJ, Dal Cin P, et al. Translocation t(12;16)(q13;p11) in myxoid liposarcoma and round cell liposarcoma: molecular and cytogenetic analysis. Cancer Res 1995; 55: 24–27. [PubMed] [Google Scholar]
- 10.Amin-Mansour A, George S, Sioletic S, et al. Genomic evolutionary patterns of leiomyosarcoma and liposarcoma. Clin Cancer Res 2019; 25: 5135–5142. [DOI] [PMC free article] [PubMed] [Google Scholar]
- 11.Vos M, Koseła-Paterczyk H, Rutkowski P, et al. Differences in recurrence and survival of extremity liposarcoma subtypes. Eur J Surg Oncol 2018; 44: 1391–1397. [DOI] [PubMed] [Google Scholar]
- 12.Hu T, Wang SP, Huang L, et al. A clinical-radiomics nomogram for the preoperative prediction of lung metastasis in colorectal cancer patients with indeterminate pulmonary nodules. Eur Radiol 2019; 29: 439–449. [DOI] [PubMed] [Google Scholar]
- 13.Callegaro D, Miceli R, Bonvalot S, et al. Development and external validation of two nomograms to predict overall survival and occurrence of distant metastases in adults after surgical resection of localised soft-tissue sarcomas of the extremities: a retrospective analysis. Lancet Oncol 2016; 17: 671–680. [DOI] [PubMed] [Google Scholar]
- 14.Maretty-Nielsen K, Aggerholm-Pedersen N, Safwat A, et al. Prognostic factors for local recurrence and mortality in adult soft tissue sarcoma of the extremities and trunk wall: a cohort study of 922 consecutive patients. Acta Orthop 2014; 85: 323–332. [DOI] [PMC free article] [PubMed] [Google Scholar]
- 15.Van Praag VM, Rueten-Budde AJ, Jeys LM, et al. A prediction model for treatment decisions in high-grade extremity soft-tissue sarcomas: Personalised sarcoma care (PERSARC). Eur J Cancer 2017; 83: 313–323. [DOI] [PubMed] [Google Scholar]
- 16.Gronchi A, Lo Vullo S, Colombo C, et al. Extremity soft tissue sarcoma in a series of patients treated at a single institution. Ann Surg 2010; 251: 506–511. [DOI] [PubMed] [Google Scholar]
- 17.Movva S, Von Mehren M, Ross EA, et al. Patterns of chemotherapy administration in high-risk soft tissue sarcoma and impact on overall survival. J Natl Compr Canc Netw 2015; 13: 1366–1374. [DOI] [PubMed] [Google Scholar]
- 18.Patel S, Von Mehren M, Reed DR, et al. Overall survival and histology-specific subgroup analyses from a phase 3, randomized controlled study of trabectedin or dacarbazine in patients with advanced liposarcoma or leiomyosarcoma. Cancer 2019; 125: 2610–2620. [DOI] [PMC free article] [PubMed] [Google Scholar]
- 19.Anaya DA, Lahat G, Wang X, et al. Postoperative nomogram for survival of patients with retroperitoneal sarcoma treated with curative intent. Ann Oncol 2010; 21: 397–402. [DOI] [PubMed] [Google Scholar]
- 20.Cahlon O, Brennan MF, Jia X, et al. A postoperative nomogram for local recurrence risk in extremity soft tissue sarcomas after limb-sparing surgery without adjuvant radiation. Ann Surg 2012; 255: 343–347. [DOI] [PMC free article] [PubMed] [Google Scholar]
- 21.Gronchi A, Miceli R, Shurell E, et al. Outcome prediction in primary resected retroperitoneal soft tissue sarcoma: histology-specific overall survival and disease-free survival nomograms built on major sarcoma center data sets. J Clin Oncol 2013; 31: 1649–1655. [DOI] [PubMed] [Google Scholar]
- 22.Doll KM, Rademaker A, Sosa JA. Practical guide to surgical data sets: Surveillance, Epidemiology, and End Results (SEER) database. JAMA Surg 2018; 153: 588–589. [DOI] [PubMed] [Google Scholar]
- 23.Samuel S, Mukherjee S, Ammannagari N, et al. Clinicopathological characteristics and outcomes of rare histologic subtypes of gallbladder cancer over two decades: A population-based study. PLoS One 2018; 13: e0198809. [DOI] [PMC free article] [PubMed] [Google Scholar]
- 24.Yao JC, Hassan M, Phan A, et al. One hundred years after “carcinoid”: epidemiology of and prognostic factors for neuroendocrine tumors in 35,825 cases in the United States. J Clin Oncol 2008; 26: 3063–3072. [DOI] [PubMed] [Google Scholar]
- 25.Song K, Song J, Shi X, et al. Development and validation of nomograms predicting overall and cancer-specific survival of spinal chondrosarcoma patients. Spine (Phila Pa 1976) 2018; 43: E1281–E1289. [DOI] [PubMed] [Google Scholar]
- 26.Chen Y, Xu L, Mayakonda A, et al. Bromodomain and extraterminal proteins foster the core transcriptional regulatory programs and confer vulnerability in liposarcoma. Nat Commun 2019; 10: 1353. [DOI] [PMC free article] [PubMed] [Google Scholar]
- 27.Chen SY, Yang Y, Qi SN, et al. Validation of nomogram-revised risk index and comparison with other models for extranodal nasal-type NK/T-cell lymphoma in the modern chemotherapy era: indication for prognostication and clinical decision-making. Leukemia 2020. [DOI] [PMC free article] [PubMed] [Google Scholar]
- 28.Zhou W, Huang C, Yuan N. Prognostic nomograms based on log odds of positive lymph nodes for patients with renal cell carcinoma: A retrospective cohort study. Int J Surg 2018; 60: 28–40. [DOI] [PubMed] [Google Scholar]
- 29.Ogura K, Fujiwara T, Yasunaga H, et al. Development and external validation of nomograms predicting distant metastases and overall survival after neoadjuvant chemotherapy and surgery for patients with nonmetastatic osteosarcoma: A multi-institutional study. Cancer 2015; 121: 3844–3852. [DOI] [PMC free article] [PubMed] [Google Scholar]
- 30.Bagaria SP, Wagie AE, Gray RJ, et al. Validation of a soft tissue sarcoma nomogram using a national cancer registry. Ann Surg Oncol 2015; 22: S398–S403. [DOI] [PubMed] [Google Scholar]
- 31.Gong Y, Ji P, Sun W, et al. Development and validation of nomograms for predicting overall and breast cancer-specific survival in young women with breast cancer: a population-based study. Transl Oncol 2018; 11: 1334–1342. [DOI] [PMC free article] [PubMed] [Google Scholar]
- 32.Song K, Song J, Chen F, et al. Prognostic nomograms for predicting overall and cancer-specific survival of high-grade osteosarcoma patients. J Bone Oncol 2018; 13: 106–113. [DOI] [PMC free article] [PubMed] [Google Scholar]
- 33.Zhang J, Gong Z, Gong Y, et al. Development and validation of nomograms for prediction of overall survival and cancer-specific survival of patients with Stage IV colorectal cancer. Jpn J Clin Oncol 2019; 49: 438–446. [DOI] [PMC free article] [PubMed] [Google Scholar]
- 34.Crago AM, Dickson MA. Liposarcoma: Multimodality Management and Future Targeted Therapies. Surg Oncol Clin N Am 2016; 25: 761–773. [DOI] [PMC free article] [PubMed] [Google Scholar]
- 35.Vos M, Boeve WC, Van Ginhoven TM, et al. Impact of primary tumor location on outcome of liposarcoma patients, a retrospective cohort study. Eur J Surg Oncol 2019; 45: 2437–2442. [DOI] [PubMed] [Google Scholar]
- 36.Suarez-Kelly LP, Baldi GG, Gronchi A. Pharmacotherapy for liposarcoma: current state of the art and emerging systemic treatments. Expert Opin Pharmacother 2019; 20: 1503–1515. [DOI] [PubMed] [Google Scholar]
- 37.Guadagnolo BA, Zagars GK, Ballo MT, et al. Excellent local control rates and distinctive patterns of failure in myxoid liposarcoma treated with conservation surgery and radiotherapy. Int J Radiat Oncol Biol Phys 2008; 70: 760–765. [DOI] [PubMed] [Google Scholar]
- 38.Kosela-Paterczyk H, Szumera-Ciećkiewicz A, Szacht M, et al. Efficacy of neoadjuvant hypofractionated radiotherapy in patients with locally advanced myxoid liposarcoma. Eur J Surg Oncol 2016; 42: 891–898. [DOI] [PubMed] [Google Scholar]
- 39.Crago AM, Singer S. Clinical and molecular approaches to well differentiated and dedifferentiated liposarcoma. Curr Opin Oncol 2011; 23: 373–378. [DOI] [PMC free article] [PubMed] [Google Scholar]
- 40.Thway K, Jones RL, Noujaim J, et al. Dedifferentiated liposarcoma: updates on morphology, genetics, and therapeutic strategies. Adv Anat Pathol 2016; 23: 30–40. [DOI] [PubMed] [Google Scholar]
- 41.Mansfield SA, Pollock RE, Grignol VP. Surgery for abdominal well-differentiated liposarcoma. Curr Treat Options Oncol 2018; 19: 1. [DOI] [PubMed] [Google Scholar]
- 42.Zheng K, Yu XC, Xu M, et al. Surgical outcomes and prognostic factors of myxoid liposarcoma in extremities: a retrospective study. Orthop Surg 2019; 11: 1020–1028. [DOI] [PMC free article] [PubMed] [Google Scholar]
- 43.Haas RLM, Bonvalot S, Miceli R, et al. Radiotherapy for retroperitoneal liposarcoma: A report from the Transatlantic Retroperitoneal Sarcoma Working Group. Cancer 2019; 125: 1290–1300. [DOI] [PMC free article] [PubMed] [Google Scholar]
- 44.Bonvalot S, Rivoire M, Castaing M, et al. Primary retroperitoneal sarcomas: a multivariate analysis of surgical factors associated with local control. J Clin Oncol 2009; 27: 31–37. [DOI] [PubMed] [Google Scholar]
- 45.Gronchi A, Lo Vullo S, Fiore M, et al. Aggressive surgical policies in a retrospectively reviewed single-institution case series of retroperitoneal soft tissue sarcoma patients. J Clin Oncol 2009; 27: 24–30. [DOI] [PubMed] [Google Scholar]
- 46.Livingston JA, Bugano D, Barbo A, et al. Role of chemotherapy in dedifferentiated liposarcoma of the retroperitoneum: defining the benefit and challenges of the standard. Sci Rep 2017; 7: 11836. [DOI] [PMC free article] [PubMed] [Google Scholar]
- 47.Saponara M, Stacchiotti S, Gronchi A. Pharmacological therapies for Liposarcoma. Expert Rev Clin Pharmacol 2017; 10: 361–377. [DOI] [PubMed] [Google Scholar]
- 48.Chamberlain FE, Wilding C, Jones RL, et al. Pazopanib in patients with advanced intermediate-grade or high-grade liposarcoma. Expert Opin Investig Drugs 2019; 28: 505–511. [DOI] [PubMed] [Google Scholar]
- 49.Anderson WJ, Jo VY. Pleomorphic liposarcoma: Updates and current differential diagnosis. Semin Diagn Pathol 2019; 36: 122–128. [DOI] [PubMed] [Google Scholar]
- 50.Bill KL, Casadei L, Prudner BC, et al. Liposarcoma: molecular targets and therapeutic implications. Cell Mol Life Sci 2016; 73: 3711–3718. [DOI] [PMC free article] [PubMed] [Google Scholar]
- 51.Liu J, Li R, Liao X, et al. Comprehensive bioinformatic analysis genes associated to the prognosis of liposarcoma. Med Sci Monit 2018; 24: 7329–7339. [DOI] [PMC free article] [PubMed] [Google Scholar]
- 52.Mazzu YZ, Hu Y, Soni RK, et al. miR-193b-regulated signaling networks serve as tumor suppressors in liposarcoma and promote adipogenesis in adipose-derived stem cells. Cancer Res 2017; 77: 5728–5740. [DOI] [PubMed] [Google Scholar]


