Abstract
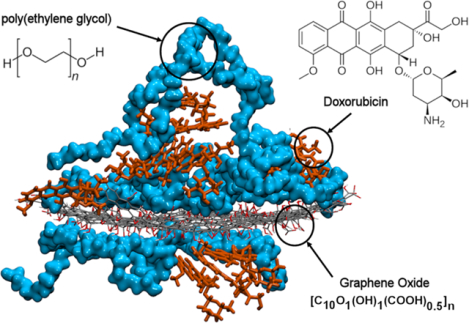
Molecular dynamics (MD) simulations were performed to investigate the loading and dynamics of doxorubicin (DOX) anticancer drug on graphene oxide (GO) and poly(ethylene glycol) (PEG) decorated GO (PEGGO) nanocarriers in an aqueous environment at human body temperature (310 K) and physiological pH level of 7.4. Mechanisms of DOX adsorption on PEGGO as a function of PEG chain length were revealed. While the total DOX-nanocarrier interaction energy was the same for the DOX/GO (control), DOX/Sh-PEGGO (short PEG chains consisting of 15 repeat units), and DOX/L-PEGGO (long PEG chains consisting of 30 repeat units) within the margin of error, the PEG-DOX interactions increased with an increase in the PEG chain length. At the same time, the PEG-DOX solvent-accessible contact area almost doubled going from the short to long PEG chains. PEGylation of the GO effectively causes an increase in the average water density around the nanocarrier, which can act as a barrier, leading to the DOX migration to the solvated PEG-free part of the GO surface. This effect is more pronounced for shorter PEG chains. The DOX-DOX solvent-accessible contact area is smaller in the DOX/GO system, which means the drug molecules are less aggregated in this system. However, the level of DOX aggregation is slightly higher for the PEGGO systems. The computational results in this work shed light on the fact that increasing the PEG chain length benefits DOX loading on the nanocarrier, revealing an observation that is difficult to acertain through experiments. Moreover, a detailed picture is provided for the DOX adsorption and retention in PEGGO drug delivery systems, which would enable the researchers to improve the drug’s circulation time, as well as its delivery and targeting efficiency.
Keywords: Doxorubicin, drug loading, loading dynamics, PEGylated graphene oxide, molecular dynamics simulation
Graphical Abstract
1. INTRODUCTION
In the last two decades, much research has focused on using nanotechnology for cancer treatment,1–8 including design of nanocarriers for efficient tumor-targeted delivery of anticancer drugs.9–18 The main objective in nanoparticle-based anticancer drug delivery has been to design nanocarriers with high drug loading capacity that would deliver the drug exclusively to the solid tumor site, thereby, significantly decreasing its unwanted side effects.17–19 Drug loading onto nanocarriers involves either physical or chemical bonding of the drug molecules to the accessible nanocarrier surface.20–24 Depending on the nature of drug-nanocarrier bonding, challenges to the efficient drug delivery to the tumor site are very different. For example, the chemically-bound drugs on nanocarriers are more stable in the human body, while the physically-bound drugs (passively loaded), especially those that are surface-adsorbed on the nanocarriers, may be negatively affected by interactions with, e.g., blood components during their circulation and distribution in the body. These interactions can cause premature drug release into the blood stream; therefore, a deeper understanding of drug-nanocarrier interactions plays a pivotal role in designing more efficient and robust drug delivery systems.
Graphene oxide (GO),25 a two-dimensional single-layer carbon sheet decorated with oxygen-containing functional groups, has been shown to be a suitable carrier for drug molecules, both on its extended surface and on the edges through both covalent and noncovalent interactions.26 The basal plane of the GO sheet provides π-π interactions with drug molecules, while its functional groups, including hydroxyl, epoxy, and carboxyl groups, promote strong electrostatic and hydrogen bonding drug-nanocarrier interactions.27,28 These noncovalent interactions are widely exploited in drug delivery applications.20 Moreover, the GO functional groups provide potential moieties for covalent bonding with drug molecules.29
In addition to the drug loading capacity of GO, the circulation time of the drug/nanocarrier complex in the blood stream30 is another important parameter to consider for efficient drug delivery and targeting. Drug-loaded GO nanocarriers deliver the drug molecules to the solid tumor site by way of enhanced permeability and retention (EPR) effect.31–33 Based on this effect, the leaky vasculature of the tumor site facilitates the extravasation of nanoparticles with sizes smaller than 100 nm from the plasma into the tumor site, as well as their retention in the tumor tissue after penetration.34 A crucial aspect of the EPR effect is its time dependence.35 This means that, to take full advantage of the EPR effect and to maximize the drug targeting efficiency, the drug-loaded nanocarriers need to remain in plasma for a relatively long period of time in order for their sufficient extravasation into the tumors.
Decorating the surface of the nanocarrier with chains of a hydrophilic polymer, such as polyethylene glycol (PEG),36 is the most common way to extend the circulation time of the drug/nanocarrier complex.37 Many researchers have published reports on the use of PEG-decorated GO (PEGGO) in biological applications.34,37–40 For example, Miao et al.39 investigated the potential use of PEGGO as a co-delivery system for chlorin e6 (Ce6) and doxorubicin (DOX). They compared in vitro cytotoxicity and in vivo safety of GO versus those of PEGGO, reporting that in vivo safety of PEGGO is much higher than that of GO.39 Furthermore, the loading efficiency of Ce6 and DOX on PEGGO is reported to be more than 50%.39 It was speculated that the observed high drug loading capacity of PEGGO might be attributed to a large aromatic surface area of these drugs, which facilitates the π-π and hydrophobic drug-nanocarrier interactions. In another study by Zeng et al.,37 a method was introduced to obtain stable dispersed PEGGO to deliver Ce6 as a photosensitizer. They investigated the effect of PEG chain length on the stability of PEGGO and showed that PEGGO with short PEG chains tends to aggregate. On the contrary, long PEG chains were suggested to provide more stable PEGGO solutions. However, they did not investigate the effect of PEG chain length on drug loading. They further characterized the interactions between Ce6 and PEGGO, and reported that these interactions were noncovalent in nature, occurring predominantly between Ce6 and the aromatic portion of the PEGGO.
Despite valuable research on the use of PEGGO as a nanocarrier for various drug delivery systems, the effects of PEGylation on drug adsorption are still not well understood. In this study, molecular dynamics (MD) simulation was used to investigate, at an atomic level, the loading mechanisms of DOX on PEGGO as a function of PEG chain length. Overall, the objective here was to reveal the energetics and structural details of drug adsorption on the nanocarriers. The computational results in this study provide a detailed picture of drug adsorption and retention in PEGGO drug delivery systems, which can be used for increasing their circulation time and correspondingly their delivery and targeting efficiency.
COMPUTATIONAL DETAILS
Molecular Models.
Structures of finite GO and PEGGO sheets, as well as DOX, were built in BIOVIA Materials Studio (v8.0). To build a GO sheet, the top and bottom surfaces of a pristine graphene sheet (size: 40×40 Å2) were randomly decorated with hydroxyl (-OH) and epoxide (-O) functional groups,27,41,42 while carboxylic acid groups (-COOH) were added to the edges of the sheets.27,41–44 The carbon-to-epoxide, carbon-to-hydroxyl, and carbon-to-carboxylic acid ratios were C10O1(OH)1(COOH)0.5. This molecular configuration is widely used to represent GO.43 The protonation states of the functional groups were set according to the pH level of 7.4, representing the physiological pH level of plasma. To prepare the PEGGO structures, six chains of short PEG chains (molecular length corresponding to 15 repeat units) were covalently attached through an amide linkage to the GO sheet (one on each of the two sheet surfaces, and one on each of the four edges) to obtain the short-PEGGO (labeled as Sh-PEGGO).44 Longer PEG chains (30 repeat units) were also used to model the long-PEGGO (L-PEGGO).
The prepared models were geometry-optimized using the Dreiding force field45 and charge-equilibrated using the Gasteiger charges routine.43 The topology and force field parameter files for DOX were retrieved from the SwissParam web interface, which in turn derives the parameters from the Merck Molecular Force Field (MMFF).46 These files are provided for DOX and protonated DOX in Supporting Information. Next, the equilibrium structures were exported to the Visual Molecular Dynamics (VMD) software.47 The PEGGO structures were placed in a simulation cell, packed with TIP3P water molecules,48 and an NPT (constant number atoms, N; constant pressure, P; constant temperature, T) simulation was run for 20 ns at 310 K (human body temperature) and 1 atm using NAMD (v2.12)49 to equilibrate the PEG chain conformations on the GO sheets. Parameters for GO and PEGGO were extracted from the general CHARMM36 force field (CGENFF).50,51 The same force field parameters have been used by other researchers in the past for similar work, including that of Luo et al.44 The force field parameter files for DOX and protonated DOX, CGENFF (bonded and nonbonded) parameters,50 and bonded parameters for the PEG-GO linkage44 are provided in the Supplementary Information section. The time step, cut-off distance for long-range interactions, and switching distance for short-range interactions were 2 fs, 12 Å, and 10 Å, respectively. These same parameters were used for the subsequent simulations described in Analysis.
Next, the equilibrated GO and PEGGO structures were used to build three drug delivery systems, i.e., DOX/GO, DOX/Sh-PEGGO, and DOX/L-PEGGO. In each system, the nanocarrier was placed in the middle of a simulation cell surrounded by10 DOX molecules, evenly placed on the two sides of the nanocarrier (five drugs on each side), at an initial distance of 20 Å from the nanocarrier surface. Next, TIP3P water molecules48 were packed around the drug/nanocarrier complexes such that the distance between outermost atoms in the drug/nanocarrier complex and the boundary of the created simulation box was 10 Å. The solvated systems were neutralized by adding sodium ions to the systems. For illustration purposes, a representative initial structure for the DOX/Sh-PEGGO system is shown in Figure 1. Structural details of the three drug delivery systems are given in Table 1.
Figure 1.
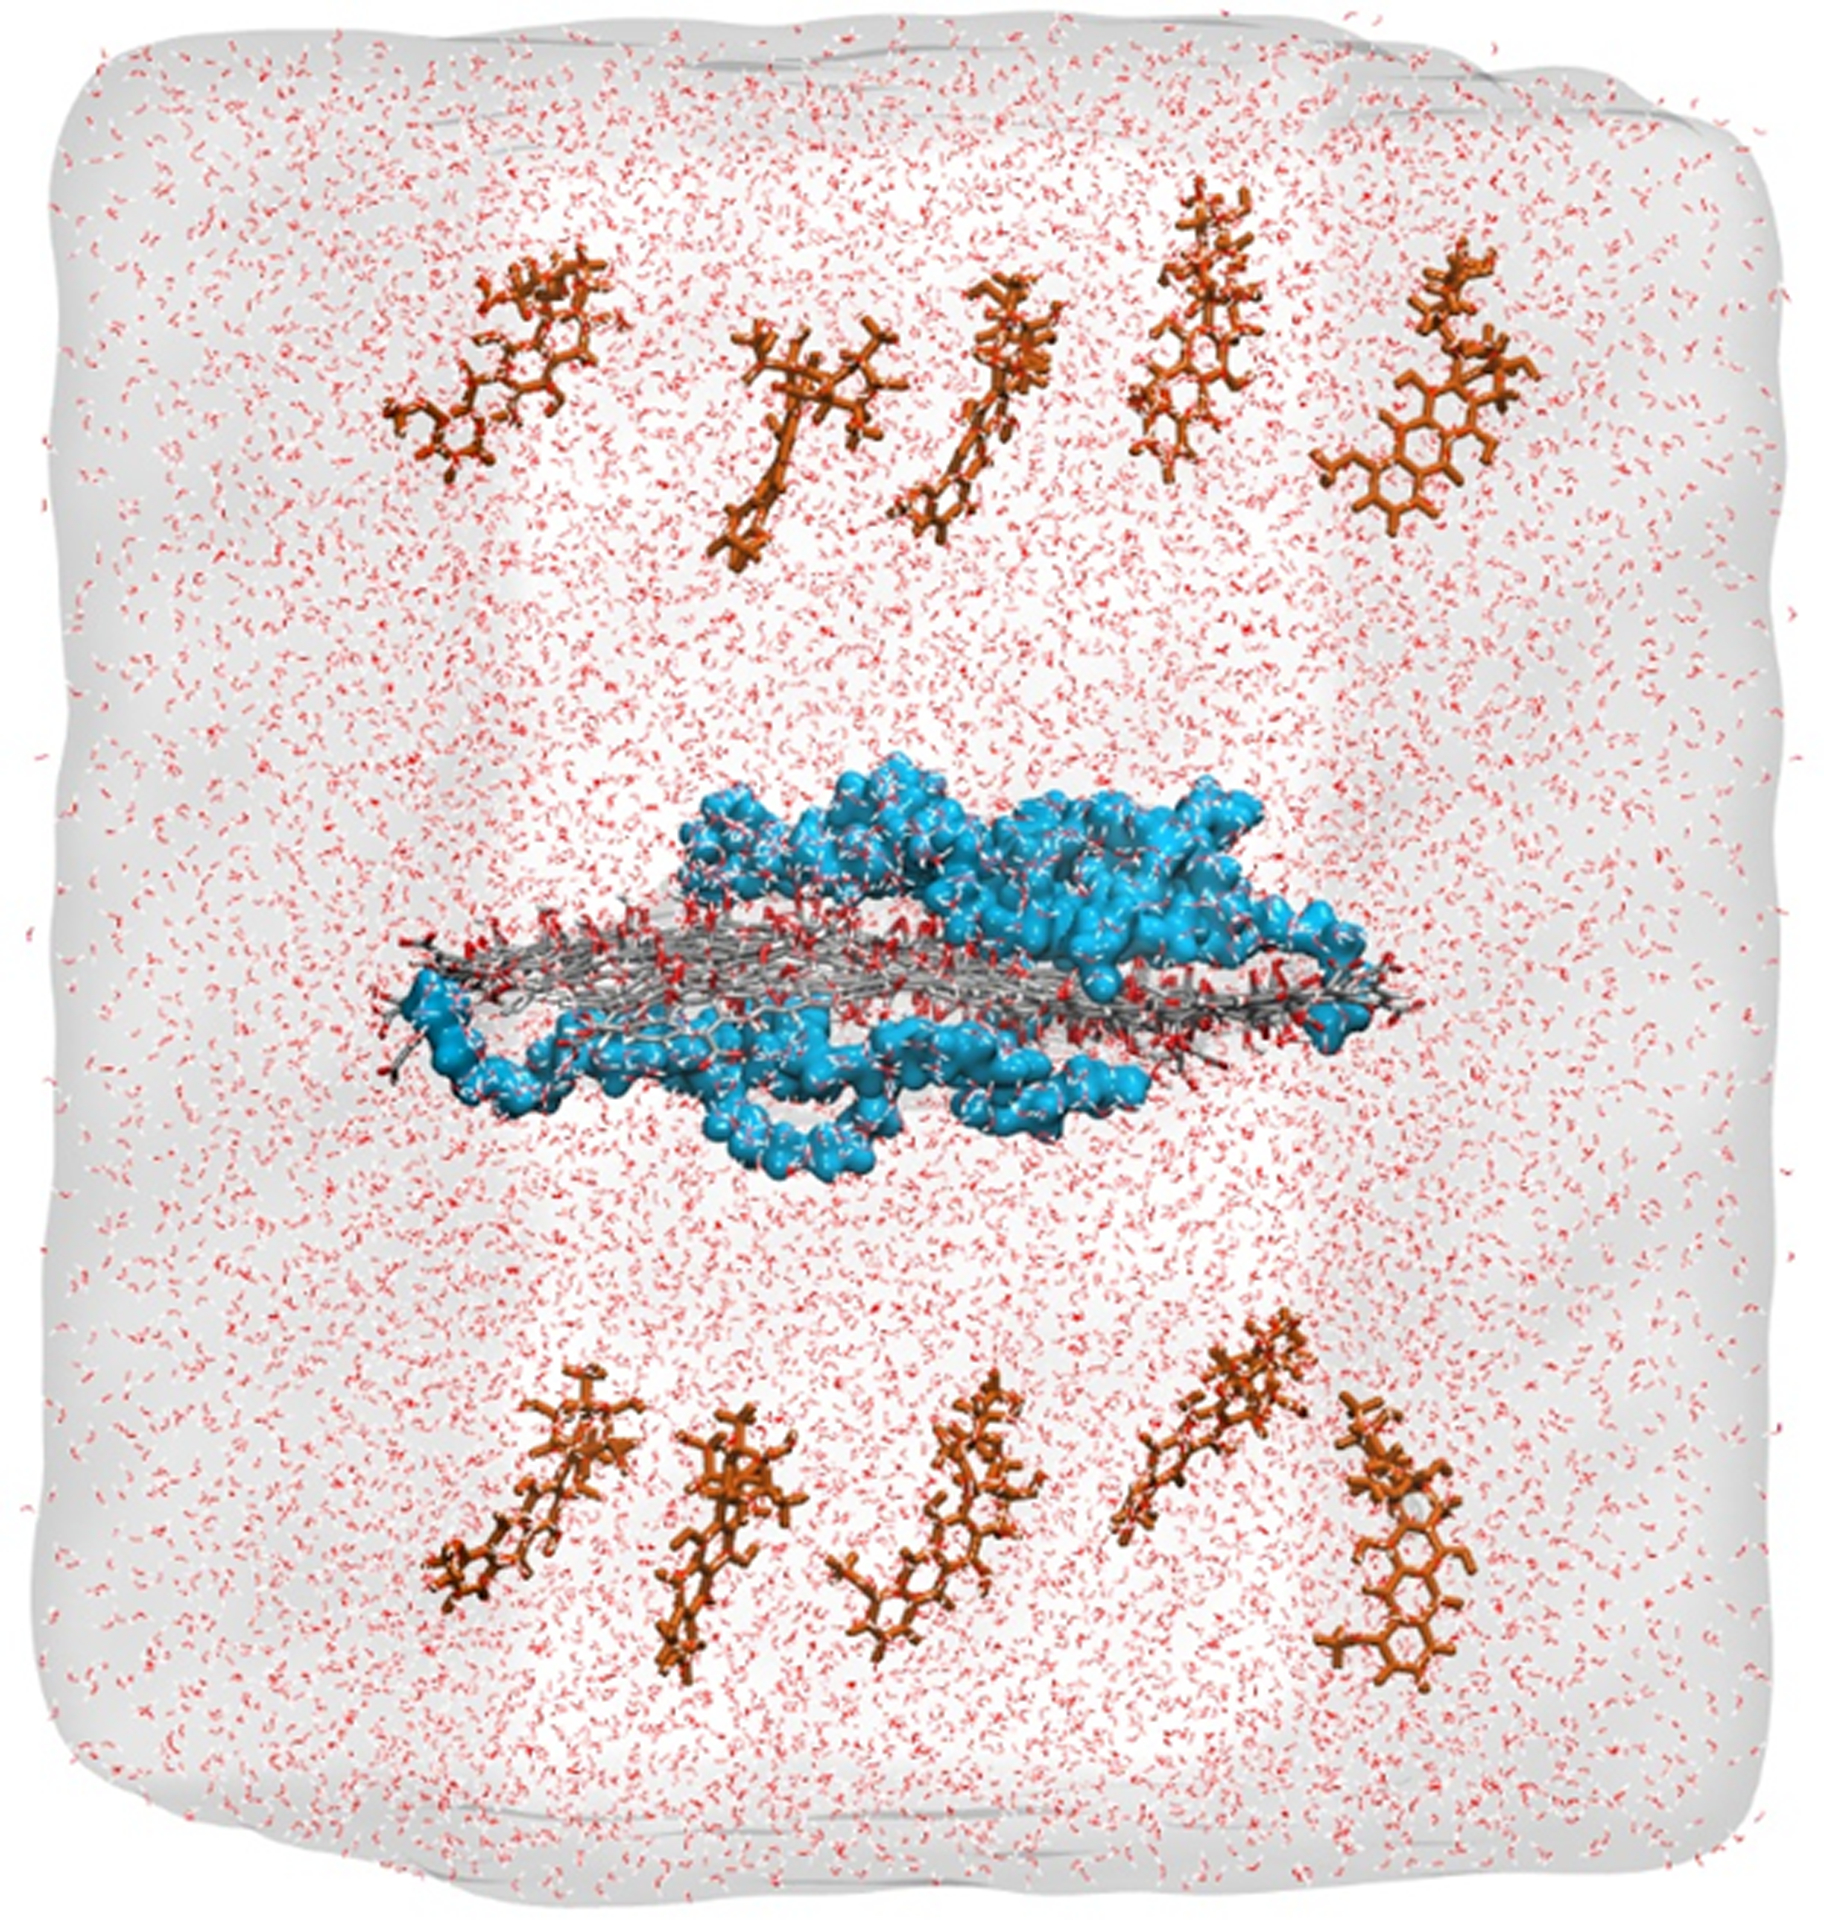
A representative initial configuration of the solvated DOX/Sh-PEGGO system. DOX molecules (brown) are shown distributed on both sides of the PEGGO sheet in the middle of the cell. PEG chains on the GO sheet are shown as blue spheres. The GO carbon and oxygen atoms are shown in gray and red, respectively.
Table 1.
Structural details of the drug delivery systems used in this work.
| System | Number of Molecules | Cell Size (Å3) | ||
|---|---|---|---|---|
| Nanocarrier | DOX | Water | ||
| DOX/GO | 1 | 10 | 14,740 | 75×70×95 |
| DOX/Sh-PEGGO | 1 | 10 | 14,386 | 75×70×95 |
| DOX/L-PEGGO | 1 | 10 | 23,892 | 93×91×95 |
Simulation.
To improve statistics, all MD simulations were replicated four times, and the results were time-averaged and, for certain reported metrics, averaged over the four replicates. The following describes the simulation procedure for all systems:
First, a 1,000-step minimization was performed. Next, an NPT simulation was run at 310 K and 1 atm for 30 ns. This simulation time was found to be sufficient to reach an equilibrium DOX adsorption on the nanocarriers (discussed later). The temperature and pressure were controlled using the Langevin thermostat and barostat, respectively.52 Electrostatic long-range interactions were computed using the particle mesh Ewald (PME) method.53 The equilibration criterion for the drug delivery systems was established based on the number of adsorbed DOX molecules on the nanocarriers, root-mean-square deviation (RMSD) of the DOX molecular positions, and GO-DOX contact area (see Analysis).
Analysis.
The energy components of the systems were saved every 200 ps, where van der Waals (vdW), electrostatic, and total GO-DOX and PEG-DOX interaction energies were calculated using the NAMD Energy Plugin. The reported interaction energies were calculated by time-averaging over the last 2 ns of all four replicate simulations. Also, standard deviations of the data (error estimates) were calculated using the same set of data as those used to calculate the average interaction energy values. Because of the possibility of the existence of different drug-nanocarrier interaction sites in the different replicate simulations, the above large sample size was used to calculate the standard deviations.
The radial distribution function (RDF)54 of the DOX molecules around the GO sheets were determined for all systems by time-averaging the data for the last 2 ns of the simulations. The final average RDF values for each drug/nanocarrier system were calculated based on the averaging of the data obtained for the four replicates.
The time-varying number of adsorbed DOX molecules on the GO surface was calculated based on the following adsorption criterion: each drug molecule with at least one atom within a distance of 5 Å from the GO surface is considered adsorbed. This distance is based on the RDF results for the DOX/GO system, which is discussed later. Calculations were made every 2 ns of the total simulation time.
In this work, a hydration layer is defined,55 which surrounds the accessible GO and/or PEG chains. This layer is considered to act as a barrier to the DOX-GO and DOX-PEG interactions. The average water density in this hydration layer () was calculated by counting the number of water oxygen atoms within a 5-Å layer around the nanocarriers (GO surface and PEG chains) and dividing this number by the volume of the layer. To calculate the volume of the layer, Connolly’s solvent-accessible surface area (SASA)56 of the nanocarrier was computed for four sublayers, starting at a distance of ~1.4 Å from the nanocarrier surface (vdW radius of water57) and summing up the sublayer volumes (the first sublayer has a thickness of 0.5 Å, while the subsequent sublayers are 1-Å thick). The simplistic SASA algorithm implemented in VMD47 uses Monte Carlo sampling to estimate the accessible surface area.
The RMSD of DOX and PEG molecular positions relative to their initial positions were calculated every 200 ps using the RMSD trajectory tool of VMD.47 The evolution of GO-PEG contact areas were calculated using SASA. For this purpose, the SASA of GO sheet, PEG chains, and the GO-PEG complex were first computed for each frame of the trajectory and next, the GO-PEG contact area was calculated using the following formula:58
| (1) |
where SASAGO and SASAPEG are the SASA of the GO sheet and PEG chains, respectively, and SASAGO−PEG is the SASA of the GO-PEG complex. The same method was used to calculate the GO-DOX and DOX-PEG contact areas.
To evaluate DOX self-aggregation, the time-varying DOX-DOX contact area was calculated using the following formula:
| (2) |
where SASADOX(0) is the initial SASA of the DOX molecules at t = 0. In the initial (non-aggregated) state, all drug molecules are separated and there is no contact between them. SASADOX(t) is the SASA of DOX molecules at time t.
RESULTS AND DISCUSSION
Representative final configurations of the simulated DOX-loaded systems are shown in Figure 2. In the DOX/GO system (Figure 2a), all the GO surface is accessible for the DOX loading, which leads to a uniform DOX adsorption pattern on the nanocarrier with a minimal DOX self-aggregation (a discussion on the DOX self-aggregation based on the contact area follows later). In the DOX/Sh-PEGGO system, a reduced accessible GO surface leads to the migration of the DOX molecules to the edges of the GO sheet upon adsorption, where the majority of DOX molecules interact with the prevalent carboxylic acid functional groups. Furthermore, an increase in the DOX self-aggregation is observed. In this system, only a small number of DOX molecules interact with the PEG chains.
Figure 2.
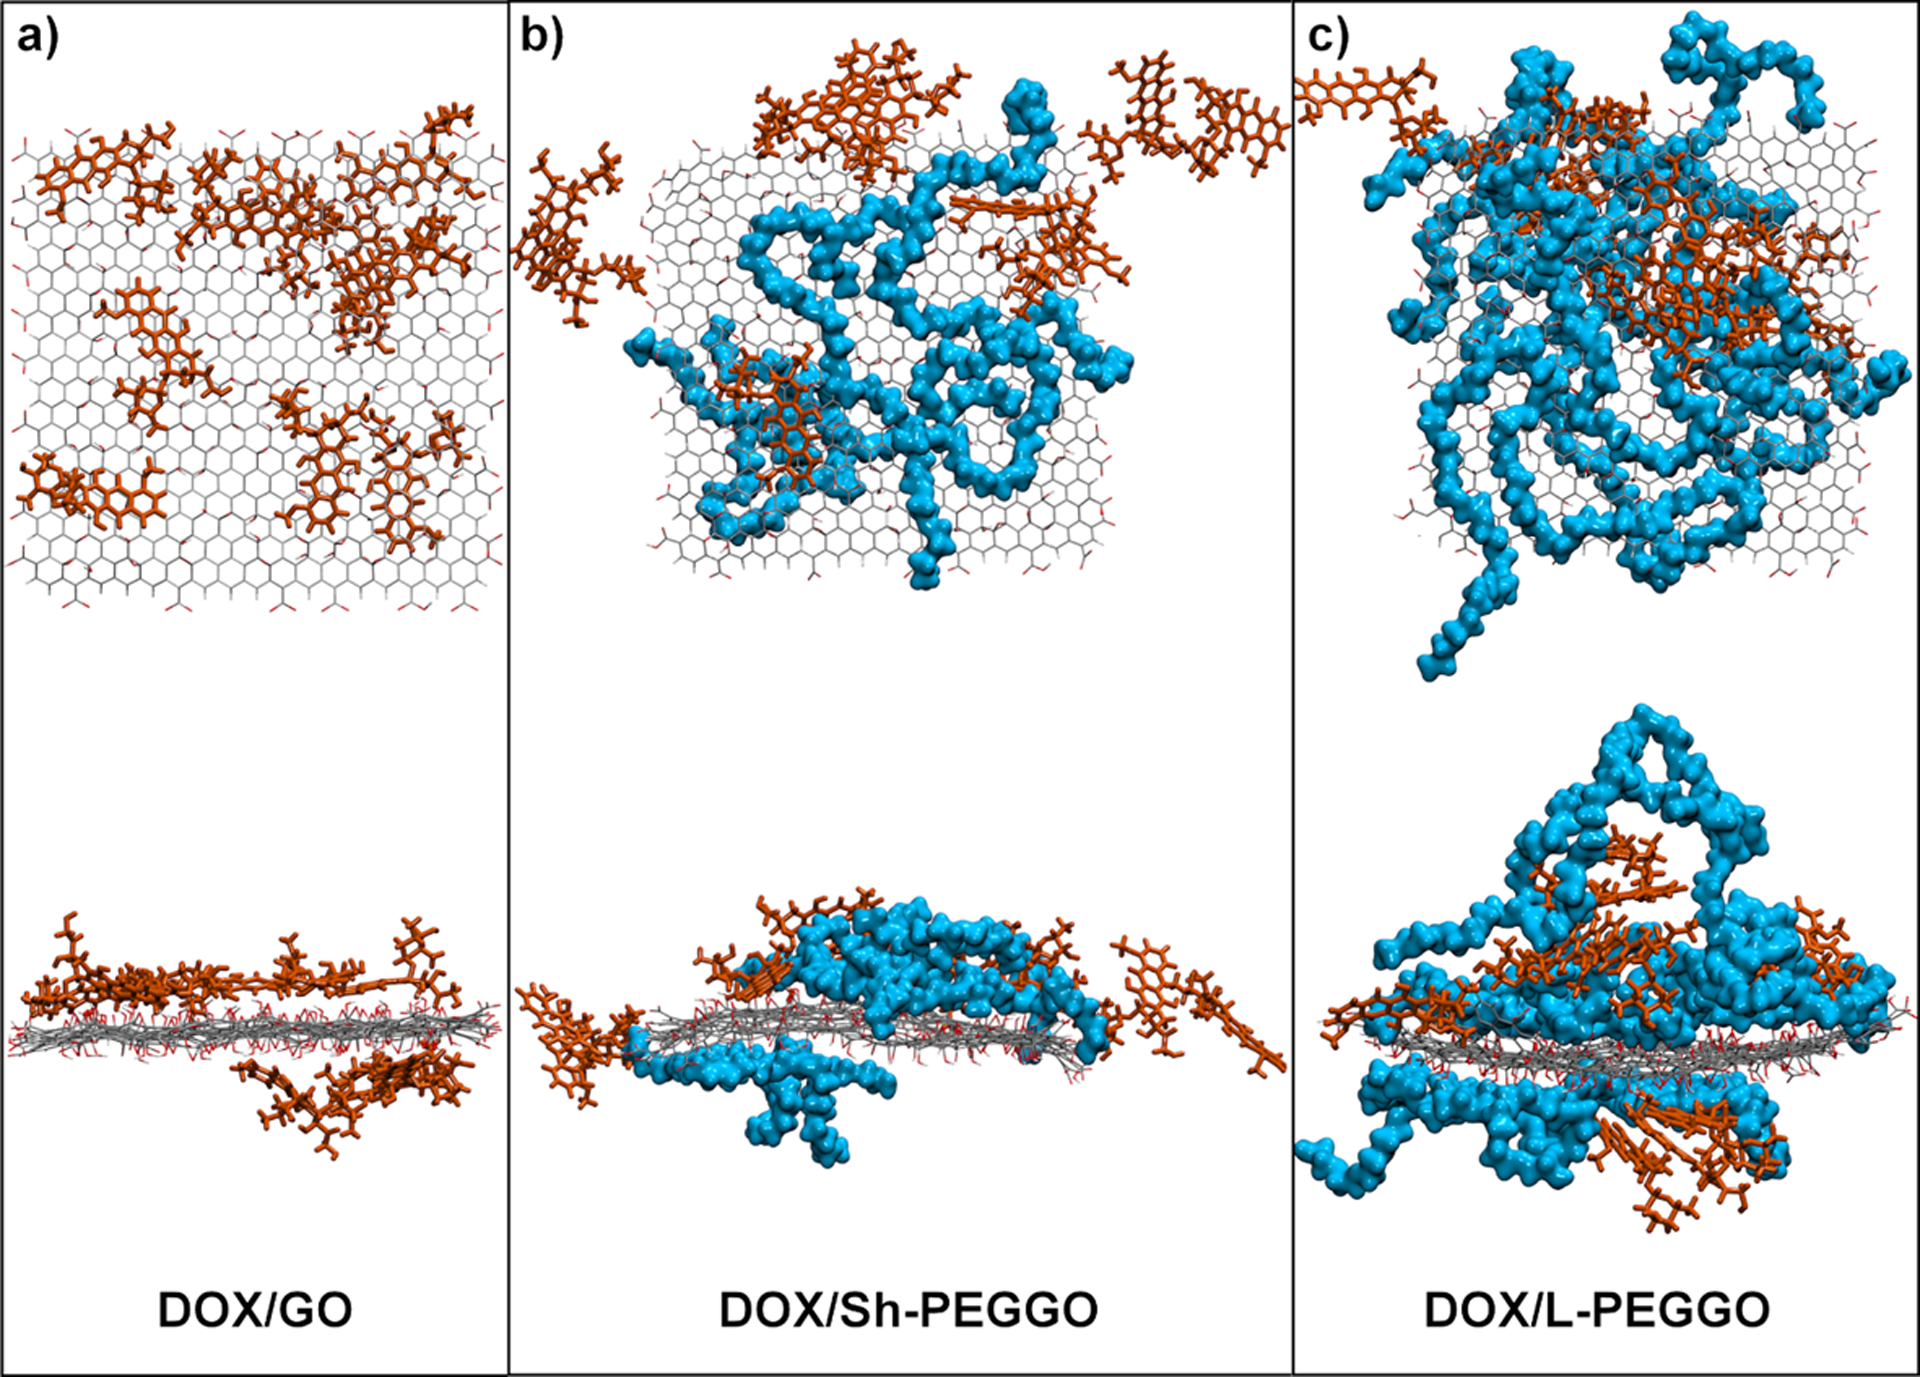
Representative final configurations of a) DOX/GO, b) DOX/Sh-PEGGO, and c) DOX/L-PEGGO after 30 ns of simulation. Top and bottom panels show top and side views of the systems. The DOX molecules are drawn as brown sticks, while the PEG chains are drawn as blue spheres. The GO sheet (thin lines) is drawn with carbon and oxygen atoms in gray and red, respectively. For clarity, the water molecules are excluded from the illustrations.
The van der Waals (vdW), electrostatic, and total GO-DOX and PEG-DOX interaction energies, as well as the contact area for the DOX molecules with the GO surface, PEG chains, and other DOX molecules (time-averaged over the last 2 ns of the simulations) are given in Figure 3. It should be noted here that the average interaction energy values and standard deviations are associated with the data obtained from all four replicate runs, as mentioned before. Since both the GO sheets and DOX molecules have several functional groups that can potentially participate in intermolecular interactions, different values are expected for the calculated electrostatic and total interaction energies (Figures 3a–3c) in the different replicate runs, depending on which functional groups are involved. While the total nanocarrier-DOX interaction energies remain the same (within the margin of error) for the three DOX/GO, DOX/Sh-PEGGO, and DOX/L-PEGGO systems, there is a clear shift in the contributions of the GO-DOX and PEG-DOX interactions to the vdW, electrostatic, and total interaction energies. DOX molecules in the DOX/Sh-PEGGO system still tend to interact more with the GO surface rather than the PEG chains, as evident from the GO-DOX electrostatic interactions being negligible and the total PEG-DOX interactions being too small in contrast to the corresponding interaction energies in the DOX/GO system (Figure 3a, 3b and 3c). This tendency is also confirmed by comparing the larger GO-DOX to the smaller PEG-DOX contact area in Figure 3d.
Figure 3.
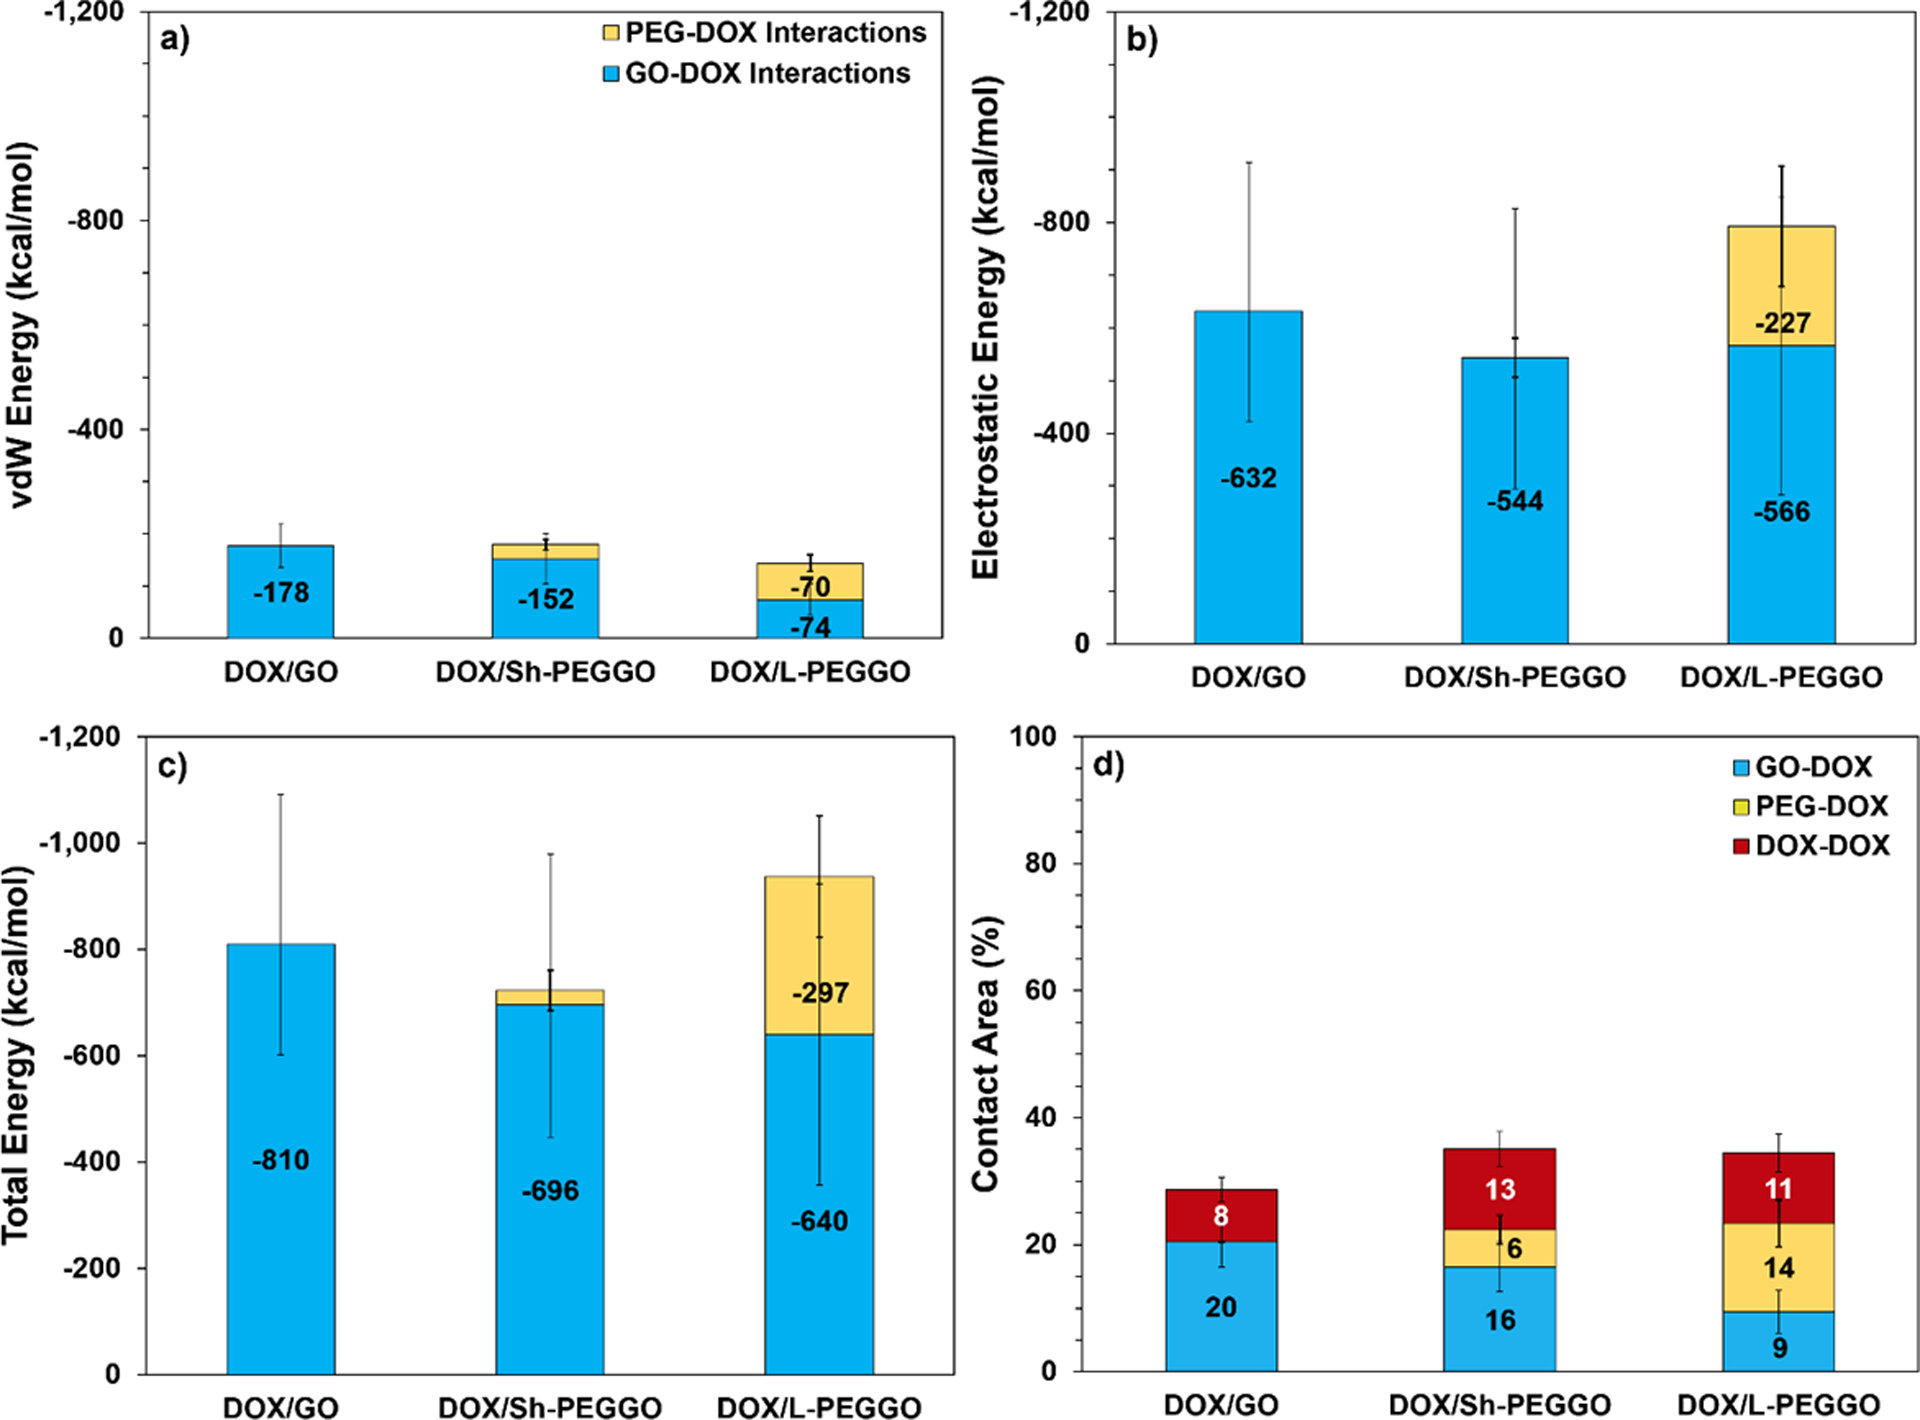
a) van der Waals (vdW), b) electrostatic, and c) total interaction energies of the DOX molecules with the available GO surface (blue) and PEG chains (yellow) in DOX/GO, DOX/Sh-PEGGO, and DOX/L-PEGGO systems. d) Contact area between DOX molecules and the GO surface (blue), PEG chains (yellow) and other DOX molecules (red) obtained by time-averaging the data over the last 2 ns of all four replicate simulations. The total DOX surface area is 7,361 Å2, calculated at t = 0, when all DOX molecules are separated. The numbers in the bars are the actual property values, while the lines (error bars) represent standard deviations of the values that were also obtained from the data for last 2 ns of all four replicate simulations.
Liao et al.,59 who investigated the encapsulation of DOX molecules within PEGylated poly(amidoamine) dendrimers, have reported a similar behavior. Based on their observation, increasing the PEGylation density does not change the number of adsorbed drugs appreciably. They speculated that DOX molecules tend to interact with the hydrophobic parts of the dendrimer carrier rather than the hydrophilic PEG chains. Notwithstanding their observation, a PEG chain length effect might be possible, which they did not consider. Based on our results, as the PEG chain length increases in the DOX/L-PEGGO system, an increase in the ratio of PEG-DOX to GO-DOX total interaction energy (Figure 3c), as well as the contact area (Figure 3d), signifies a larger tendency for the DOX molecules to be loaded onto the PEG chains. These new results confirm that as the PEG chain length increases, more of the drug molecules interact with the PEG chains during the drug loading. The same tendency might apply in the drug delivery system of Liao et al.59 With an increase in the PEG chain length, the DOX-PEG contributions to the total interaction energy increases up to about 32% for the DOX/L-PEGGO system (Figure 3c). This is due to a pronounced reduction of the accessible GO surface area and the existence of long free PEG chains that are able to trap the DOX molecules in the DOX/L-PEGGO system. Some of these trapped DOX molecules between the PEG chains are visible is Figure 2c.
The above DOX adsorption behavior can be explained by the effect of a hydration layer,55 formed around the nanocarrier (the GO surface plus the PEG chains) that would result in water density differences or a “water barrier” effect in the different drug/nanocarrier systems. Water density in the hydration layer was calculated after 1 ns of simulation. The reason it was calculated early during the drug adsorption phase was to have the density value obtained for the water barrier layer before the DOX molecules were adsorbed on the nanocarriers. The relevant data are summarized in Table 2, where it is evident that PEGylation of the GO effectively causes an increase in the average water density around the nanocarrier, an effect that further increases with an increase in the PEG chain length. This means that a larger number of water molecules are available on top of the PEG-covered part of the GO surface. This layer can act as an energetic barrier, leading to the DOX migration to the solvated PEG-free part of the GO surface, where more favorable interactions are possible between the DOX and nanocarrier. It should be emphasized here that the water barrier effect in the hydration layer may not provide a full picture of why the drug molecules prefer adsorption on the accessible GO surface rather than the PEG chains on the surface. An “excluded volume effect” is also be responsible for the observed DOX adsorption behavior. As the PEG chain size increases, more of the accessible GO surface is covered with the bulky PEG chains, preventing effective dug adsorption on the nanocarrier. Ultimately, there are two competing water barrier and excluded volume effects responsible for the observed drug loading behavior on the nanocarrier. A better picture of drug adsorption characteristics is obtained when investigating the GO-DOX and PEG-DOX contact areas (Figure 3d), as alluded to before.
Table 2.
Water density in the hydration layer () after 1 ns of MD simulation, averaged over four replicates
| System | (g/cm3) |
|---|---|
| DOX/GO | 1.297±0.009 |
| DOX/Sh-PEGGO | 1.324±0.007 |
| DOX/L-PEGGO | 1.347±0.039 |
The distribution of the DOX molecules on the GO and PEGGO surfaces were analyzed by the calculation of RDF, and are shown in Figure 4. The peak of the DOX distribution is at an average distance of about 5 Å from the accessible GO surface (Figure 4). In the Sh-PEGGO system, the same peak distance is observed, but with a smaller peak intensity. At longer simulation times, the short PEG chains are mostly folded on the free GO surface (Figure 2b), causing most of the DOX interaction with the nanocarrier to be confined to the accessible GO surface. With an increase in the PEG chain length in the L-PEGGO system, the average distance of the DOX molecules from the accessible GO surface increases to slightly above 10 Å, which signfies considerable engagement of the DOX molecules with the protruding PEG arms (Figure 2c) through DOX-PEG interactions (Figure 3). Gleaning from the RMSD curves for DOX (Figure 5) and PEG molecular positions (Figure 6), it is also observed that at long simulation times, i.e., >10 ns for the DOX/GO (Figure 5a) and >20 ns for DOX/Sh-PEGGO systems (Figure 5b), the DOX molecules establish a stable configuration in the DOX/nanocarrier complex. As seen in Figure 5, the RMSD of DOX in the different systems reach to a plateau either before 10 ns (Figures 5a and 5b) or around 30 ns (Figure 5c), signifying a equilibriation of the drug adsorption on the nanocarriers. The same is true for the RMSD of PEG chains in the different systems (Figure 6). It should be noted that each system was simulated four times (four replicates, each containing 10 drug molecules) and the same plateau region was observed for all the systems. However, in the L-PEGGO system (Figure 5c), while the DOX molecules interact favorably with the PEG chains (Figure 3), they are considerably more mobile around the PEG chains. The PEG chains reach an equilibrium configuration around the GO surface almost immediately after the start of the simulation (Figure 6), with the short PEG (S-PEG) chains residing very close to the GO surface (essentially folding on it), and the long PEG (L-PEG) chains reaching an equilibrium configuration that is reminiscent of mostly protruding PEG chains (Figures 2c and 6).
Figure 4.
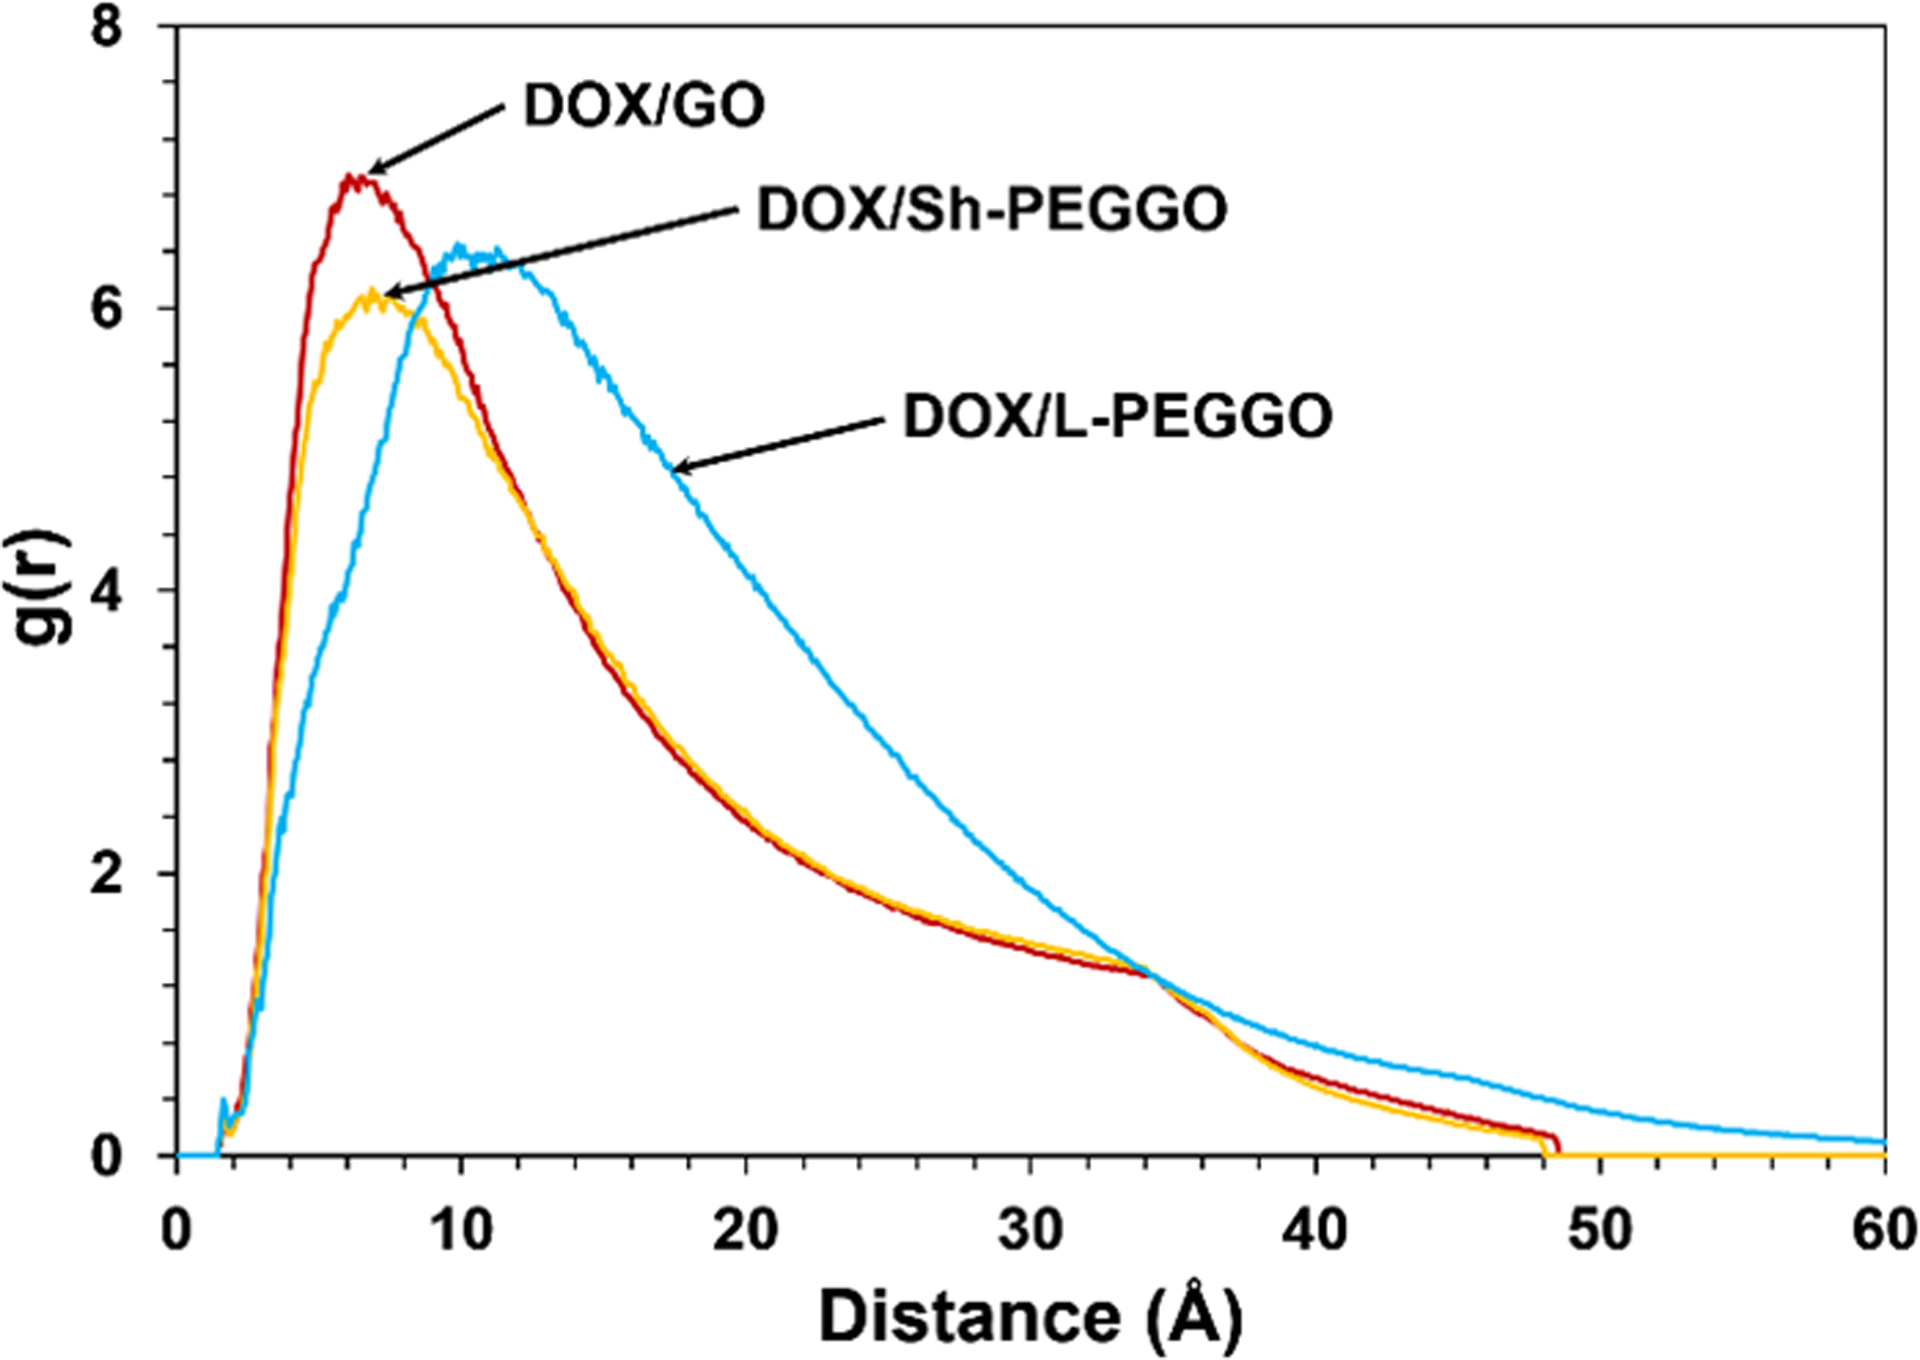
Radial distribution function (RDF) of the center of mass of DOX in the different DOX/nanocarrier systems, obtained by averaging the data over the last 2 ns of simulations and over four replicate systems.
Figure 5.
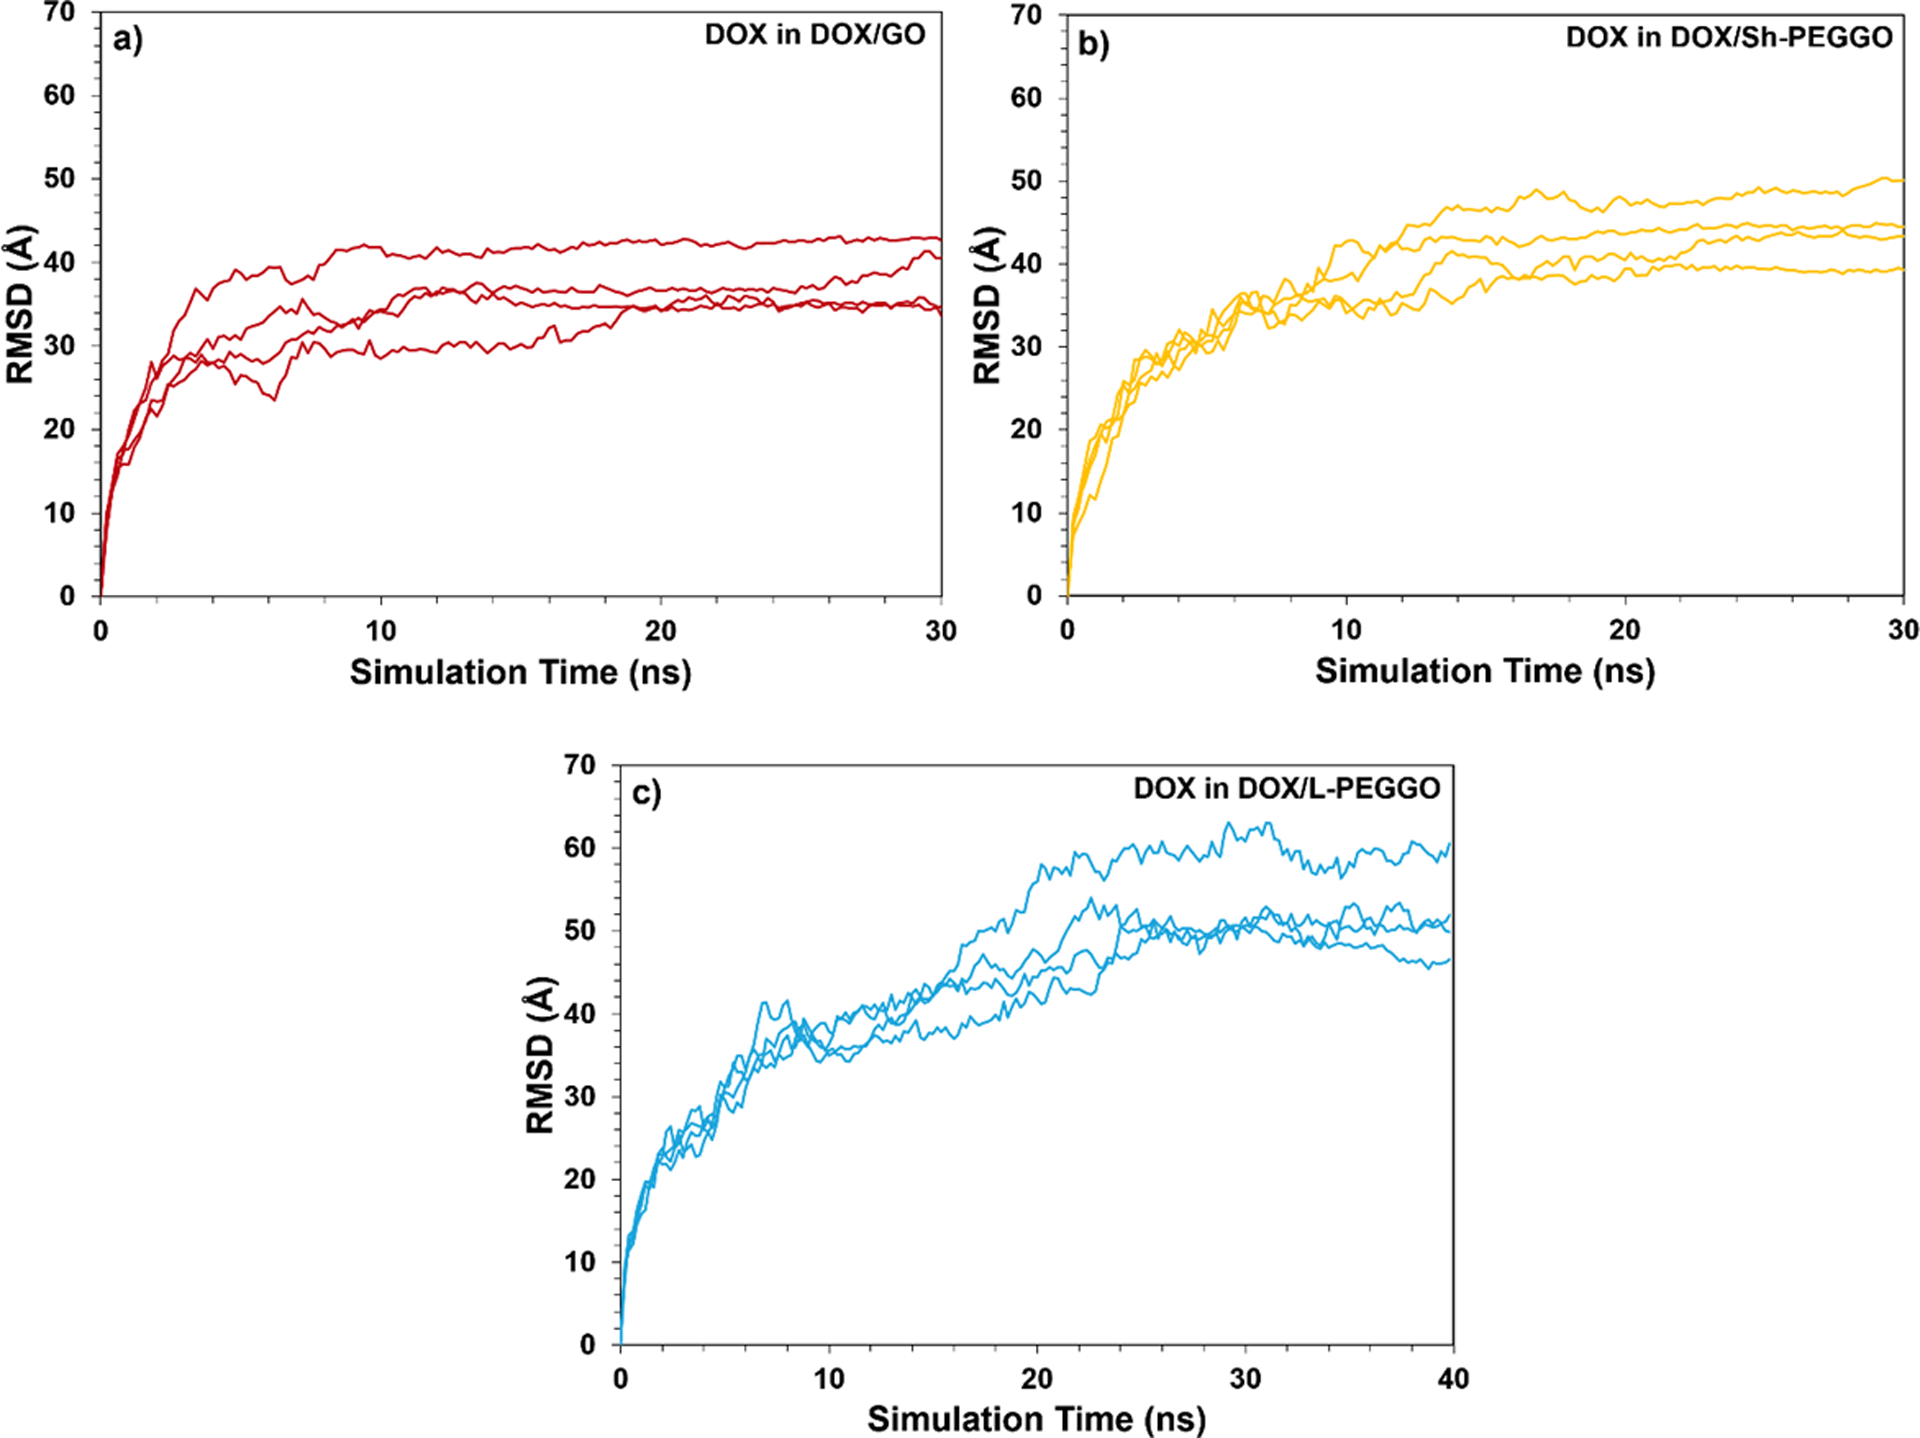
Root-mean square deviation (RMSD) of the 10 DOX molecular positions (treated as an assembly) from the GO surface as a function of simulation time in a) DOX/GO, b) DOX/Sh-PEGGO, and c) DOX/L-PEGGO systems. The RMSD plots for each of the four replicates are shown. The total simulation time for the DOX/L-PEGGO system was 40 ns.
Figure 6.
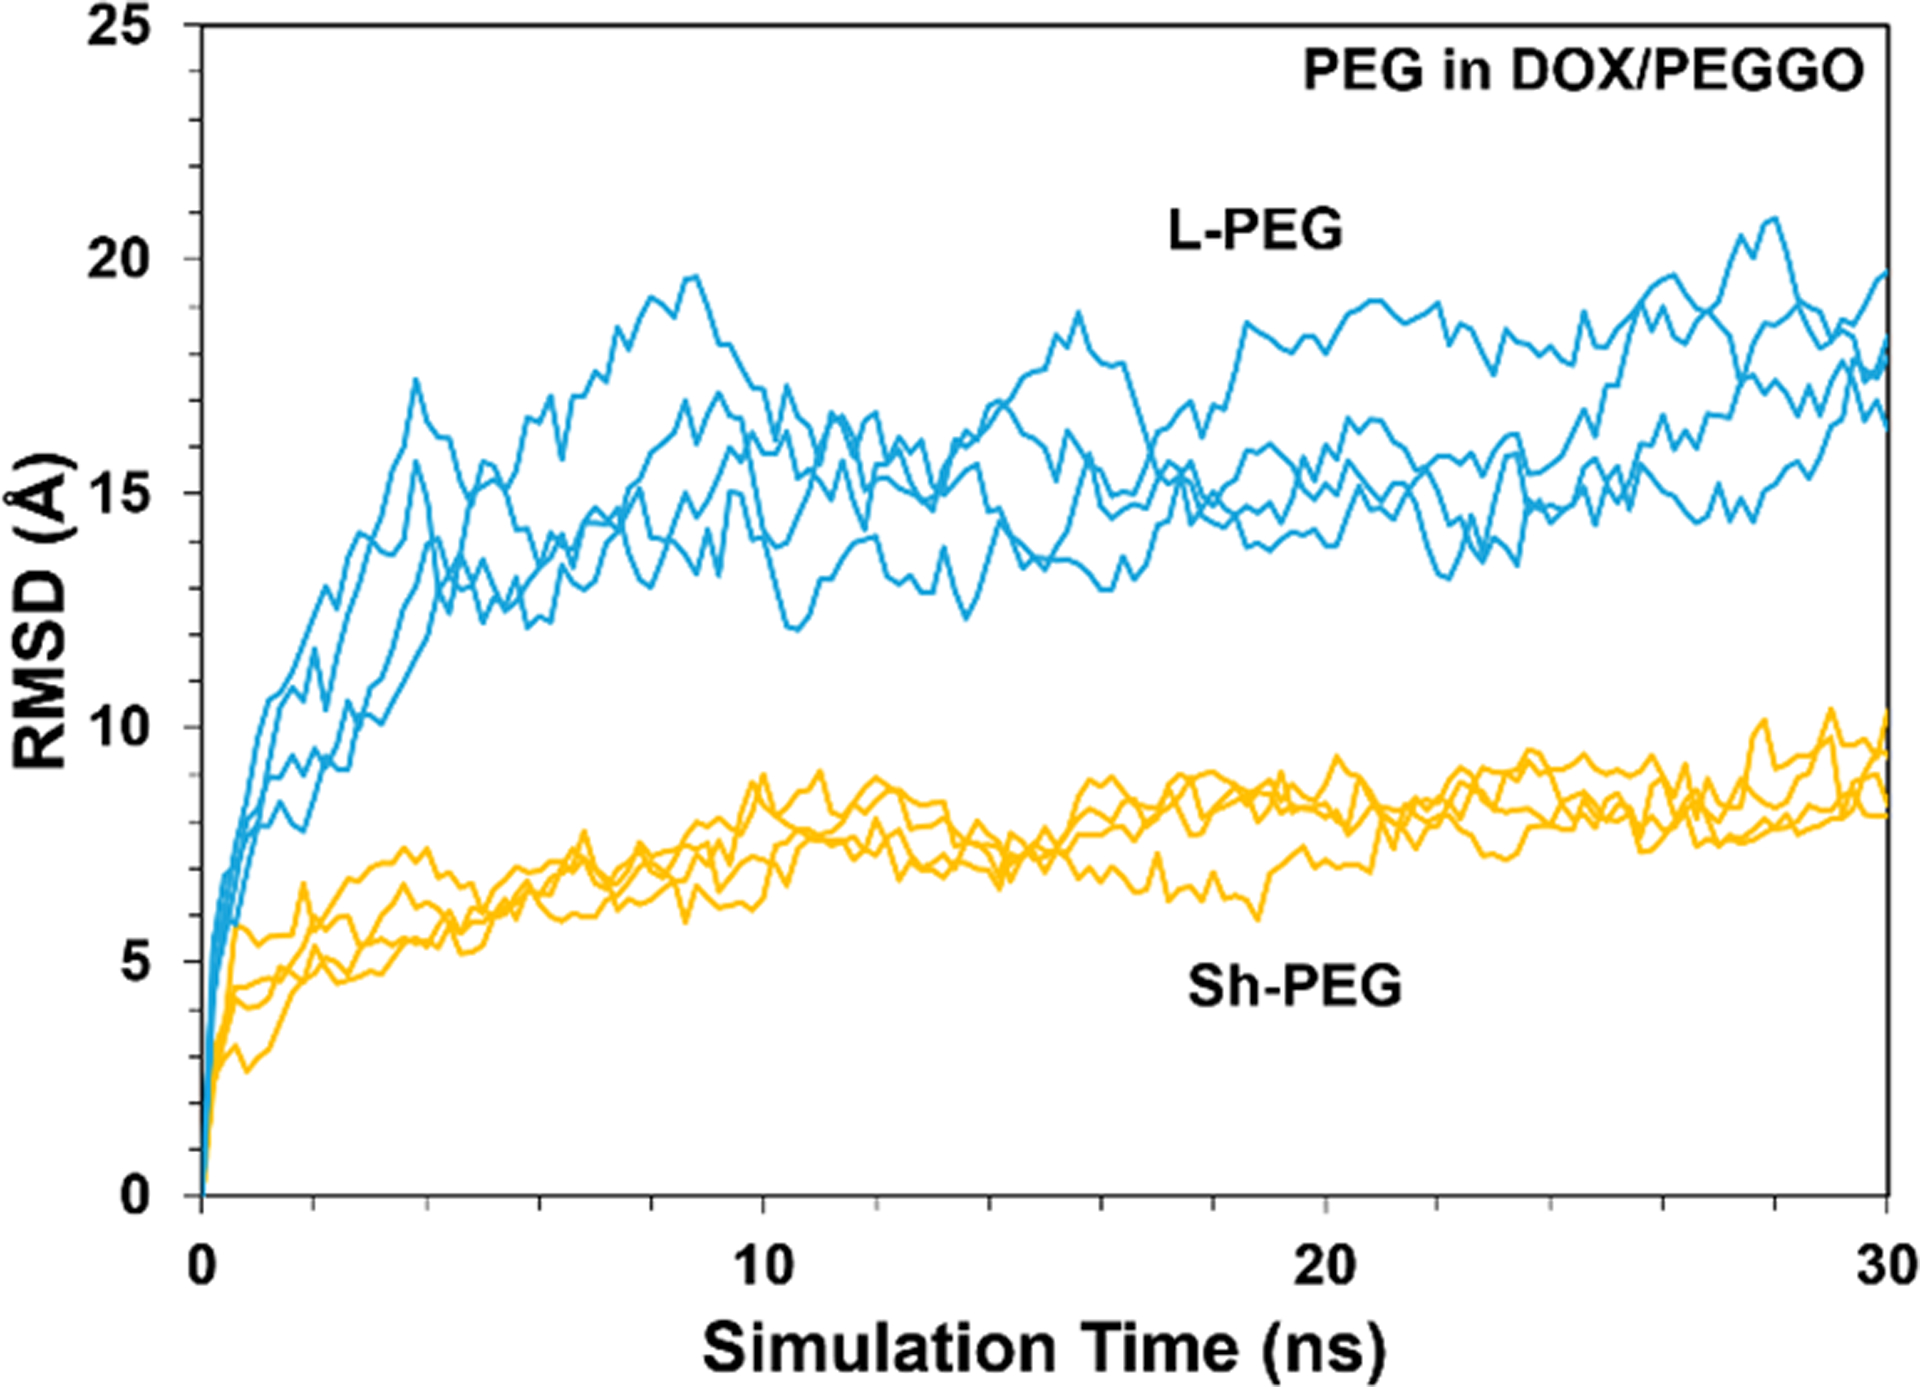
Root-mean square deviation (RMSD) of the PEG molecular positions (treated as an assembly) as a function of simulation time in the PEGGO systems.
To better understand the dynamics of DOX adsorption on the DOX/nanocarrier systems, the number of adsorbed drug molecules on the accessible GO surface was monitored as a function of the simulation time (Figure 7a). On average, the DOX adsorption rate on the nanocarriers follows the following order: DOX/GO > DOX/Sh-PEGGO > DOX/L-PEGGO, with the DOX/GO system showing the fastest DOX loading on the accessible GO surface (~10 ns, Figure 7a), and the PEGGO systems showing a slower DOX adsorption (>20 ns for both systems, Figure 7a). Superimposed snapshots of the DOX molecular positions in the different drug/nanocarrier systems at different initial, intermediate, and final simulation times are shown in Figure 7b. While about 100% of the DOX molecules are adsorbed on the accessible GO surface in the DOX/GO system, only about 80% and 60% of the DOX molecules are adsorbed on the accessible GO surface in the DOX/Sh-PEGGO and DOX/L-PEGGO systems, respectively.
Figure 7.
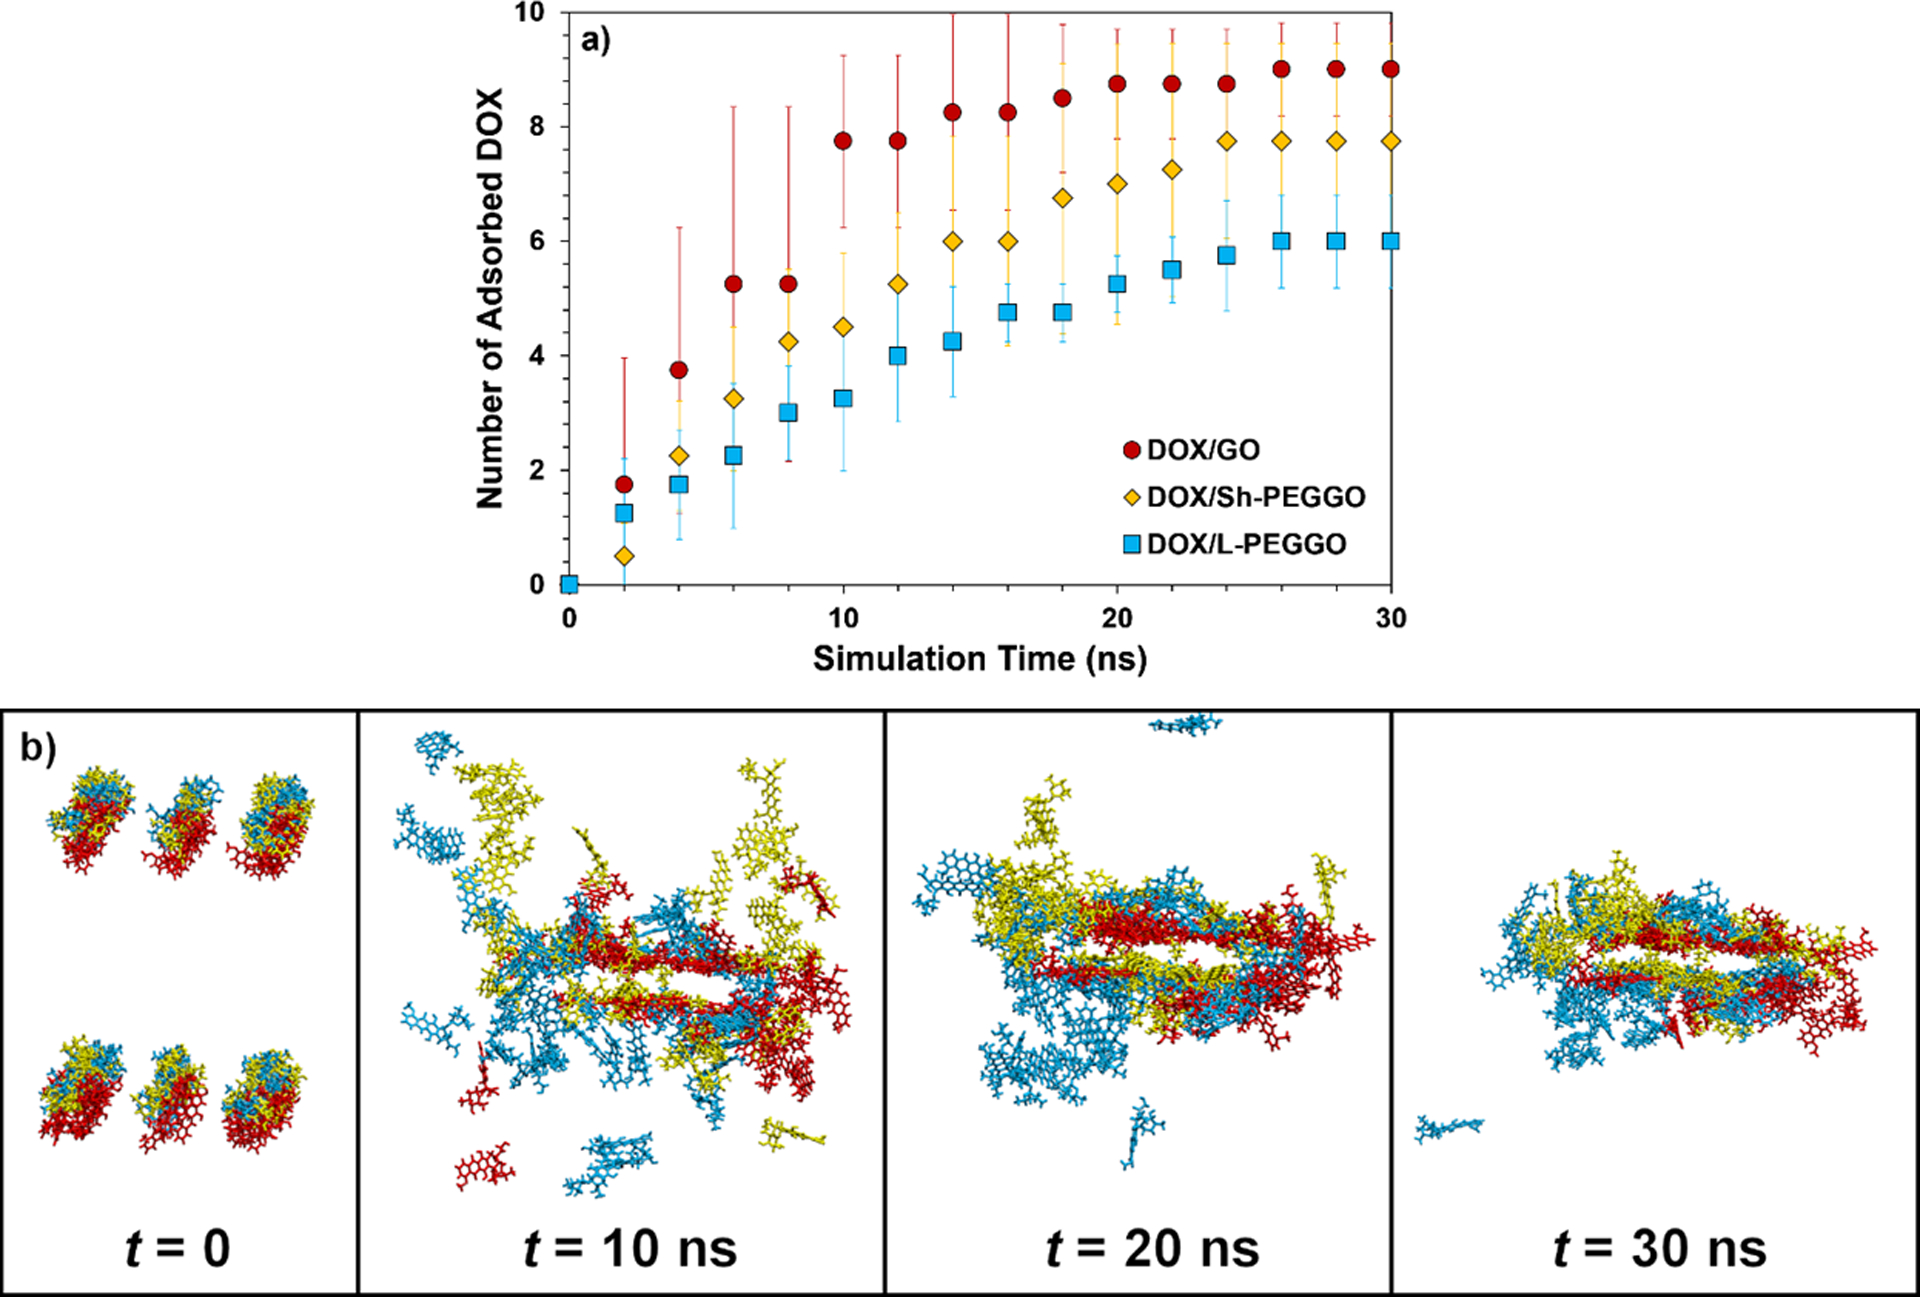
a) Number of adsorbed DOX molecules on the accessible GO surface in different drug/nanocarrier systems as a function of simulation time. The drug molecule is considered adsorbed on the nanocarrier surface when at least one of its atoms is within a distance of 5 Å from the surface. b) Sample superimposed snapshots of the DOX molecules in different systems (red = DOX/GO, yellow = DOX/Sh-PEGGO, blue = DOX/L-PEGGO) at different simulation times (GO sheets, PEG chains, and water molecules are not shown).
The average total accessible GO surface for drug adsoprtion can be obtained by tracking the GO-PEG contact area as a function of simulation time (Figure 8a). Given the fast equilibration of the PEG chain configurations around the GO surface (Figure 6), average contact areas of about 2,000 Å2 for the Sh-PEGGO nanocarrier and 2,800 Å2 for the L-PEGGO nanocarrier (Figure 8a), signify that about 70% of the GO surface for the former and 60% of the GO surface for latter nanocarrier is accessible for DOX adsorption. The PEG-GO contact area for both systems remained constat during the simulation, indicating that the adsorption of DOX molecules on the GO surface GO did not affect the PEG-GO contact area. Similar dynamic contact area data was observed for the GO-DOX, DOX-PEG, and DOX-DOX complexes in the different drug/nanocarrier systems (Figures 8b–8d). A larger GO-DOX contact area than those of the DOX/PEGGO systems (Figure 8b) is directly correlated with the DOX adsorption on the accessible GO surface given in Figure 7a. Fluctuation of the DOX-PEG contact area in the DOX/L-PEGGO system at different simulation times (Figure 8c) suggests that the DOX molecules tend to be more mobile around the PEG chains, similar to the observation made based on the DOX RMSD data in Figure 5c. Moreover, comparison of the water densites in the hydration layer surrounding the nanocarriers (Table 2) suggests that the DOX adsorption rate (Figure 7a) and evolution of GO-DOX contact area (Figure 8b) should be slower for the DOX/PEGGO systems, bacause of a larger average water density in the hydration layer in these systems compared to that of the DOX/GO system.
Figure 8.
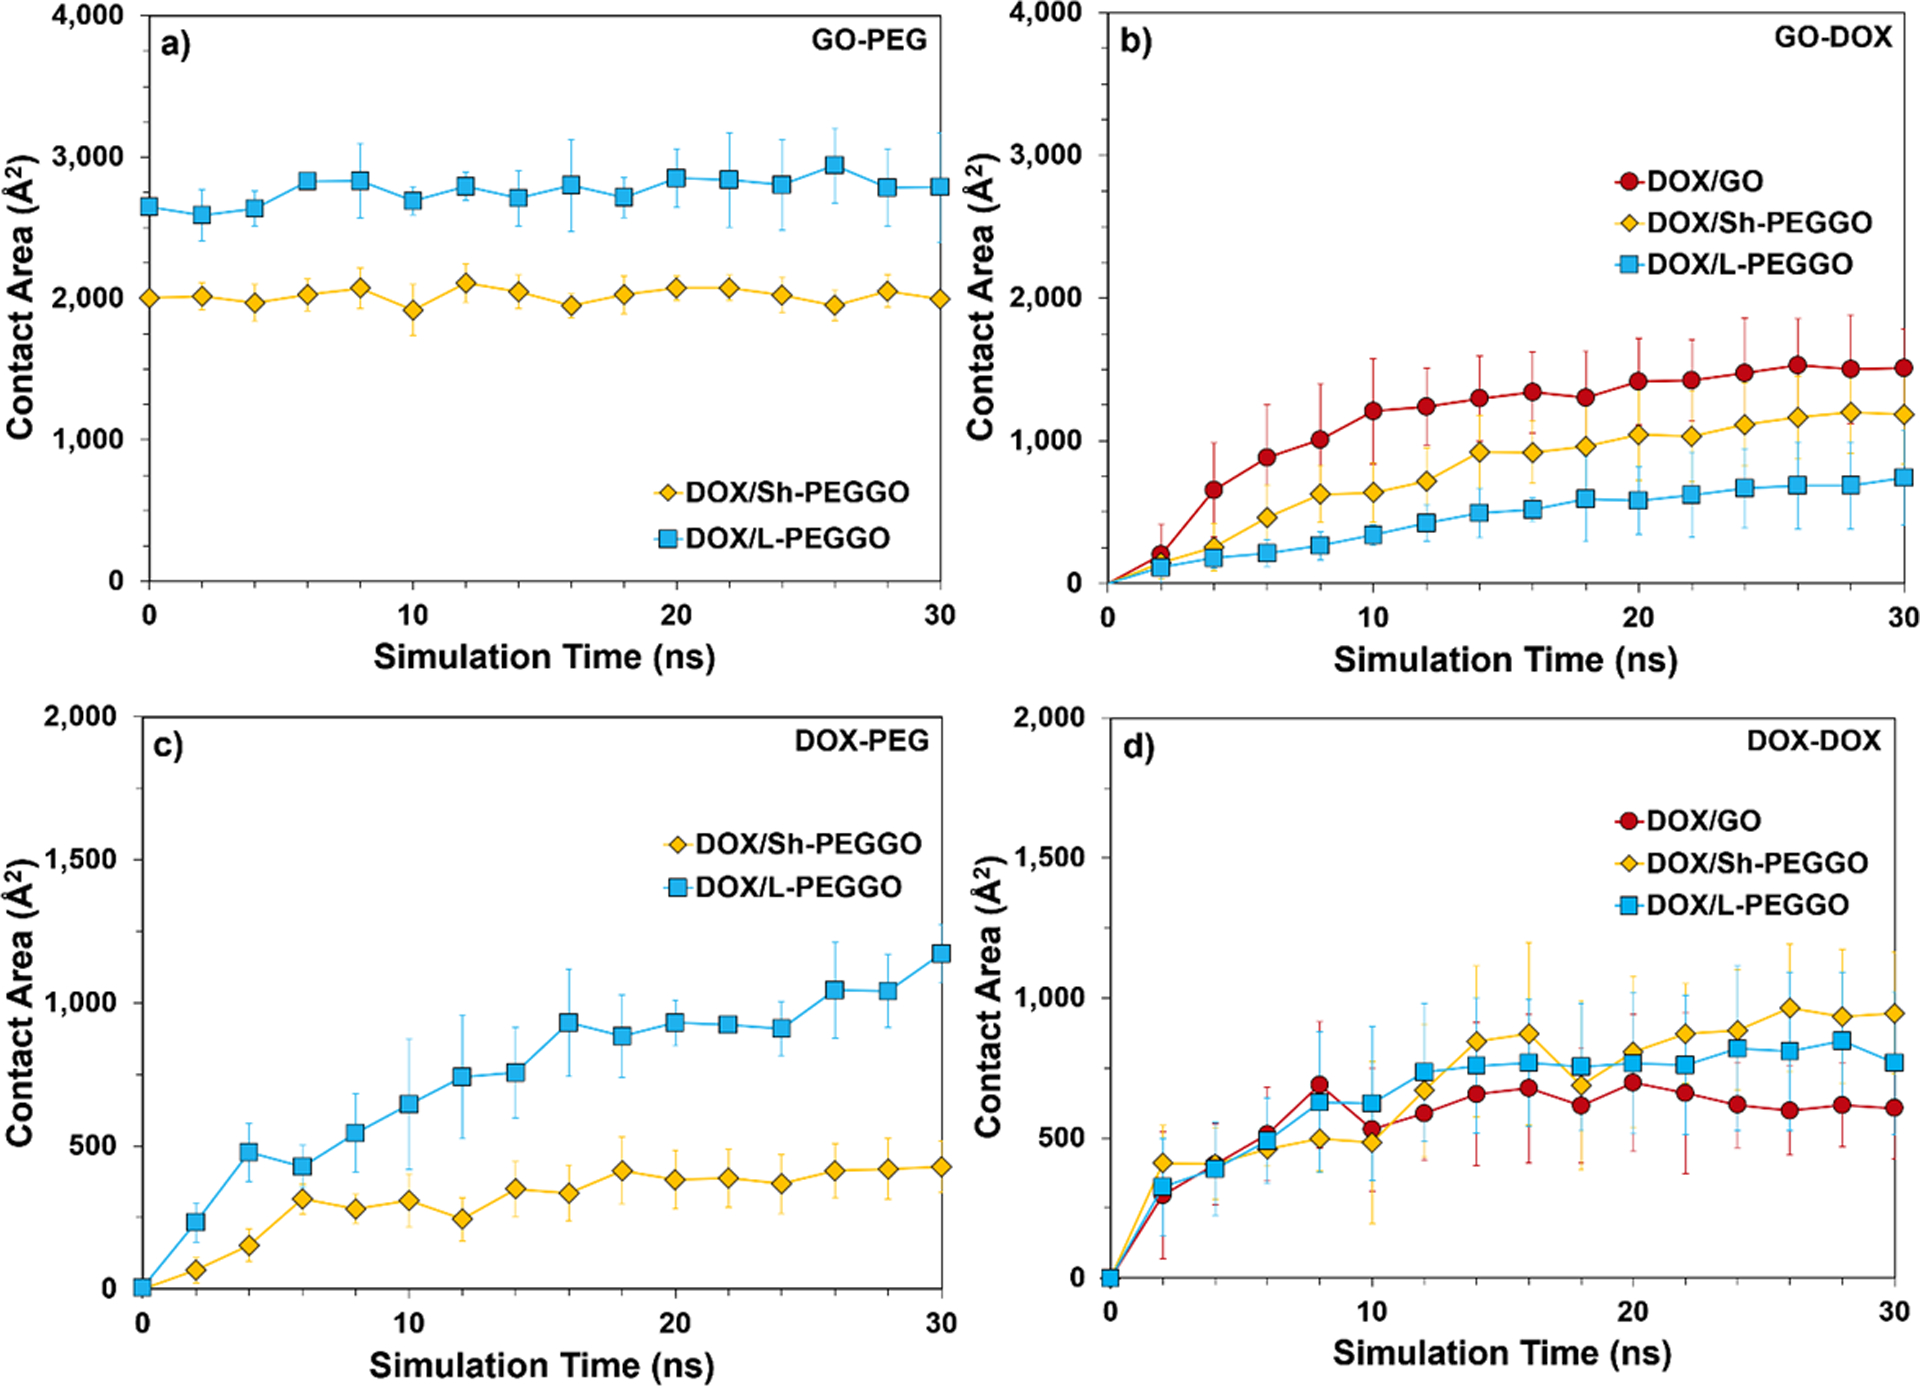
Contact areas between a) GO-PEG, b) GO-DOX, c) DOX-PEG, and d) DOX-DOX molecular assemblies in the different drug/nanocarrier systems. The SASA of GO is 6,850 Å2 (see Analysis).
The average DOX-DOX contact area (Figure 8d) may be used as a metric for DOX self-aggregation in the different systems. A smaller average DOX-DOX contact area in the DOX/GO system signifies less self-aggregation of the drug molecules in this system, while the level of DOX self-aggregation is slightly higher for the PEGGO systems. As it can be seen in the Figure 3d and 8d, the DOX-DOX contact area in PEGylated systems (DOX/L-PEGGO and DOX/Sh-PEGGO) are higher than that of the GO system. This means that DOX molecules tend to agglomerate though interactions between their hydrophobic domains, exposing their hydrophilic domains to the hydrophilic functional groups of the PEG chains. In the GO system, drug molecules are dispersed on the surface with minimum self-agglomeration. In the Sh-PEGylated systems, they are mostly adsorbed on the uncovered surface of GO, but in the L-PEGylated system, because of the lack of uncovered GO surface, DOX molecules are trapped between the long PEG chains in an aggregated form. A visual representation of the DOX self-aggregation is given in Figure 2.
CONCLUSION
There is an extensive body of evidence that PEGylation of graphene oxide (GO) nanocarriers for anticancer drug delivery is an efficient way to improve the drug circulation time and its delivery and targeting. While previous work has revealed critical aspects of the GO PEGylation, the effect of PEG chain length on the loading and dynamics of a well-studied anticancer drug, i.e., doxorubicin (DOX), has not been reported. This is important, as the distribution of the adsorbed drug molecules on the accessible GO surface and PEG arms could have implications for the delivery and targeting of the drug to a solid tumor site. In this computational work, the relevant energetics and structural details of the DOX adsorption on PEGGO systems are presented, revealing the mechanisms of drug adsorption as a function of time and PEG chain length. Overall, there is a shift in the adsorption site for the drug molecules from the accessible GO surface to the protruding PEG arms that can be attributed to a “water barrier” effect in a hydration layer surrounding the nanocarriers. Interestingly, the total DOX-nanocarrier interactions after drug loading does not change appreciably going from GO to PEGGO systems with different PEG chain lengths. Therefore, while drug loading energetics are comparable in the different systems, a different distribution of the drug molecules on the nanocarriers may have implications for their delivery in the human blood stream, especially in the presence of prevalent proteins in the plasma, such as human serum albumin.
Supplementary Material
ACKNOWLEDGMENTS
E. T. acknowledges support from NIH through the grant P41-GM104601. The simulations presented in this study were supported by the computational resources at the Theoretical and Computational Biophysics Group at the University of Illinois at Urbana-Champaign.
Footnotes
Supplementary Information
The force field parameter files for DOX and protonated DOX, general CHARMM36 force field (CGENFF) (bonded and nonbonded) parameters, and CGENFF bonded parameters for the PEG-GO linkage are provided.
The authors declare no competing financial interest.
REFERENCES
- (1).Jain KK Nanotechnology-Based Drug Delivery for Cancer. Technol. Cancer Res. Treat 2005, 4 (4), 407–416. [DOI] [PubMed] [Google Scholar]
- (2).Ferrari M Cancer Nanotechnology: Opportunities and Challenges. Nat. Rev. cancer 2005, 5 (3), 161. [DOI] [PubMed] [Google Scholar]
- (3).Wang X; Wang Y; Chen ZG; Shin DM Advances of Cancer Therapy by Nanotechnology . Cancer Res. Treat. Off. J. Korean Cancer Assoc 2009, 41 (1), 1. [DOI] [PMC free article] [PubMed] [Google Scholar]
- (4).Singh OP; Nehru RM Nanotechnology and Cancer Treatment. Asian J Exp Sci 2008, 22 (2), 6. [Google Scholar]
- (5).Misra R; Acharya S; Sahoo SK Cancer Nanotechnology: Application of Nanotechnology in Cancer Therapy. Drug Discov. Today 2010, 15 (19–20), 842–850. [DOI] [PubMed] [Google Scholar]
- (6).Schroeder A; Heller DA; Winslow MM; Dahlman JE; Pratt GW; Langer R; Jacks T; Anderson DG Treating Metastatic Cancer with Nanotechnology. Nat. Rev. Cancer 2012, 12 (1), 39. [DOI] [PubMed] [Google Scholar]
- (7).Parhi P; Mohanty C; Sahoo SK Nanotechnology-Based Combinational Drug Delivery: An Emerging Approach for Cancer Therapy. Drug Discov. Today 2012, 17 (17–18), 1044–1052. [DOI] [PubMed] [Google Scholar]
- (8).Sanna V; Pala N; Sechi M Targeted Therapy Using Nanotechnology: Focus on Cancer. Int. J. Nanomedicine 2014, 9, 467. [DOI] [PMC free article] [PubMed] [Google Scholar]
- (9).Jang SH; Wientjes MG; Lu D; Au JL-S Drug Delivery and Transport to Solid Tumors. Pharm. Res 2003, 20 (9), 1337–1350. [DOI] [PubMed] [Google Scholar]
- (10).Peer D; Karp JM; Hong S; Farokhzad OC; Margalit R; Langer R Nanocarriers as an Emerging Platform for Cancer Therapy. Nat. Nanotechnol 2007, 2 (12), 751. [DOI] [PubMed] [Google Scholar]
- (11).Cho K; Wang XU; Nie S; Shin DM Therapeutic Nanoparticles for Drug Delivery in Cancer. Clin. cancer Res 2008, 14 (5), 1310–1316. [DOI] [PubMed] [Google Scholar]
- (12).Haley B; Frenkel E Nanoparticles for Drug Delivery in Cancer Treatment In Urologic Oncology: Seminars and original investigations; Elsevier, 2008; Vol. 26, pp 57–64. [DOI] [PubMed] [Google Scholar]
- (13).Singh R; Lillard JW Jr Nanoparticle-Based Targeted Drug Delivery. Exp. Mol. Pathol 2009, 86 (3), 215–223. [DOI] [PMC free article] [PubMed] [Google Scholar]
- (14).Kim K; Kim JH; Park H; Kim Y-S; Park K; Nam H; Lee S; Park JH; Park R-W; Kim I-S Tumor-Homing Multifunctional Nanoparticles for Cancer Theragnosis: Simultaneous Diagnosis, Drug Delivery, and Therapeutic Monitoring. J. Control. release 2010, 146 (2), 219–227. [DOI] [PubMed] [Google Scholar]
- (15).Bae YH; Park K Targeted Drug Delivery to Tumors: Myths, Reality and Possibility. J. Control. release 2011, 153 (3), 198. [DOI] [PMC free article] [PubMed] [Google Scholar]
- (16).Sun T; Zhang YS; Pang B; Hyun DC; Yang M; Xia Y Engineered Nanoparticles for Drug Delivery in Cancer Therapy. Angew. Chemie Int. Ed 2014, 53 (46), 12320–12364. [DOI] [PubMed] [Google Scholar]
- (17).Hare JI; Lammers T; Ashford MB; Puri S; Storm G; Barry ST Challenges and Strategies in Anti-Cancer Nanomedicine Development: An Industry Perspective. Adv. Drug Deliv. Rev 2017, 108, 25–38. [DOI] [PubMed] [Google Scholar]
- (18).Rosenblum D; Joshi N; Tao W; Karp JM; Peer D Progress and Challenges towards Targeted Delivery of Cancer Therapeutics. Nat. Commun 2018, 9, 1410. [DOI] [PMC free article] [PubMed] [Google Scholar]
- (19).Abdelaziz HM; Gaber M; Abd-Elwakil MM; Mabrouk MT; Elgohary MM; Kamel NM; Kabary DM; Freag MS; Samaha MW; Mortada SM; Elkhodairy KA; Fang JY; Elzoghby AO Inhalable Particulate Drug Delivery Systems for Lung Cancer Therapy: Nanoparticles, Microparticles, Nanocomposites and Nanoaggregates. J. Control. Release 2018, 269, 374–392. [DOI] [PubMed] [Google Scholar]
- (20).Ulbrich K; Holá K; Šubr V; Bakandritsos A; Tuček J; Zbořil R Targeted Drug Delivery with Polymers and Magnetic Nanoparticles: Covalent and Noncovalent Approaches, Release Control, and Clinical Studies. Chem. Rev 2016, 116 (9), 5338–5431. [DOI] [PubMed] [Google Scholar]
- (21).Wang Y; Zhao Q; Han N; Bai L; Li J; Liu J; Che E; Hu L; Zhang Q; Jiang T; Wang S Mesoporous Silica Nanoparticles in Drug Delivery and Biomedical Applications. Nanomedicine Nanotechnology, Biol. Med 2015, 11 (2), 313–327. [DOI] [PubMed] [Google Scholar]
- (22).Agostoni V; Horcajada P; Noiray M; Malanga M; Aykaç A; Jicsinszky L; Vargas-Berenguel A; Semiramoth N; Daoud-Mahammed S; Nicolas V; Martineau C; Taulelle F; Vigneron J; Etcheberry A; Serre C; Gref RA “Green” Strategy to Construct Non-Covalent, Stable and Bioactive Coatings on Porous MOF Nanoparticles. Sci. Rep 2015, 5, 7925. [DOI] [PMC free article] [PubMed] [Google Scholar]
- (23).Huang J; Li Y; Orza A; Lu Q; Guo P; Wang L; Yang L; Mao H Magnetic Nanoparticle Facilitated Drug Delivery for Cancer Therapy with Targeted and Image-Guided Approaches. Adv. Funct. Mater 2016, 26 (22), 3818–3836. [DOI] [PMC free article] [PubMed] [Google Scholar]
- (24).Zhang Q; Wu Z; Li N; Pu Y; Wang B; Zhang T; Tao J Advanced Review of Graphene-Based Nanomaterials in Drug Delivery Systems: Synthesis, Modification, Toxicity and Application. Mater. Sci. Eng. C 2017, 77, 1363–1375. [DOI] [PubMed] [Google Scholar]
- (25).Zhu Y; Murali S; Cai W; Li X; Suk JW; Potts JR; Ruoff RS Graphene and Graphene Oxide: Synthesis, Properties, and Applications. Adv. Mater 2010, 22 (35), 3906–3924. [DOI] [PubMed] [Google Scholar]
- (26).Zhang L; Xia J; Zhao Q; Liu L; Zhang Z Functional Graphene Oxide as a Nanocarrier for Controlled Loading and Targeted Delivery of Mixed Anticancer Drugs. small 2010, 6 (4), 537–544. [DOI] [PubMed] [Google Scholar]
- (27).Mahdavi M; Rahmani F; Nouranian S Molecular Simulation of PH-Dependent Diffusion, Loading, and Release of Doxorubicin in Graphene and Graphene Oxide Drug Delivery Systems. J. Mater. Chem. B 2016, 4 (46), 7441–7451. [DOI] [PubMed] [Google Scholar]
- (28).Vovusha H; Banerjee D; Yadav MK; Perrozzi F; Ottaviano L; Sanyal S; Sanyal B Binding Characteristics of Anticancer Drug Doxorubicin with Two-Dimensional Graphene and Graphene Oxide: Insights from Density Functional Theory Calculations and Fluorescence Spectroscopy. J. Phys. Chem. C 2018, 122 (36), 21031–21038. [Google Scholar]
- (29).Bussy C; Alexiou C; Petros RA; Nyström AM; Methven L; Kostarelos K Therapeutic Applications In Adverse Effects of Engineered Nanomaterials; Elsevier, 2012; pp 285–313. [Google Scholar]
- (30).Bertrand N; Leroux J-C The Journey of a Drug-Carrier in the Body: An Anatomo-Physiological Perspective. J. Control. release 2012, 161 (2), 152–163. [DOI] [PubMed] [Google Scholar]
- (31).Iyer AK; Khaled G; Fang J; Maeda H Exploiting the Enhanced Permeability and Retention Effect for Tumor Targeting. Drug Discov. Today 2006, 11 (17–18), 812–818. [DOI] [PubMed] [Google Scholar]
- (32).Greish K Enhanced Permeability and Retention (EPR) Effect for Anticancer Nanomedicine Drug Targeting In Cancer Nanotechnology; Springer, 2010; pp 25–37. [DOI] [PubMed] [Google Scholar]
- (33).Kanamala M; Wilson WR; Yang M; Palmer BD; Wu Z Mechanisms and Biomaterials in PH-Responsive Tumour Targeted Drug Delivery: A Review. Biomaterials 2016, 85, 152–167. [DOI] [PubMed] [Google Scholar]
- (34).Zhao X; Liu L; Li X; Zeng J; Jia X; Liu P Biocompatible Graphene Oxide Nanoparticle-Based Drug Delivery Platform for Tumor Microenvironment-Responsive Triggered Release of Doxorubicin. Langmuir 2014, 30 (34), 10419–10429. [DOI] [PubMed] [Google Scholar]
- (35).Maeda H Toward a Full Understanding of the EPR Effect in Primary and Metastatic Tumors as Well as Issues Related to Its Heterogeneity. Adv. Drug Deliv. Rev 2015, 91, 3–6. [DOI] [PubMed] [Google Scholar]
- (36).Veronese FM; Pasut G PEGylation, Successful Approach to Drug Delivery. Drug Discov. Today 2005, 10 (21), 1451–1458. [DOI] [PubMed] [Google Scholar]
- (37).Zeng Y; Yang Z; Luo S; Li H; Liu C; Hao Y; Liu J; Wang W; Li R Fast and Facile Preparation of PEGylated Graphene from Graphene Oxide by Lysosome Targeting Delivery of Photosensitizer to Efficiently Enhance Photodynamic Therapy. RSC Adv. 2015, 5, 57725–57734. [Google Scholar]
- (38).Liu Z; Robinson JT; Sun X; Dai H PEGylated Nanographene Oxide for Delivery of Water-Insoluble Cancer Drugs. J. Am. Chem. Soc 2008, 130 (33), 10876–10877. [DOI] [PMC free article] [PubMed] [Google Scholar]
- (39).Miao W; Shim G; Lee S; Lee S; Choe YS; Oh YK Safety and Tumor Tissue Accumulation of Pegylated Graphene Oxide Nanosheets for Co-Delivery of Anticancer Drug and Photosensitizer. Biomaterials 2013, 34 (13), 3402–3410. [DOI] [PubMed] [Google Scholar]
- (40).Xu Z; Zhu S; Wang M; Li Y; Shi P; Huang X Delivery of Paclitaxel Using PEGylated Graphene Oxide as a Nanocarrier. ACS Appl. Mater. Interfaces 2015, 7 (2), 1355–1363. [DOI] [PubMed] [Google Scholar]
- (41).Rahmani F; Nouranian S; Mahdavi M; Al-Ostaz A Molecular Simulation Insights on the in Vacuo Adsorption of Amino Acids on Graphene Oxide Surfaces with Varying Surface Oxygen Densities. J. Nanoparticle Res 2016, 18 (11), 320. [Google Scholar]
- (42).Rahmani F; Mahdavi M; Nouranian S; Al-Ostaz A Confinement Effects on the Thermal Stability of Poly(Ethylene Oxide)/Graphene Nanocomposites: A Reactive Molecular Dynamics Simulation Study. J. Polym. Sci. Part B Polym. Phys 2017, 55 (13), 1026–1035. [Google Scholar]
- (43).Sun X; Feng Z; Hou T; Li Y Mechanism of Graphene Oxide as an Enzyme Inhibitor from Molecular Dynamics Simulations. ACS Appl. Mater. Interfaces 2014, 6 (10), 7153–7163. [DOI] [PubMed] [Google Scholar]
- (44).Luo N; Weber JK; Wang S; Luan B; Yue H; Xi X; Du J; Yang Z; Wei W; Zhou R; Ma G PEGylated Graphene Oxide Elicits Strong Immunological Responses despite Surface Passivation. Nat. Commun 2017, 8, 14537. [DOI] [PMC free article] [PubMed] [Google Scholar]
- (45).Mayo SL; Olafson BD; Goddard WA DREIDING: A Generic Force Field for Molecular Simulations. J. Phys. Chem 1990, 94 (26), 8897–8909. [Google Scholar]
- (46).Zoete V; Cuendet MA; Grosdidier A; Michielin O SwissParam: A Fast Force Field Generation Tool for Small Organic Molecules. J. Comput. Chem 2011, 32 (11), 2359–2368. [DOI] [PubMed] [Google Scholar]
- (47).Humphrey W; Dalke A; Schulten K VMD: Visual Molecular Dynamics. J. Mol. Graph 1996, 14 (1), 33–38. [DOI] [PubMed] [Google Scholar]
- (48).Jorgensen WL; Chandrasekhar J; Madura JD; Impey RW; Klein ML Comparison of Simple Potential Functions for Simulating Liquid Water. J. Chem. Phys 1983, 79 (2), 926–935. [Google Scholar]
- (49).Phillips JC; Braun R; Wang W; Gumbart J; Tajkhorshid E; Villa E; Chipot C; Skeel RD; Kale L; Schulten K Scalable Molecular Dynamics with NAMD. J. Comput. Chem 2005, 26 (16), 1781–1802. [DOI] [PMC free article] [PubMed] [Google Scholar]
- (50).Vanommeslaeghe K; Hatcher E; Acharya C; Kundu S; Zhong S; Shim J; Darian E; Guvench O; Lopes P; Vorobyov I CHARMM General Force Field: A Force Field for Drug‐like Molecules Compatible with the CHARMM All‐atom Additive Biological Force Fields. J. Comput. Chem 2010, 31 (4), 671–690. [DOI] [PMC free article] [PubMed] [Google Scholar]
- (51).Best RB; Zhu X; Shim J; Lopes PEM; Mittal J; Feig M; MacKerell AD Jr Optimization of the Additive CHARMM All-Atom Protein Force Field Targeting Improved Sampling of the Backbone ϕ, ψ and Side-Chain Χ1 and Χ2 Dihedral Angles. J. Chem. Theory Comput 2012, 8 (9), 3257–3273. [DOI] [PMC free article] [PubMed] [Google Scholar]
- (52).Loncharich RJ; Brooks BR; Pastor RW Langevin Dynamics of Peptides: The Frictional Dependence of Isomerization Rates of N‐acetylalanyl‐N′‐methylamide. Biopolymers 1992, 32 (5), 523–535. [DOI] [PubMed] [Google Scholar]
- (53).Essmann U; Perera L; Berkowitz ML; Darden T; Lee H; Pedersen LG A Smooth Particle Mesh Ewald Method. J. Chem. Phys 1995, 103 (19), 8577–8593. [Google Scholar]
- (54).Levine BG; Stone JE; Kohlmeyer A Fast Analysis of Molecular Dynamics Trajectories with Graphics Processing Units-Radial Distribution Function Histogramming. J. Comput. Phys 2011, 230 (9), 3556–3569. [DOI] [PMC free article] [PubMed] [Google Scholar]
- (55).Beckner W; He Y; Pfaendtner J Chain Flexibility in Self-Assembled Monolayers Affects Protein Adsorption and Surface Hydration: A Molecular Dynamics Study. J. Phys. Chem. B 2016, 120 (40), 10423–10432. [DOI] [PubMed] [Google Scholar]
- (56).Connolly ML Solvent-Accessible Surfaces of Proteins and Nucleic Acids. Science (80-. ) 1983, 221 (4612), 709–713. [DOI] [PubMed] [Google Scholar]
- (57).Franks F Water: A Matrix of Life; Royal Society of Chemistry, 2007. [Google Scholar]
- (58).Vilhena JG; Rubio-Pereda P; Vellosillo P; Serena PA; Pérez R Albumin (BSA) Adsorption over Graphene in Aqueous Environment: Influence of Orientation, Adsorption Protocol, and Solvent Treatment. Langmuir 2016, 32 (7), 1742–1755. [DOI] [PubMed] [Google Scholar]
- (59).Liao H; Liu H; Li Y; Zhang M; Tomás H; Shen M; Shi X Antitumor Efficacy of Doxorubicin Encapsulated within PEGylated Poly(Amidoamine) Dendrimers. J. Appl. Polym. Sci 2014, 131 (11), 40358. [Google Scholar]
Associated Data
This section collects any data citations, data availability statements, or supplementary materials included in this article.


