

Abstract
Repeated stimulus presentations commonly produce decreased neural responses—a phenomenon known as repetition suppression (RS) or adaptation—in ventral temporal cortex (VTC) of humans and nonhuman primates. However, the temporal features of RS in human VTC are not well understood. To fill this gap in knowledge, we utilized the precise spatial localization and high temporal resolution of electrocorticography (ECoG) from nine human subjects implanted with intracranial electrodes in the VTC. The subjects viewed nonrepeated and repeated images of faces with long-lagged intervals and many intervening stimuli between repeats. We report three main findings: 1) robust RS occurs in VTC for activity in high-frequency broadband (HFB), but not lower-frequency bands; 2) RS of the HFB signal is associated with lower peak magnitude (PM), lower total responses, and earlier peak responses; and 3) RS effects occur early within initial stages of stimulus processing and persist for the entire stimulus duration. We discuss these findings in the context of early and late components of visual perception, as well as theoretical models of repetition suppression.
Keywords: adaptation, electrocorticography, perception, repetition suppression, temporal dynamics
Introduction
Repeated exposures to sensory stimuli produce decreased neural responses, a phenomenon known as repetition suppression (RS), habituation, or adaptation. RS is common across sensory modalities in humans (Buckner et al. 1995; Grill-Spector et al. 1999; Henson et al. 2000; Alink et al. 2018) and nonhuman primates (Gross et al. 1969; Gross et al. 1979; Miller et al. 1991; Lueschow et al. 1994; McMahon and Olson 2007). RS is also considered a simple form of sensory learning (Thorpe 1956; Groves and Thompson 1970; Miller et al. 1991) and a critical mechanism for perception (Grill-Spector et al. 2006). Despite the ubiquity and proposed role of RS in perception, a surprising dearth of studies have examined RS using human intracranial measurements.
To our knowledge, the few studies that have examined RS in human VTC using intracranial electrophysiology implemented experimental designs in which the interstimulus intervals (ISIs) were short (largely between 275 and 500 ms (Puce et al. 1999; McDonald et al. 2010; Engell and McCarthy 2014; Rodriguez Merzagora et al. 2014; Miller et al. 2015). These experiments were motivated by 1) seminal findings showing that RS decreases with increasing ISIs, and is ablated once the ISI reached 20 s (Miller et al. 1991), and 2) recent studies of RS in macaque inferotemporal cortex, which continue to use short ISIs to maximize RS (McMahon and Olson 2007; Verhoef et al. 2008; De Baene and Vogels 2010; Kaliukhovich and Vogels 2011; Kuravi and Vogels 2017). Interestingly, event-related potential (ERP) and functional magnetic resonance imaging (fMRI) experiments have replicated and extended the characterization of repetition effects in the human brain (Schweinberger et al. 1995; Doniger et al. 2001; Schweinberger et al. 2002; Henson and Rugg 2003; Jacques et al. 2007; Kuehl et al. 2013; Henson 2016). These studies illustrated that RS 1) occurs even with just a single stimulus repetition (Schweinberger et al. 2002; Sayres and Grill-Spector 2006), 2) transpires across many intervening stimuli between image repetitions (Chao et al. 1999; Henson et al. 2000; Sayres and Grill-Spector 2006; Weiner et al. 2010), and 3) is larger for repetitions with no intervening stimuli and shorter time lags (Chao et al. 1999; Sayres and Grill-Spector 2006; Weiner et al. 2010; Kuehl et al. 2013).
Despite these findings across species and methodologies, the temporal characteristics of RS recorded directly from human VTC remain largely unknown, especially for long-lagged repetitions in which the repeated stimulus occurs after multiple other stimuli, typically after intervals longer than 10 s. Long-lagged repetitions are particularly interesting as they reflect an implicit neuronal memory trace and cannot be explained by refractory periods that may dampen the generation of action potentials (Grill-Spector et al. 2006; Fabbrini et al. 2019). As high-frequency broadband (HFB) signals are correlated with neuronal firing and local field potentials (LFP) (Ray and Maunsell 2011), recording HFB signals directly from the awake human brain offers a unique opportunity to determine the temporal characteristics of long-lagged RS.
To study the temporal characteristics of long-lagged RS, we conducted an electrocorticography (ECoG) experiment in nine participants in which we measured electrical signals from VTC in response to novel and repeated images of faces. We examined repetition effects on visual responses to faces for two reasons: First, a large body of research documents both face-selective responses in VTC with ECoG (Allison et al. 1999; McCarthy et al. 1999; Parvizi et al. 2012; Davidesco et al. 2013; Rangarajan et al. 2014; Jonas et al. 2016) and robust RS for faces in VTC with fMRI (Grill-Spector and Malach 2001; Sayres and Grill-Spector 2006; Weiner et al. 2010; Engell and McCarthy 2011). Second, all of our participants had electrodes located on the fusiform gyrus (FG) where face-selective regions reside (Kanwisher et al. 1997; Weiner et al. 2010). In contrast, we did not have consistent coverage of other category-selective regions in VTC. We analyze both the magnitude and temporal characteristics of responses to repeated images and end the manuscript by discussing our findings in the context of theoretical models of RS (Grill-Spector et al. 2006) as well as bottom-up and top-down components of visual perception.
Methods
Participants
Nine subjects (three females) were implanted with intracranial electrodes for neurosurgical evaluation for the treatment of refractory epilepsy. Electrode locations were chosen exclusively for clinical reasons by the subjects’ neurologist and neurosurgeons. The electrodes (AdTech) were implanted in the right and left hemispheres in four and four subjects, respectively, with one bilateral strip implantation. Electrodes had either 5- or 10-mm interelectrode spacing (center to center) with an exposed recording surface diameter of 2.3 mm. All subjects gave informed written consent to participate in research studies at Stanford Medical Center as approved by the Stanford University Internal Review Board. All electrodes clinically implicated in the epileptogenic zone (as clinically determined) were excluded from the analysis. In order to localize the electrodes, high-resolution MRIs were acquired on a 3-Tesla GE scanner as previously described (Rangarajan et al. 2014). Postimplantation computed tomography (CT) images were coregistered to the MRIs to visualize electrode locations in the subjects’ native headspace (Hermes et al. 2010).
Experimental Paradigm
The subjects participated in an experimental visual paradigm (Fig. 1). The subjects viewed images of faces, limbs, cars, and houses that were presented foveally at a visual angle of approximately 10° by 10°. Each stimulus was presented for a duration of 1000 ms with a randomized interstimulus interval varying between 600 and 1400 ms. Some of the images were shown only once, and some of the images were shown repeatedly (up to six times) during the experiment. On average, there were 8 ± 1 intervening stimuli and 27.5 ± 8.6 s between the first and second presentations of the same image. The distributions of intervening stimuli and trial timing showed that 75% of trials had between 5 and 15 intervening stimuli and 10 and 30 s between repetitions. Images were equally likely to be repeated or nonrepeated throughout the course of the experiment. Images of all presented categories were included in both the nonrepeated and repeated conditions. The nonrepeated stimuli served two purposes: 1) they were used as independent trials to assess the category selectivity of each electrode, and 2) they were used as intervening stimuli between repetitions of the same image.
Figure 1 .
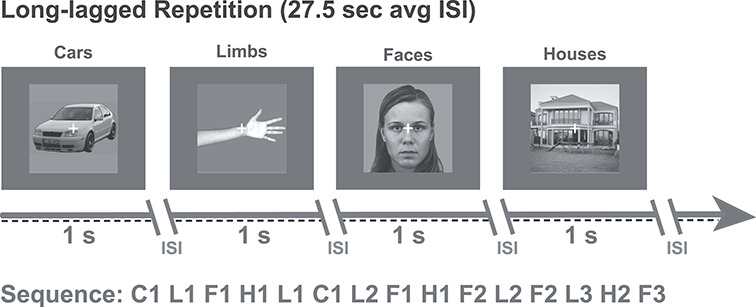
Design of RS long-lagged experiment. All nine participants viewed images of cars, limbs, faces, and houses. Images were presented for 1 s each with a randomized interstimulus interval (ISI) ranging between 600 and 1400 ms. The average time between repeats of the same image was 27.5 ± 8.59 s. Task: participants were instructed to fixate on a central cross and press a button on a keypad when it changed color from white to red. Example image sequences are shown for each experiment with letters indicating the stimulus category; F, faces; L, limbs; C, cars; H, houses. Numbers indicate the exemplar identity (e.g., F1 is face exemplar number 1).
Task
Participants were instructed to fixate on a central fixation dot and to indicate when its color changed by pressing a button on an external keypad. Each subject participated in 5–10 runs of the experiment. Each run consisted of 96 stimuli which were divided into repeated (48 stimuli) and nonrepeated (48 stimuli) images across the four stimulus categories. The order of repeated and nonrepeated stimuli and order of categories were randomized for each subject with all six repetitions of an exemplar constrained to be contained within the same run. This resulted in an average of 16 repeated face exemplars per subject across runs (with each exemplar repeated 6 times each). One subject’s behavioral responses were not recorded because of a button-box malfunction (see behavioral performance in Supplementary Table 1).
Data Acquisition
Intracranial electrode activity was recorded on a Tucker Davis Technologies recording system sampled at 3052 Hz (subjects S1–7) and 1526 (S8–9). Signals were referenced online to a silent intracranial electrode and digitally bandpass filtered from 0.5 to 300 Hz. Pathological channels, as identified by the clinical team as showing seizure-like activity or falling within the seizure onset zone, and noisy (artifactual) channels were removed before data processing. Additionally, channels containing voltage greater than five times the mean variance in voltage were also removed. Finally, subsequent samples with greater than a 100-uV jump, indicating an artifactual spike, were marked as bad temporal windows and excluded. The remaining channels (mean: 68 ± 26 electrodes/subject) were notch filtered at 60-Hz harmonics and then rereferenced to the common average to remove shared noise. The onsets of stimulus presentations were marked with a photodiode, time-locked to the neural data, and sampled at 24.4 kHz to maintain high temporal fidelity.
Time-Frequency Data Processing
In order to be consistent with the literature in the field (Cole and Voytek 2017; Kane et al. 2017) and EEG/ECoG standards, the data were filtered for analysis in canonical frequency bands: theta (Θ, 4–8 Hz), alpha (α, 8–13 Hz), beta (β, 16–30 Hz), and high-frequency broadband (HFB, 70–150 Hz). β and HFB data were obtained by bandpass filtering the original signal using 5-Hz nonoverlapping frequency bins (e.g., 70–75, 75–80 … 145–150 Hz). The time-varying power in each 5-Hz bin was estimated by applying a Hilbert transform (analytic amplitude squared). Each power time series was log-transformed, and the mean for the entire log power time series was subtracted. The transformed power time series were then averaged per canonical frequency band and downsampled to 100 Hz. This resulted in time series activity for Θ, α, β, and HFB activity corrected for the 1/frequency power decay in each frequency range. All analyses were done using custom MATLAB (MathWorks Inc) analysis scripts. All data were normalized (z-scored) with respect to the average of the 150-ms prestimulus baseline period per stimulus by subtracting the mean of the 150 ms before stimulus onset and dividing by the standard deviation (SD) of this time window.
Localization of Face-Selective Electrodes
In each subject, we identified face-selective electrodes using independent data from trials containing images that appeared only once during the long-lagged experiment, as in our prior studies (Parvizi et al. 2012; Rangarajan et al. 2014; Jacques et al. 2016). In each electrode, we calculated the mean HFB power over a 0–900-ms window after stimulus onset averaged across all images from each category that were shown once. Then, we conducted two-sided t-tests to test if responses were significantly higher to images of faces compared with images of non-faces (P < 0.05). A false discovery rate procedure (FDR; Benjamini–Hochberg procedure; (Benjamini et al. 2001) for multiple-comparison correction was applied (α = 0.05) across electrodes within each subject. Importantly, the stimuli used for electrode-selectivity identification were excluded from all further analyses. Thus, all repetition suppression analyses were conducted with independent data.
To visualize the location of face-selective electrodes on a common MNI brain, the 3D whole brain anatomical images and electrode coordinates for each subject were converted to the MNI space and displayed over the mean cortical surface of the MNI brain (Hermes et al. 2010) as in our prior studies (Rangarajan et al. 2014). On the MNI brain, we displayed all recorded electrodes across subjects as well as the subset of face-selective electrodes, as illustrated in Figure 2. Given the variable nature of electrode coverage, we did not have many non-face category-selective electrodes (e.g., place-selective or limb-selective). In fact, no category, other than faces, had more than 10 selective electrodes across all 9 subjects (houses = 7, limbs = 10, cars = 7).
Figure 2 .
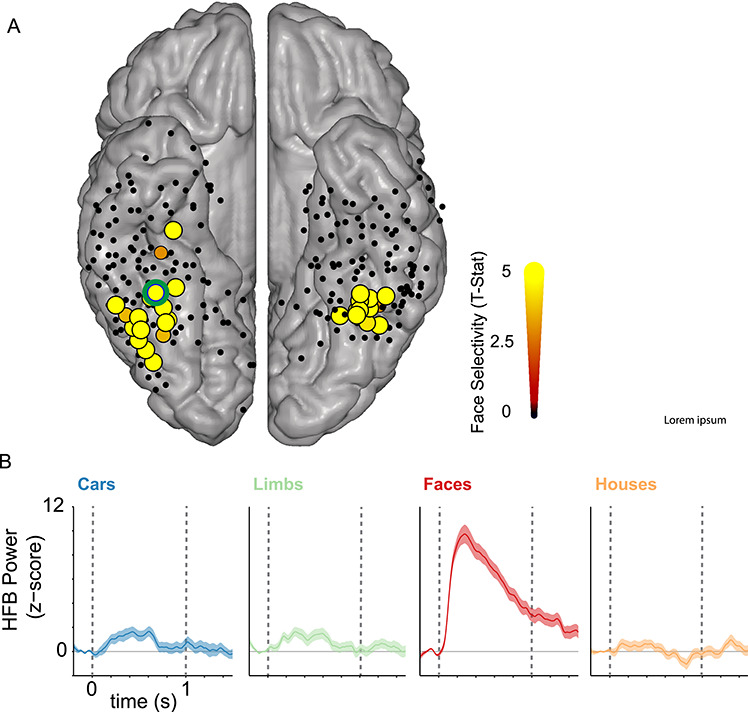
Face-selective electrodes in the VTC. (A) All electrodes from the VTC were projected into MNI space and illustrated on the Colin brain cortical surface. The color and size of the electrode indicate the degree of face selectivity, measured in the high-frequency broadband (70–150 Hz) range. That is, larger size and brighter color indicate larger face selectivity (see color bar). Face selectivity was determined in each electrode by comparing the average magnitude of HFB response for faces versus non-faces during a time interval of 0–0.5 s. This selectivity was determined using independent trials during the long-lagged experiment which contained stimuli that appeared only once during the experiment. Yellow electrodes showed significantly higher HFB responses to faces than non-faces (t-value, FDR corrected P < 0.05). Black electrodes did not show significant preference to faces. We identified a total of 48 face-selective electrodes in VTC, which were anatomically positioned on the FG and occipitotemporal sulcus (OTS) across the nine subjects. On average, there were 6 ± 4 face-selective electrodes per subject. All subjects had at least one face-selective electrode. Some electrodes are not visible in the group average due to spatial overlap. (B) Average HFB responses across items of a category in an example electrode (green outline in A) located near the mid-fusiform sulcus (MFS). Dashed vertical lines: stimulus onset and offset, respectively.
Analyses of Neural Responses to the First and Second Presentations of Images Across Frequency Bands
Because different frequency bands are thought to represent varied features of electrocortical activity (Ray and Maunsell 2011; Miller et al. 2014), we examined responses to first and second stimulus presentations separately for each of the canonical frequency bands: theta (Θ, 4–8 Hz), alpha (α, 8–13 Hz), beta (β, 16–30 Hz), and high-frequency broadband (HFB, 70–150 Hz) in each electrode.
Statistical Analyses and Justification of Time Windows
We performed a two-way repeated-measures analysis of variance (ANOVA) using as factors stimulus presentation number (first and second face presentations, this is a repeated factor, which resulted in one degree of freedom) and frequency bands (Θ, α, β, and HFB, which resulted in three degrees of freedom) across a time window from stimulus onset to the end of the trial (0–900 ms). The last 100 ms of the trial (900–1000) was omitted to avoid any edge effects resulting from the stimulus offset. Within-band statistical tests were done on the average response across all electrodes using t-tests comparing the total response for the first and second face presentations over the entire (0–900 ms) window. To test if any within-band effects were due to the early evoked or later response, we next performed statistical analyses comparing responses across first versus second presentations in two smaller time windows: 1) 0–350 ms (reflecting early visually evoked responses) and 2) 350–900 ms (reflecting the response after the evoked response).
Determining Significant Electrode-Level Repetition Suppression Effects
Subsequent analyses focused on HFB activity because only HFB responses showed significant differences in responses between the first and second presentations. Additionally, HFB activity is thought to reflect population spiking activity (Manning et al. 2009) and local postsynaptic activity (Logothetis et al. 2001; Miller et al. 2010), which correlates with BOLD responses (Hermes et al. 2012; Jacques et al. 2016). To determine if RS was significant (P < 0.05), in each individual face-selective electrode, we conducted a two-sided t-test of the response to the first versus second face presentations in the 0–900-ms time window, which is reported in Supplementary Table 1. A false discovery rate procedure (FDR: Benjamini–Hochberg procedure (Benjamini et al. 2001)) for multiple-comparison correction was applied (α = 0.05) across electrodes.
To visualize the temporal dynamics of neural responses to stimulus repetition in VTC, we implemented a 2-fold procedure (Supplementary Movie 1). First, for each electrode, we computed a paired t-statistic comparing mean HFB responses for the first versus second face presentation. These values were calculated in each 10-ms bin during an interval between 0 and 900 ms after stimulus onset. Second, we generated a movie of these values by visualizing the t-value of each electrode on the MNI surface across 10-ms time bins. This enabled visualizing the spatial and temporal effects of stimulus repetition across face-selective electrodes. For display purposes, the additive spatial distribution of t-values across electrodes were scaled to the same maximum and minimum (−2 (blue) and 2 (red), respectively) and corrected for the spatial distribution and overlap of included electrodes. In a single subject plot, electrode activities are plotted as a Gaussian around each electrode. With numerous subjects in MNI space, electrode coordinates overlap, which could falsely create patches of higher electrode density to appear to have more activity. To correct for this, we created a density map of the cortex, in which every electrode is given a value of 1. Anatomical areas with higher density of electrodes are then summed and would have a higher value (e.g., 10). These numbers for electrode density are then normalized between 0 and 1 (so electrodes in the example high-density region would be 0.1). This scaled density value is then multiplied by the activity of each electrode to correct for the spatial density of the channels, which controls for varied electrode coverage and prevents areas with higher spatial overlap of electrodes from appearing to be more face responsive. The video is slowed down 10 times such that 900 ms is displayed for 9 s. We tested if the average values for each 10-ms time window were significantly different using a t-test (first versus second presentation; P < 0.05) to identify the rough onsets of RS or repetition enhancement effects at the group level.
Metrics Quantifying Stimulus Repetition
In all face-selective electrodes, we quantified the effect of stimulus repetition on HFB responses from single trials (e.g., responses to a single stimulus) using four metrics that capture the features of the HFB temporal response as well as its overall response amplitude. These effects were measured for face as well as house, limb, and car image repetitions:
Area under the response curve (AUC) is a measure of the total neural response. It was measured separately for each stimulus for the first (nonrepeated) and second (repeated) presentation. AUC was calculated for each trial using a trapezoidal numerical integration, which reflects a sum of all responses in the HFB band between a 0- and 900-ms time window in 10-ms steps per trial.
Peak magnitude (PM) was calculated by finding the peak (maximum) HFB z-score value separately for the first and second presentation of each stimulus and then measuring the average response across a 10-ms window surrounding the peak. The 10-ms time window provides an estimate of the peak response that is less susceptible to noise-related fluctuations.
Response onset latency (ROL) of the neural signal was calculated by adapting the approach of Flinker et al. (2010). We first identified the trials that showed a response to the stimuli. Responsive trials were defined as those trials in which responses significantly exceeded a null distribution of 1000 mean HFB epochs with random sampling. For these trials, we measured ROL during a 0–500-ms time window after stimulus presentation. The ROL was defined as the first time point during the 0–500-ms time window in which the response passed the HFB z-score threshold (P < 0.05 relative to baseline) for a duration of least 50 ms. This criterion was to ensure that we did not consider a momentary fluctuation as the response onset.
Peak timing (PT) was calculated as the timing of the maximal (peak) response for a given trial. Peak response was defined as the maximal HFB z-score value. PM and PT were calculated separately for the first and second presentations of each image. This trial-by-trial resolution enabled us to assess temporal variability between trials. All peaks >500 ms were excluded as noise for a conservative estimate of peak timing.
Statistical Testing
AUC, PM, ROL, and PT values were calculated at the single trial level and then averaged across trials per electrode. We examined the mean difference values (second to first presentation) per electrode as well as the total mean across electrodes for each of these metrics for first and second presentations across all trials for each electrode. We then tested whether these values followed a normal distribution in order to determine which statistical tests were appropriate. Distributions that exhibited a skew of <±2 and a kurtosis <±7 were tested using parametric tests (Bryne 2001; Hair 2009). Here, we tested if the mean values across electrodes for each metric were significantly different across the first versus second presentation using a two-sided t-test to identify which metric showed a significant positive or negative shift (P < 0.05). Those that were not normally distributed were tested with a nonparametric Wilcoxon rank sum test. All analyses were then repeated for the subsequent repetitions of each stimulus, that is, third, fourth, fifth, and sixth presentations of faces.
Assessment of Repetition Effects for Non-preferred Stimuli in Face-Selective Electrodes
AUC, PM, ROL, and PT values were calculated at the single trial level for the non-preferred stimulus categories (houses, limbs, cars) and then averaged across trials per electrode. We examined the mean difference values (second to first presentation) per electrode as well as the total mean across electrodes for each of these metrics for first and second presentations across all trials for each electrode. Distributions that exhibited a skew of <±2 and a kurtosis <±7 were tested using parametric tests. Here, we tested if the mean values across electrodes for each metric were significantly different across the first versus second presentation using a two-sided t-test to identify which metric showed a significant positive or negative shift (P < 0.05). Those that were not normally distributed were tested with a nonparametric Wilcoxon rank sum test. To correct for multiple comparisons, we used a false discovery rate procedure (FDR: Benjamini–Hochberg procedure (Benjamini et al. 2001)) with α = 0.05.
Discriminability of Distributed Response to Faces Versus other Categories Over Time and Repetitions
To determine the representational structure and discriminability of faces from non-face categories, we measured distributed responses across face-selective electrodes. To remove between-electrode differences in overall amplitude that can be due to irrelevant factors such as impedance, we normalized the time course of each electrode. To do this, we concatenated the Training (nonrepeated), Presentation 1, and Presentation 2 trials for all four categories (face, house, limb, car) and then detected the top and bottom 10% of values per electrode. The mean of the top 10% and bottom 10% were set to the maximum and minimum, respectively. We then subtracted the minimum from each time point and divided it by the maximum minus minimum value ((value − min)/(max − min)) to normalize the electrode time course to a range between 0 and 1. This normalization was done separately for each electrode. One subject (S8) showed electrode time courses that had outlier temporal responses across all conditions determined using Thompson’s Tau outlier rejection (mean onset of electrode more than three SDs away from the mean onset across electrodes). These outliers generated a between-electrode difference that affects the pattern of distributed responses. To eliminate between-electrode effects in distributed analyses, we removed these outliers (six face-selective electrodes of S8).
To determine the discriminability of patterns from each category, we then calculated the correlation between the distributed response across the 42 face-selective electrodes between the training set (nonrepeated images) and each of the testing sets (Presentation 1 and Presentation 2) for each of the four stimulus categories (faces, houses, cars, and limbs). Discriminability is defined as significantly higher within-category than between-category correlations. Correlations between distributed responses were calculated in 10-ms time windows from 150 ms before stimulus onset till 900 ms after stimulus onset. For each pairwise correlation, we calculated the bootstrapped (50 iterations) correlation across 75% of electrodes (n = 36 electrodes) that were randomly selected with replacement, to allow for an error estimate on the correlation values. We reasoned that face information would be associated with higher within-category distributed responses (face–face) than between-category distributed responses (limb-face/car-face/house-face). To evaluate if face discriminability arises at different times for Presentation 1 versus Presentation 2, we computed the within-category (face-face) correlation minus the average of between-category correlations (face/non-face) for the first and second presentations in each 10-ms time window with bootstrapping (50 iterations, 75% electrodes per bootstrap) and tested if discriminability varied across repetitions and at which time bins.
Results
Stimulus Repetition Reduces Neural Responses (Repetition Suppression, RS) in High-Frequency Broadband, But Not Other Frequency Bands
We first examined the effect of long-lagged image repetitions on ECoG responses by comparing ECoG signals for the first and second presentations of faces in each of the canonical Θ, α, β, and HFB frequency bands. Figure 3 shows the mean response across all 48 face-selective electrodes, which were localized with independent data (Fig. 2) for each of these frequency bands during the first (red) and second (blue) presentations of face images (S1 = 9, S2 = 11, S3 = 3, S4 = 10, S5 = 2, S6 = 2, S7 = 1, S8 = 8, S9 = 2 face-selective electrodes). Notably, we observed reduced responses for the second compared with the first presentation (or repetition suppression, RS) in the HFB, but not other frequency bands.
Figure 3 .
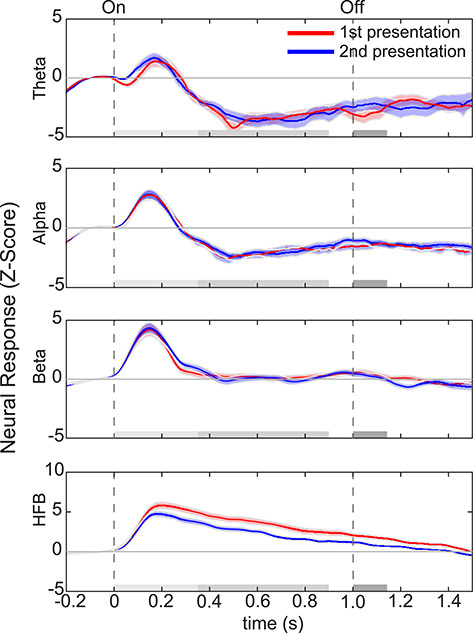
RS in human VTC occurs in HFB, but not lower-frequency bands. Average responses to first (red) versus second (blue) presentations of faces across all face-selective electrodes. Each row shows neural responses in a different frequency band. From top to bottom, frequencies are theta (Θ, 4–8 Hz), alpha (α, 8–13 Hz), beta (β, 16–30 Hz), and high-frequency broadband (HFB, 70–150 Hz). Shaded region: standard error of the mean across 48 face-selective electrodes. Dashed vertical lines: stimulus onset and offset, respectively. Gray horizontal bars illustrate the following time windows of interest: 1) light gray, 0–350 ms (evoked response); 2) medium gray, 350–900 ms (later response); 3) light and medium gray, 0–900 ms (stimulus duration); and 4) dark gray, 1000–1150 ms (post trial activity).
We assessed the significance of our observations using a two-way repeated-measures analysis of variance (ANOVA) on the total HFB response integrated over a 0–900-ms time window after the stimulus onset using presentation number (first/second) as a repeated factor and frequency band (Θ, α, β, and HFB) as a factor. Across all subjects (S1–9), we found a significant main effect of frequency band [F(3, 188) = 95.537, P = 1.34 × 10−37], a significant main effect of repetition [F(1, 188) = 11.712, P = 7.6 × 10⁻⁴], and a significant interaction [F(3, 188) = 89.856, P < 4.1 × 10−36].
Given the significant main effect of frequency band and repetition, as well as the significant interaction, we conducted post hoc analyses to identify which specific frequency bands and time windows were driving the effect. We first conducted this analysis across the whole time window used in the analysis above: 0–900 ms (stimulus duration). Subsequently, we wanted to test if any significant results were due to the evoked or later response. Therefore, we used two smaller time windows: a time window from 0 to 350 ms (consisting of the evoked response), as well as a time window between 350 and 900 ms (the remainder of the stimulus duration after the evoked response).
The examination of the time course of neural responses revealed significant RS to the second versus first presentation in the HFB response (Fig. 3). RS was significant for HFB activity from the entire 0–900-ms window (t-test, t(47) = 4.16, P = 1.35 × 10⁻⁴, df = 47: n − 1 electrodes, FDR corrected). Significant RS in HFB was already evident in the early (0–350 ms) portion of the trial (t-test, t(47) = 3.82, P = 3.9 × 10⁻⁴, FDR corrected). This 0–350-ms temporal window is associated with the synchronized evoked visual response that is prominent in low frequencies. Notably, significant RS in the HFB persisted beyond the evoked response in the 350–900-ms time window (t-test, 350–900 ms; t(47) = 4.12, P = 1.5 × 10⁻⁴, FDR corrected). Interestingly, even up to 150 ms after the stimulus was off, RS persisted; there was a significant difference between the response to the second versus first presentation in the 1000–1150-ms time window (t-test, t(47) = 3.72, P = 3.2 × 10⁻⁴, FDR corrected).
In comparison with neural responses in the HFB, responses in Θ, α, and β frequency bands were more transient. Specifically, responses in these frequency bands increased from baseline during a 0–350-ms time window after stimulus onset and then returned to baseline. Interestingly, there was no significant RS in Θ (t-test, t(47) = 0.19, P = 0.85, FDR corrected), α (t-test, t(47) = 0.08, P = 0.93, FDR corrected), or β (t-test, t(47) = 0.11, P = 0.91, FDR corrected) frequency bands across the entire stimulus duration (0–900 ms) or in the early evoked response period (t-test: Θ, t(47) = 0.61, P = 0.55; α, t(47) = −0.20, P = 0.84; β, t(47) = 0.93, P = 0.36). Altogether, these results indicate that RS largely occurs in HFB, but not lower-frequency bands, and that RS persists throughout the entire stimulus duration.
Visualizing the Spatiotemporal Dynamics of RS in Human VTC
We visualized the spatiotemporal dynamics of RS in human VTC. To do so, we generated Supplementary Movie 1 that illustrates the average difference in HFB response (t-values) between the first and second presentations of each face image in 10-ms time bins for each of the 48 face-selective electrodes. Consistent with our subsequent analyses and statistical quantification, Supplementary Movie 1 shows that the most pervasive effect of stimulus repetition is reduced HFB responses to the seond compared with the first presentation. Spatially, this reduction (illustrated in the warm colors in Supplementary Movie 1) occurs primarily in the lateral fusiform gyrus (FG). Interestingly, RS is evident early in the response and appears within the first 100–200 ms after stimulus onset in several electrodes. The first significant 10-ms window across all electrodes showing RS was on average 153.75 ms (90% CI: 23:410). RS 1) persists throughout the duration of the stimulus, 2) increases over time, and 3) spreads both more posteriorly and anteriorly, particularly in the right hemisphere. We were not able to assess hemispheric lateralization effects as there were only three left hemisphere electrodes with time bins showing significant RS. We also note that three electrodes in the right hemisphere showed a weak enhanced response to the second versus first presentation. Of these, two electrodes were located in the right inferior temporal gyrus (ITG), and one was located in the anterior and medial aspects of the right FG. In these three electrodes, the first 10-ms time window showing significant repetition enhancement appeared later in the trial, on average 376.25 ms (90% CI: 26:690) after stimulus onset. The spatial and temporal dynamics of RS in HFB are further quantified in the following sections.
Reduced Total and Peak Response Amplitudes in HFB for Repetitions in Single Electrodes
The prior quantitative analyses of RS examined neural responses integrated across trials and across electrodes, which may obscure finer temporal characteristics of RS visible in Supplementary Movie 1. Thus, we next examined the spatial and temporal dynamics of HFB responses in each electrode. As RS effects in the HFB persisted throughout the trial, all subsequent analyses were done in the 0–900-ms time window. To characterize responses over time, we calculated and compared four metrics of the HFB response for first and second face presentations (Methods, Fig. 4A): 1) total response (area under the response curve, AUC), 2) peak magnitude (PM), 3) response onset latency (ROL), and 4) peak timing (PT). Each metric was calculated at the single trial level and then averaged across all trials for each electrode. Statistics were performed across electrodes.
Figure 4 .
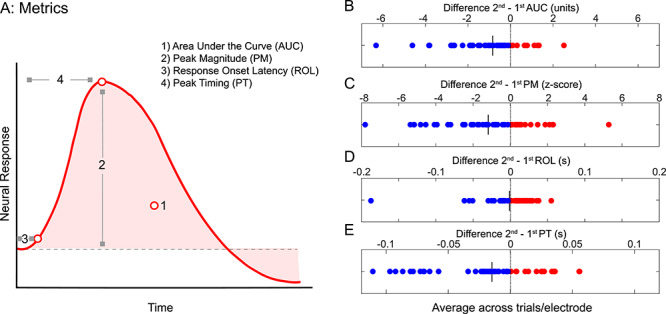
Quantifying the effect of repetition on the magnitude and timing of HFB responses. (A) Schematic illustration of four metrics of the HFB signal that were calculated for each of the 48 face-selective electrodes: 1) Total HFB response, which is the area under the curve (AUC) from 0 to 900 ms (light red), 2) Peak magnitude (PM), 3) Response onset latency (ROL), and 4) Peak timing (PT). (B) Difference in total response, area under curve: AUC (second presentation)—AUC (first presentation) for faces. (C) Difference in peak magnitude: PT (second presentation)—PT (first presentation) averaged over a 10-ms window surrounding the peak. (D) Difference in response onset latency: ROL (second presentation)—ROL (first presentation). (E) Difference in peak timing: PM (second presentation)—PM (first presentation). In B–E, each point is an electrode. Blue: negative values indicate decrements. Red: positive values indicate increments. Vertical black line: mean value across electrodes.
Examination of the effect of repetition on 1) the total HFB response (AUC) and 2) the peak magnitude (PM) revealed two main findings. First, the total HFB response was reduced for second versus first presentation of faces at the fine-spatial scale of a single electrode (Fig. 4B). The mean AUC for the first presentation was 3.4 ± 2.1 versus 2.5 ± 1.6 for the second presentation. 77.1% (37/48) of electrodes across all (9/9) subjects showed lower AUC values for the second versus first presentation (Supplementary Table 1), leading to a negative difference in the AUC between presentations (blue dots in Fig. 4B) at the group level. Statistical comparisons of the first versus second presentations showed a significant reduction in the total AUC of HFB responses (Fig. 4B; paired t-test t(47) = 4.16, P = 1.34 × 10⁻⁴, FDR corrected). Additionally, 22.9% (11/48 electrodes from 6/9 subjects) of electrodes showed a change in the AUC that is either equal to zero or enhanced (second > first). The specific electrodes showing a significant reduction in total response (paired t-test, FDR corrected) are indicated in Supplementary Table 1. In contrast, only three electrodes showed a significant repetition enhancement in the HFB reflected by a substantial increase in the AUC (paired t-test P < 0.05, FDR corrected; Supplemental Fig. 1). Further, repetition enhancement occurred only in smaller intervals during the trial, but not over the complete trial (Supplementary Movie 1).
Second, we examined the effect of repetition on the peak magnitude (PM) of responses in each electrode. PM metrics are reported in units of z-score relative to the baseline (mean prestimulus response) to control for between-electrode differences in overall response magnitude (see Methods). This analysis revealed that PM of the response was smaller for the second compared with the first presentation of a face. Indeed, the mean PM for the first presentation was 7.5 ± 3.0 SDs away from the baseline, while the second presentation was only 6.3 ± 2.6 SDs away from the baseline. Similar to the analysis of the AUC, the majority of electrodes (64.6%, 31/48 electrodes from 8/9 subjects) showed a negative PM difference between the second versus first presentation (Fig. 4C; paired t(47) = 3.39, P = 0.001, FDR corrected). PM reduction between second and first presentations was significantly correlated with AUC decrease between second and first presentations of faces (Pearson r = 0.87, P = 4.6 × 10⁻¹⁶). These analyses suggest that both AUC and PM reduce with repetition and these magnitudes are significantly correlated.
One may intuit that changes in task performance may contribute to reductions in PM or AUC for the second presentation. Subjects were instructed to indicate a change in the color of the central fixation dot. We note, however, that task performance cannot explain reductions in PM or AUC, as the changes in fixation did not occur on every trial and were orthogonal to both the repetition and content of our stimuli (Supplementary Table 1). Together, these analyses indicate that both the total HFB response and peak HFB response are lower for the second versus first presentation of a face, illustrating significant RS in face-selective electrodes for long-lagged stimulus repetitions.
Peak Timing Is Faster for the Second Compared with the First Image Presentation in a Majority of Electrodes
Next, we quantified the temporal profile of neural responses to face repetitions using two metrics: 1) the response onset latency (ROL) of HFB responses and 2) peak timing (PT) of HFB responses. The mean response onsets to the first and second presentations were 101.8 ± 38 ms and 100.2 ± 31.4 ms, respectively, which were not significantly different. Examination of the differences in ROL for the second versus first presentations of faces showed a delayed onset in 27/48 electrodes (56.3%, 8/9 subjects) for second versus first presentations of faces, while the remaining electrodes (43.7%, 21/48 electrodes from 8/9 subjects) showed the opposite effect (Fig. 4D). Consequently, across electrodes, there was no significant difference in the ROL (Wilcoxon rank sum test, z = −0.726, P = 0.468) between the first and second presentations.
It is interesting that while there were no differences in ROL, PT was earlier for the second compared with the first presentation of a face in the majority of face-selective electrodes (64.6%, 31/48 electrodes, 8/9 subjects). Indeed, the mean PT for the first presentation of a face was 276 ± 39 ms and for the second presentation was 259 ± 51 ms. Statistical comparisons of the first versus second presentations showed a significant earlier PT (paired t-test: t(47) = 2.83, P = 0.0068, FDR corrected), which was on average 17 ± 4 ms faster for the second than first presentation. Additionally, a minority of electrodes (n = 5) showed the converse pattern and a significantly delayed PT (P < 0.05) during second compared with first stimulus presentations. Notably, PT did not correlate with either AUC (Pearson r = 0.18, P = 0.23) or PM (Pearson r = 0.065, P = 0.66). This seems to indicate that while the timing of the peak is affected by repetition, it does not correlate with the magnitude-based metrics of RS.
To confirm that our findings were not due to outliers, we implemented a Thompson’s Tau outlier rejection which removes samples more than three SDs away from the mean. The outliers removed were not all from the same electrode, and the group comparisons of AUC, PT, and PM between first and second presentations remained significant. Taken together, analyses of the temporal dynamics illustrate that HFB responses are overall lower and have a smaller peak magnitude, as well as an earlier time to peak for the second compared with the first presentation of faces.
RS and Temporal Dynamics Are Different for Non-preferred Categories Compared with Faces in Face-Selective Electrodes
An interesting question is whether RS also occurs for non-preferred stimuli in face-selective electrodes. Prior fMRI data show that the magnitude of RS (difference in signal amplitude) is larger for the preferred category than the non-preferred category, consistent with a scaling mechanism of RS (Weiner et al. 2010). Thus, we next examined the responses to the first versus second presentation of houses, limbs, and cars in the same face-selective electrodes (electrodes shown in Fig. 2). We tested if changes to the response profile for second versus first presentations of non-preferred categories were similar to the RS effects (lower total response (AUC), smaller peak magnitude (PM), and earlier peak timing (PT) observed for second versus first face presentations. We emphasize that we only examined RS effects to other categories within face-selective electrodes as opposed to also examining RS to images of these categories in other electrodes that may be selective to these categories (e.g., house repetitions in house-selective electrodes) due to limited electrode coverage in VTC (Methods).
The largest effect of RS was on the total response change for second versus first presentations of faces. When comparing the total response (AUC) between the first and second presentation of houses, limbs, and cars, only repetitions of limbs caused a significant reduction (AUC paired t-test: t(47) = 2.23, P = 0.03, FDR corrected), while cars (Wilcoxon rank sum, z = −0.3, P = 0.52) and houses (t-test, t(47) = 1.78, P = 0.08, FDR corrected) did not (Fig. 5A). This lack of RS may be due to the limited initial HFB response to the first presentation of cars and houses in face-selective electrodes (see example responses in Fig. 2). However, some electrodes show an enhancement effect for houses where the second presentation elicits a higher HFB response than the first.
Figure 5 .
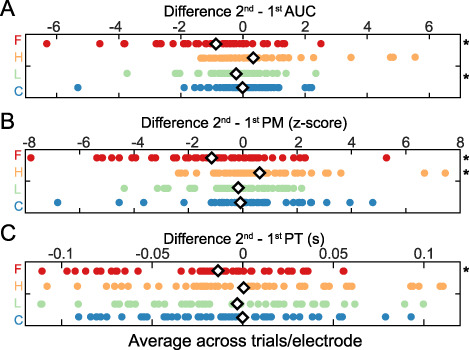
Repetition effects for non-preferred categories in face-selective electrodes. The mean difference between second and first presentations for (A) AUC, (B) PM, and (C) PT. Each dot indicates a single electrode value. Red, F, faces; orange, H, houses; green, L, limbs; blue, C, cars. Asterisk: significant difference (P < 0.05, t-test) between first and second presentations, FDR corrected across electrodes. White diamond: mean value for each category.
Similarly, when comparing the change in PM to the first versus second presentation of houses, limbs, and cars, there was no significant reduction in PM between second and first stimulus presentations in face-selective electrodes (Fig. 5B; limbs paired t-test, t(47) = 1.39, P = 0.17; cars Wilcoxon rank sum test, z = −0.64, P = 0.52). In fact, the PM was actually enhanced in house repetitions (paired t-test: t(47) = 2.18, P = 0.03, FDR corrected) indicated by the rightward shift of the house difference values in Figure 5B. This suggests that in face-selective electrodes, a reduction occurs for the preferred stimulus (faces), while there is largely no change or enhancement in response to non-preferred stimulus categories.
Finally, we compared the changes in timing parameters (ROL and PT) to the first versus second presentation of houses, limbs, and cars in face-selective electrodes. As no ROL change was found for face repetitions, no change was expected for ROL for repetitions of images from non-preferred categories as well. Houses (paired t-test, t(47) = 1.64, P = 0.1075, FDR corrected) and limbs (paired t-test, t(47) = 2.04, P = 0.05, FDR corrected) showed no change for the ROL, but cars showed a slightly earlier response onset for the second presentation versus the first (paired t-test, t(47) = 2.33, P = 0.02, FDR corrected). As PT was earlier for the second presentation of faces in face-selective electrodes, we predicted an earlier PT for repetitions of non-preferred categories in these electrodes (Fig. 4D). However, contrary to this prediction, there was no significant change to the PT for repetitions of houses (paired t-test, t(47) = 1.16, P = 0.25, FDR corrected), limbs (paired t-test, t(47) = 1.92, P = 0.06, FDR corrected), and cars (paired t-test, t(47) = 0.786, P = 0.436, FDR corrected) in face-selective electrodes (Fig. 5C). This may indicate that temporal changes in the peak timing are only robust for repetitions of stimuli from the preferred category.
Overall, repetitions of images from non-preferred categories produced minimal to no RS. The only significant effects were a small reduction in the total response to limbs, some enhancement in the peak magnitude of houses, and a slightly earlier response onset for cars. The lack of consistent response changes to repetitions of non-preferred stimuli indicates that RS effects in face-selective electrodes are prominent for the preferred stimulus category (faces), but are limited/lacking for non-preferred categories.
Discriminability of Distributed Response to Faces Versus Other Categories Over Time and Repetitions
As we found earlier PT for repeated faces, but not other categories, in face-selective electrodes, we further investigated whether the discriminability of faces from non-face categories varied across repetitions. Thus, we computed face discriminability of distributed responses across the face-selective electrodes. To estimate face discriminability in an unbiased way, we used the nonrepeated images from each category as a training set and the distributed responses from the first (Presentation 1) and second (Presentation 2) of each category as testing sets. We measured the correlation between the distributed pattern of response across face-selective electrodes for nonrepeated images and the distributed patterns of response for Presentation 1 and Presentation 2 of repeated images. Distributed responses were calculated separately for each condition and category in 10-ms time bins using a bootstrapping approach (Methods; Fig. 6A,B, Supplementary Fig. 2). Then, we calculated the differences between the within- and between-category correlations and examined their timing profiles.
Figure 6 .
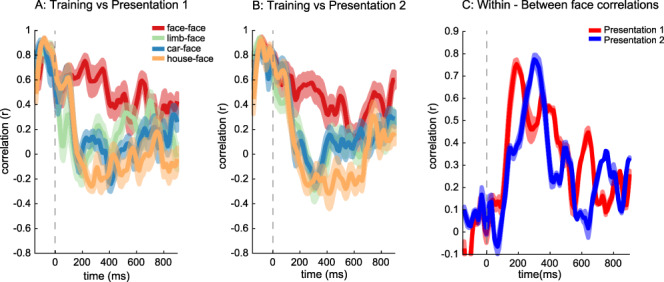
Analysis of distributed responses to the four categories (face, limb, car, house) over time and repetitions. The correlation between the distributed responses of training images (nonrepeated faces) and each of the testing sets across 42 electrodes: (A) first and (B) second face and non-preferred categories. Color indicates the categories that are correlated: red, face-face; orange, houses-face; green, limbs-face; blue, cars-face correlations. (C) Within-face correlation minus between mean face and non-face correlations for first and second presentations are plotted over time; dashed vertical lines: stimulus onset. Error bars: indicate standard error across bootstraps.
We found that for both Presentation 1 (Fig. 6A) and Presentation 2 (Fig. 6B), distributed responses across face-selective electrodes had the highest positive correlation to distributed responses to nonrepeated faces from the training set compared with all other non-preferred categories (houses, cars, and bodies). This difference was most prominent starting at ~ 200 ms after stimulus onset. To evaluate face discriminability, we measured the difference between the within-category correlation (face-face) and the mean of the between-category correlation (average of face-limb, face-car, and face-house) for each of the first and second presentations in each 10-ms time window. A significant positive difference indicates face discriminability as it shows that within-category correlations are higher than between-category correlations.
Examining the temporal progression of discriminability of distributed response to faces (Fig. 6C) shows that face discriminability is low within the first 100 ms after stimulus onset for both Presentation 1 and Presentation 2; face discriminability then steadily increases till about ~200–400 ms after stimulus onset, where at that point face discriminability is positive and high (peak discriminability ~0.7). This data shows that there is face information in distributed responses across face-selective electrodes for both first and second presentations. While the rise in discriminability is similar for the first and second presentations, the peak discriminability is earlier for the first than second presentations (Fig. 6C), despite the fact that the PT was earlier for the latter than the former. The later peak in face discriminability for the second presentation is likely due to later lower between-category correlations to the second presentation compared with the first presentation (Fig. 6A/B). A winner-take-all classifer had ceiling face classification accuracy for both first and second presentations and did not provide sufficient sensitivity to determine differences in classification timing across repetitions. Overall, discriminability of distributed responses to faces started to rise at a similar time for both the first and second presentations, approximately 100 ms after stimulus onset.
RS Magnitude and Timing Effects Persist for Additional Repetitions of Faces
Within our experimental design, each of the repeated images was presented six times, which allowed us to further investigate how additional repetitions of faces affect the HFB response. In the following analyses, we focus on responses to additional repetitions of faces because face-selective electrodes did not show reliable and robust RS effects for non-preferred categories. The average time course for each of the six face repetitions is shown in Supplementary Figure 3. Based on fMRI measurements of VTC responses to stimulus repetitions in which the level of neural responses typically asymptote after about four repetitions (Sayres and Grill-Spector 2006), we predicted that HFB metrics related to response amplitude (AUC and PM) will decrease with additional repetitions of a face, but may asymptote after the fourth repetition. We highlight, however, that neither fMRI data, nor theoretical models of RS, make strong predictions regarding the effect of additional repetitions on temporal features of the response such as the ROL and PT.
We first assessed the significance of our observations using a repeated-measures analysis of variance (ANOVA) on the total HFB response integrated over a 0–900-ms time window after the stimulus onset using presentation number (first through sixth) as a repeated factor. Across all subjects (S1–9), we found a significant main effect of repetition [F(5, 47) = 7.19, P = 2.78 × 10⁻⁶] because presentations 2–6 of a face generated lowered responses relative to its first presentation (see Fig. 7A for AUC). Given this significant main effect of RS, we calculated AUC, PM, ROL, and PT for the third, fourth, fifth, and sixth presentations of faces for each electrode.
Figure 7 .
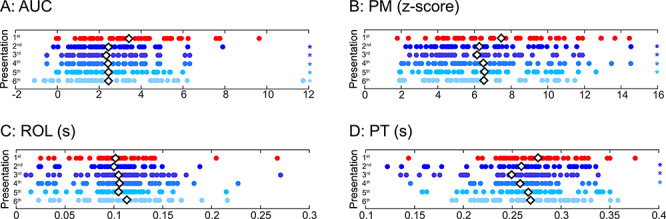
The effects of repetition on the magnitude and timing across multiple repetitions. The mean (A) AUC, (B) PM, (C) ROL, and (D) PT per electrode shown for the first through sixth repetition of faces. Colored asterisk: a significant difference (P < 0.05, t-test) between that presentation number and the first presentation. White diamond: mean value for each presentation number.
The mean AUC for subsequent face presentations was also smaller than the total response to the first presentation of faces (first = 3.4 ± 2.1; second = 2.5 ± 1.6; third = 2.3 ± 1.5; fourth = 2.4 ± 2.0; fifth = 2.4 ± 1.7; sixth = 2.4 ± 2.3). Statistical comparisons of the first presentation versus second through sixth presentations showed a significant reduction in the AUC of HFB responses (Fig. 7A) with the reduction in the total response slightly increasing or remaining equal for presentations 2–6 compared with the first presentation (t-test, FDR corrected, first vs. second, t(47) = 4.16, P = 1.34 × 10⁻⁴; first vs. third, t(47) = 4.87, P = 1.29 × 10⁻⁵; first vs. fourth, t(47) = 4.38, P = 6.95 × 10⁻⁵; first vs. fifth, t(47) = 5.01, P = 8.21 × 10⁻⁶; first vs. sixth, t(47) = 3.85, P = 3.55 × 10⁻⁴). Notably, the third, fourth, and fifth, but not sixth, presentations all showed a larger reduction in AUC than the reduction in AUC from the first to second presentation.
Similarly, the PM of the response for subsequent face presentations was also smaller than the PM to the first presentation of faces (first = 7.5 ± 3.0; second = 6.3 ± 2.7; third = 6.2 ± 2.4; fourth = 6.5 ± 3.0; fifth. = 6.6 ± 2.8; sixth = 6.5 ± 3.8). Statistical comparisons of the first presentation versus second to fifth showed a significant reduction in the PM of HFB responses (Fig. 7B; paired t-test, FDR corrected, first versus second, t(47) = 3.39, P = 0.001; first vs. third, t(47) = 3.67, P = 6.25 × 10⁻⁴; first vs. fourth, t(47) = 3.06, P = 0.004; first vs. fifth, t(47) = 2.98, P = 0.005; first vs. sixth Wilcoxon rank sum test, z = 1.85, P = 0.06). Notably, each of the second, third, fourth, and fifth presentations generated a statistically significant reduction in PM, while the sixth presentation did not generate a significant PM change compared with the first presentation.
We next explored the temporal features of subsequent face repetitions. There was no statistical difference between the ROL for first versus second to sixth presentations (Fig. 7C; paired t-test, FDR corrected, first vs. second, t(47) = 0.28, P = 0.78; first vs. third, t(47) = 0.27, P = 0.78; first vs. fourth, t(47) = 0.41, P = 0.69; first vs fifth, t(47) = 0.3, P = 0.76; first vs. sixth Wilcoxon rank sum test, z = −1.27, P = 0.20). However, the mean PT for subsequent face presentations was generally earlier than the PT to the first presentation of faces (first = 275.9 ± 39; second = 259.1 ± 52; third = 249.0 ± 47; fourth = 257.9 ± 33; fifth = 265.9 ± 44; sixth = 267.9 ± 42 ms). Statistical comparisons of the first presentation versus the second to sixth presentations revealed an earlier PT of the HFB responses (Fig. 7D) for the second, third, and fourth presentations (paired t-test, FDR corrected, first vs. second, t(47) = 2.88, P = 0.006; first vs. third, t(47) = 4.43, P = 5.63 × 10⁻⁵; first vs. fourth, t(47) = 3.38, P = 0.001; first vs. fifth, t(47), P = 0.10; first vs. sixth, t(47) = 1.23, P = 0.22). Notably, the second, third, and fourth, presentations had a significantly earlier PT than the first face presentation, with the maximum change for the third presentation.
Taken together, analyses of the dynamics of RS show that HFB responses across face repetitions are (i) overall lower, (ii) have a smaller peak magnitude and (iii) have an earlier peak timing across multiple repetitions. These effects are summarized in Supplementary Table 2. Our data suggest that RS effects depend on the number of repetitions and persist for the third and fourth face repetitions. This indicates that repetition number and timing may be critical to the strength and nature of RS effects for long-lagged repetitions of faces in human VTC.
Discussion
Using intracranial recordings, we characterized the effect of stimulus repetition on face-selective neural responses in human VTC for long-lagged stimulus repetitions (an average of 20.1–31.7 s between repetitions) of faces and non-preferred categories. We found that RS occurs for high-frequency broadband (HFB) activity, but not lower-frequency bands. Furthermore, we found that repetition reduces the total neural response (AUC) and peak magnitude (PM) in which more robust reductions occur in the former compared with the latter. RS effects occur early (within ~ 150 ms after stimulus onset) and persist for the entire stimulus duration. Interestingly, HFB responses had different temporal characteristics for subsequent than initial face presentations: neural responses were faster to peak for the second versus first presentation, even though there were no significant differences in response onset timing. This response characteristic did not occur for other non-preferred categories, but consistently occurred for additional face repetitions with additional intervening stimuli. In the sections below, we discuss RS effects across frequency bands and related to theoretical models of RS.
Repetition Suppression in HFB, But Not Lower-Frequency Bands
Our data reveal RS in HFB (>70 Hz), but not lower-frequency bands (<30 Hz). These findings are consistent with ECoG data from Engell and McCarthy (2014) who showed that for immediate repetitions of faces (eight repetitions of the same face, 2 s ISI, and no intervening stimuli), there were decreases in responses in the low (30–60 Hz) and high gamma range (60–100 Hz) with no significant changes in the α (8–12 Hz) or β (15-30 Hz) range. As lower-frequency activity is associated with visual evoked potentials (VEPs) (Allison et al. 1999; Rossion 2014), and VEP and HFB responses are often dissociated in face-selective regions (Engell and McCarthy 2011; Rangarajan et al. 2014), our observations are in line with prior studies that measured VEPs and failed to find RS to faces in ECoG data from VTC (Puce et al. 1999). Specifically, the lack of RS in lower frequency bands in the present study and the coupling between VEP and low-frequency activities are consistent with the lack of RS in intracranial VEP reported in prior studies. It is possible that additional effects of repetition may be present in the scalp VEP (Schweinberger et al. 1995; Doniger et al. 2001; Schweinberger et al. 2002; Kuehl et al. 2013) or in synchronous or phase-locked features of low-frequency responses (Gilbert et al. 2010; Engell and McCarthy 2014), but we have not observed such effects in the current study. Nonetheless, we find robust RS to faces early in the HFB response and in the majority of face-selective electrodes indicating that future studies of stimulus repetition using intracranial measurements should quantify HFB responses.
Our finding of RS in HFB activity is also consistent with prior studies showing RS in gamma and high-gamma bands of local field potentials (LFP) for repetitions of faces (Engell and McCarthy 2014), letters (Rodriguez Merzagora et al. 2014), and objects (McMahon and Olson 2007; De Baene and Vogels 2010; Friese et al. 2012; Engell and McCarthy 2014) in both human VTC and macaque inferior temporal cortex. Additionally, we found that significant RS occurs within 350 ms of stimulus onset and persists for the remainder of the image duration. As HFB activity is correlated with local neuronal firing (Logothetis et al. 2001; Nir et al. 2007; Miller et al. 2010), our results suggest that RS in HFB is due to reduced neuronal firing rate to repeated stimuli, which is consistent with findings of RS in single neurons of macaque inferior temporal cortex (Miller et al. 1991; Li et al. 1993; McMahon and Olson 2007; De Baene and Vogels 2010).
Implications of Our Findings for Theoretical Models of Repetition Suppression
Several theories have been proposed to account for RS in high-level visual cortex such as scaling, sharpening, facilitation, synchrony, prediction error, and combinations therein (Grill-Spector et al. 2006; Summerfield et al. 2008; De Baene and Vogels 2010; Weiner et al. 2010; Gotts et al. 2012; Henson 2016; Vogels 2016; Alink et al. 2018). To date, most empirical data testing these theories have largely examined the effect of repetition on the magnitude of responses, as the prevalent scaling and sharpening models make specific predictions about the amplitude, rather than timing of RS.
Both scaling and facilitation models of RS predict the largest reduction in amplitude for repetitions of the preferred stimulus, while sharpening predicts the smallest reduction in amplitude to repetitions of the preferred stimulus. Consistent with scaling and facilitation models, we find lower PM and AUC for the second versus the first presentation of a face. Notably, we also find the largest RS for the preferred stimulus (faces) as compared with non-preferred stimulus categories, consistent with prior fMRI studies (Weiner et al. 2010). As repetitions of the same stimulus occurred with long lags and many intervening stimuli, these RS effects are impressive and argue against the hypothesis that reduced responses to repeating stimuli stem from low-level, image-based adaptation effects.
The facilitation model is the only model of RS that makes predictions about the temporal characteristics of repetition effects. At its simplest, facilitation predicts that repetition causes faster processing of stimuli, that is, shorter latencies or shorter durations of neural firing (Grill-Spector et al. 2006). However, researchers vary in their predictions of the temporal dynamics associated with facilitation models. Predictions range from 1) a faster response onset latency (ROL) (James and Gauthier 2006), 2) no change in the ROL (Henson 2012, 2016), 3) an earlier peak time (James and Gauthier 2006), or 4) a shorter response duration (Henson and Rugg 2003; Henson 2016) for the repeated vs. first presentation of an image. Intriguingly, our results provide the first empirical support for the timing predictions of the accumulation model of James and Gauthier (2006), which is an extension of the facilitation model. We find that during long-lagged stimulus repetitions the second, third, and fourth repetitions of faces produced neural responses that were faster to peak than the first presentation. Another interesting observation is that in face-selective electrodes, temporal changes in the HFB responses to repeated stimuli were unique to faces. This suggests that in a stimulus-selective cortical region, temporal facilitation in peak timing may occur for the preferred stimulus, but not to non-preferred stimuli. As recent experiments have shown that modeling the temporal responses of neurons in millisecond resolution better predicts BOLD responses (with a resolution of seconds) than the general linear model (Stigliani et al. 2017; Zhou et al. 2018; Stigliani et al. 2019; Zhou et al. 2019), future research can measure both ECoG and fMRI responses in an event-related design for long-lagged repetitions to directly relate the impact of the repetition on the combined changes to PT, PM, and AUC, measured with ECoG, on BOLD responses.
Other theories have suggested that RS is linked to predictability of the stimulus (Summerfield et al. 2008). We believe that predictability is an unlikely explanation underlying the different temporal features of neural responses during repeated compared with nonrepeated conditions in the present study for five reasons. First, our long-lagged experimental design controlled for stimulus predictability: there was an equal occurrence of repeated and nonrepeated images throughout the experiment, and participants were unaware when repetitions were going to occur. Second, subjects participated in an orthogonal fixation task, which did not require judgment of faces or top-down attention to faces. Third, while RS is a reliable effect across studies, stimuli, and measurements (Grill-Spector et al. 2006; Summerfield et al. 2008; De Baene and Vogels 2010; Weiner et al. 2010; Gotts et al. 2012; Henson 2016; Vogels 2016; Alink et al. 2018), the effects of stimulus predictability on the magnitude of RS are inconsistent across studies, stimuli, and measurements (Sawamura et al. 2006; Kaliukhovich and Vogels 2011; Kovacs et al. 2013; Tang et al. 2018; Vinken et al. 2018). Fourth, RS to repetitions of non-preferred stimuli did not always occur within face-selective electrodes even though the repetition predictability of non-preferred stimuli was equally as likely as face repetitions. Fifth, to our knowledge, the prediction error account does not make explicit predictions regarding the temporal dynamics of responses, such as the faster time to peak for repetitions of preferred stimuli that eventually plateaus after the fourth repetition. Thus, while the prediction error account for RS is an appealing hypothesis, it does not explain RS during long-lagged paradigms with intervening stimuli.
Theoretical and Methodological Implications for Future Work
A theoretical implication resulting from comparing our findings to the previous work is that different experimental paradigms may affect different aspects of the temporal dynamics of neural responses in VTC. For example, while we found no effect of repetition for ROL, previous intracranial studies recording from VTC in humans (Engell and McCarthy 2014; Rodriguez Merzagora et al. 2014) and nonhuman primates (McMahon and Olson 2007; Anderson et al. 2008; De Baene and Vogels 2010; Engell and McCarthy 2014) have shown delayed ROL. As such, future modeling work should take into consideration how the characteristics of stimulus repetition may affect the temporal properties of the response such as ROL and PT. For instance, the previous work has reported delayed ROL in VTC for immediate stimulus repetitions with no intervening stimuli and less than 2 s between repetitions implemented in short-lagged paradigms (Anderson et al. 2008; De Baene and Vogels 2010; Engell and McCarthy 2014; Rodriguez Merzagora et al. 2014). This suggests that immediate repetitions and long-lagged repetitions with intervening stimuli (as in the present study) may have different temporal characteristics. For example, using letters during a Sternberg working memory task and ECoG in human occipital and temporal cortex, Rodriguez Merzagora et al. (2014) and colleagues reported RS only for HFB, but unlike the present study, found that the ROL for repeated stimuli was actually slower than for nonrepeated stimuli. The combination of the present and past findings further suggest the possibility that different neural mechanisms may lead to the differential temporal effects across repetitions given varied stimulus timing parameters. Future studies can test this hypothesis by systematically varying the interval between repetitions of the same stimuli, measuring how timing properties affect the temporal characteristics of the neural response, and further applying computational encoding models to understand the temporal features of stimulus repetitions (Stigliani et al. 2019). Additionally, as RS effects vary across brain regions (Verhoef et al. 2008; Weiner et al. 2010), future studies are needed to 1) determine if the facilitation of the PT observed here is prevalent across other regions or is specific to human VTC, 2) explore the dynamics of repetition effects using other visual categories and for nonvisual domains, and 3) examine how the number of intervening stimuli and interstimulus interval may affect RS. Such work could also explore whether information can be classified more quickly for repeated versus novel presentations of stimuli across visual cortex intracranially (Weiner et al. 2010).
Open Questions for Future Research
Our data provide the first insights of the effect of long-lagged repetitions on HFB responses in VTC. However, a few questions are unanswered by the present study and can be addressed in future studies.
First, why wasn’t RS to long-lagged stimulus repetitions observed in all electrodes? Our data revealed that three electrodes showed a weak enhanced response to the second versus first presentation. We note that the timing of enhancement in these electrodes is very different than those showing RS: the first time point showing significant repetition enhancement appeared later in the trial (on average ~ 375 ms) as compared with significant repetition suppression (on average ~ 150 ms) after stimulus onset. These varied temporal profiles of repetition suppression versus repetition enhancement may suggest that different mechanisms underlie these phenomena. For example, bottom-up signals may drive repetition suppression, whereas top-down feedback signals may drive repetition enhancement (Cheal et al. 1991; Pinto et al. 2013). These hypotheses can be examined in the future work.
Second, why was the shift in peak timing for face repetitions not observed in all electrodes? This may be in part due to the varied anatomical location of our face-selective electrodes or the initial strength of the face responses in these electrodes. Future studies with more face-selective electrodes are necessary to investigate channels that show a varied temporal profile. This would also help address intersubject variability inherent to intracranial research (Aarts et al. 2014). A larger pool of subjects, with more face-selective electrodes, would allow us to further address how individual differences may influence RS effects.
Third, how does the neural response magnitude to preferred stimuli affect RS? Previous electrophysiology studies in macaque IT (Sawamura et al. (2006) have explored the relationship between response strength and repetition. Here, we show that the effects of repetition are larger for the preferred category (faces) than non-preferred categories (cars, houses, limbs) consistent with fMRI data and with the scaling model of RS (Weiner et al. 2010). One appealing approach to address this question in the future research may be to use presentation methods that modulate responses to faces such as lowering their contrast or embedding them in noise to examine the effect of level of response on the timing of neural responses to repeated stimuli.
Conclusion
In sum, neural RS is pervasive across high-level visual regions in cortical sensory systems. Understanding and characterizing RS dynamics—across temporal and neuroanatomical spatial scales—serves as a window to understand how cortical responses depend on the history of a stimulus, which has direct implications for modeling neural systems subserving learning, memory, and perception. Here, we leveraged the precise spatial localization and high temporal resolution of ECoG from nine human subjects implanted with intracranial electrodes in VTC to measure the effects of stimulus repetition after tens of seconds. Our approach revealed that RS 1) occurs in VTC activity in HFB range, but not lower-frequency bands; 2) RS is associated with lower peak magnitude, lower total responses of the HFB signal, and earlier peak responses; and 3) RS effects occur early (~150 ms) and persist for the entire stimulus duration. Furthermore, these temporal dynamics of RS were largely specific to the preferred stimulus (faces) within face-selective electrodes in VTC and persisted across additional repetitions until about the fourth repetition. Together, these data motivate future empirical and theoretical work examining the effects of stimulus repetition on neural responses not only within VTC but also throughout the brain and in other sensory and nonsensory domains.
Notes
All intracranial data were acquired at Stanford Medical Center through the collaboration with Professor Josef Parvizi, MD PhD at the Laboratory of Behavioral and Cognitive Neuroscience (LBCN). We thank the patients for participating in our research; We thank Dr Brett L. Foster, Dr Jesse Gomez, and Sandra Gattas for their help with data collection; and Dr Nathan Witthoft for coding the experiment.
Conflict of Interest
None declared.
Funding
National Science Foundation Graduate Research Fellowship (DGE 1106400 to V.R.); National Institute of Neurological Disorders and Strokes at the National Institutes of Health (grant number R37NS21135) and the James S. McDonnell Foundation grant to R.T.K.; UC Berkeley start-up funds to K.S.W. National Eye Institute at the National Institutes of Health (grant number 2R01EY023915) to K.G.S.
Author Contributions
C.J., K.S.W., and K.G.S. designed the experiment; V.R., C.J., and K.S.W. collected the data; V.R., R.T.K., K.S.W., and K.G.S. contributed to data analysis; V.R., K.S.W., and K.G.S. wrote the manuscript; all authors approved the manuscript.
Supplementary Material
References
- Aarts E, Verhage M, Veenvliet JV, Dolan CV, van der Sluis S. 2014. A solution to dependency: using multilevel analysis to accommodate nested data. Nat Neurosci. 17:491–496. [DOI] [PubMed] [Google Scholar]
- Alink A, Abdulrahman H, Henson RN. 2018. Forward models demonstrate that repetition suppression is best modelled by local neural scaling. Nat Commun. 9:3854. [DOI] [PMC free article] [PubMed] [Google Scholar]
- Allison T, Puce A, Spencer DD, McCarthy G. 1999. Electrophysiological studies of human face perception. I: potentials generated in occipitotemporal cortex by face and non-face stimuli. Cereb Cortex. 9:415–430. [DOI] [PubMed] [Google Scholar]
- Anderson B, Mruczek RE, Kawasaki K, Sheinberg D. 2008. Effects of familiarity on neural activity in monkey inferior temporal lobe. Cereb Cortex. 18:2540–2552. [DOI] [PMC free article] [PubMed] [Google Scholar]
- Benjamini Y, Drai D, Elmer G, Kafkafi N, Golani I. 2001. Controlling the false discovery rate in behavior genetics research. Behav Brain Res. 125:279–284. [DOI] [PubMed] [Google Scholar]
- Bryne BM. 2001. Structural equation modeling with AMOS: basic concepts, applications, and programming. Mahwah, NJ: Lawrence Erlbaum Associates. [Google Scholar]
- Buckner RL, Petersen SE, Ojemann JG, Miezin FM, Squire LR, Raichle ME. 1995. Functional anatomical studies of explicit and implicit memory retrieval tasks. J Neurosci. 15:12–29. [DOI] [PMC free article] [PubMed] [Google Scholar]
- Chao LL, Haxby JV, Martin A. 1999. Attribute-based neural substrates in temporal cortex for perceiving and knowing about objects. Nat Neurosci. 2:913–919. [DOI] [PubMed] [Google Scholar]
- Cheal M, Lyon DR, Hubbard DC. 1991. Does attention have different effects on line orientation and line arrangement discrimination? Q J Exp Psychol A. 43:825–857. [DOI] [PubMed] [Google Scholar]
- Cole SR, Voytek B. 2017. Brain oscillations and the importance of waveform shape. Trends Cogn Sci. 21:137–149. [DOI] [PubMed] [Google Scholar]
- Davidesco I, Zion-Golumbic E, Bickel S, Harel M, Groppe DM, Keller CJ, Schevon CA, McKhann GM, Goodman RR, Goelman G et al. 2013. Exemplar selectivity reflects perceptual similarities in the human fusiform cortex. Cereb Cortex 24:1879–1893. [DOI] [PMC free article] [PubMed] [Google Scholar]
- De Baene W, Vogels R. 2010. Effects of adaptation on the stimulus selectivity of macaque inferior temporal spiking activity and local field potentials. Cereb Cortex. 20:2145–2165. [DOI] [PubMed] [Google Scholar]
- Doniger GM, Foxe JJ, Schroeder CE, Murray MM, Higgins BA, Javitt DC. 2001. Visual perceptual learning in human object recognition areas: a repetition priming study using high-density electrical mapping. Neuroimage. 13:305–313. [DOI] [PubMed] [Google Scholar]
- Engell AD, McCarthy G. 2011. The relationship of gamma oscillations and face-specific ERPs recorded subdurally from occipitotemporal cortex. Cereb Cortex. 21:1213–1221. [DOI] [PMC free article] [PubMed] [Google Scholar]
- Engell AD, McCarthy G. 2014. Repetition suppression of face-selective evoked and induced EEG recorded from human cortex. Hum Brain Mapp. 35:4155–4162. [DOI] [PMC free article] [PubMed] [Google Scholar]
- Fabbrini F, Van den Haute C, De Vitis M, Baekelandt V, Vanduffel W, Vogels R. 2019. Probing the mechanisms of repetition suppression in inferior temporal cortex with optogenetics. Curr Biol. 29:1988–1998 e1984. [DOI] [PubMed] [Google Scholar]
- Flinker A, Chang EF, Kirsch HE, Barbaro NM, Crone NE, Knight RT. 2010. Single-trial speech suppression of auditory cortex activity in humans. J Neurosci. 30:16643–16650. [DOI] [PMC free article] [PubMed] [Google Scholar]
- Friese U, Supp GG, Hipp JF, Engel AK, Gruber T. 2012. Oscillatory MEG gamma band activity dissociates perceptual and conceptual aspects of visual object processing: a combined repetition/conceptual priming study. Neuroimage. 59:861–871. [DOI] [PubMed] [Google Scholar]
- Gilbert JR, Gotts SJ, Carver FW, Martin A. 2010. Object repetition leads to local increases in the temporal coordination of neural responses. Front Hum Neurosci. 4:30. [DOI] [PMC free article] [PubMed] [Google Scholar]
- Gotts SJ, Chow CC, Martin A. 2012. Repetition priming and repetition suppression: a case for enhanced efficiency through neural synchronization. Cogn Neurosci. 3:227–237. [DOI] [PMC free article] [PubMed] [Google Scholar]
- Grill-Spector K, Henson R, Martin A. 2006. Repetition and the brain: neural models of stimulus-specific effects. Trends Cogn Sci. 10:14–23. [DOI] [PubMed] [Google Scholar]
- Grill-Spector K, Kushnir T, Edelman S, Avidan G, Itzchak Y, Malach R. 1999. Differential processing of objects under various viewing conditions in the human lateral occipital complex. Neuron. 24:187–203. [DOI] [PubMed] [Google Scholar]
- Grill-Spector K, Malach R. 2001. fMR-adaptation: a tool for studying the functional properties of human cortical neurons. Acta Psychol (Amst). 107:293–321. [DOI] [PubMed] [Google Scholar]
- Gross CG, Bender DB, Gerstein GL. 1979. Activity of inferior temporal neurons in behaving monkeys. Neuropsychologia. 17:215–229. [DOI] [PubMed] [Google Scholar]
- Gross CG, Bender DB, Rocha-Miranda CE. 1969. Visual receptive fields of neurons in inferotemporal cortex of the monkey. Science. 166:1303–1306. [DOI] [PubMed] [Google Scholar]
- Groves PM, Thompson RF. 1970. Habituation: a dual-process theory. Psychol Rev. 77:419–450. [DOI] [PubMed] [Google Scholar]
- Hair JF. 2009. Multivariate data analysis: a global perspective. Upper Saddle River: Prentice Hall. [Google Scholar]
- Henson R, Shallice T, Dolan R. 2000. Neuroimaging evidence for dissociable forms of repetition priming. Science. 287:1269–1272. [DOI] [PubMed] [Google Scholar]
- Henson RN. 2012. Repetition accelerates neural dynamics: in defense of facilitation models. Cogn Neurosci. 3:240–241. [DOI] [PubMed] [Google Scholar]
- Henson RN. 2016. Repetition suppression to faces in the fusiform face area: a personal and dynamic journey. Cortex. 80:174–184. [DOI] [PubMed] [Google Scholar]
- Henson RN, Rugg MD. 2003. Neural response suppression, haemodynamic repetition effects, and behavioural priming. Neuropsychologia. 41:263–270. [DOI] [PubMed] [Google Scholar]
- Hermes D, Miller KJ, Noordmans HJ, Vansteensel MJ, Ramsey NF. 2010. Automated electrocorticographic electrode localization on individually rendered brain surfaces. J Neurosci Methods. 185:293–298. [DOI] [PubMed] [Google Scholar]
- Hermes D, Miller KJ, Vansteensel MJ, Aarnoutse EJ, Leijten FS, Ramsey NF. 2012. Neurophysiologic correlates of fMRI in human motor cortex. Hum Brain Mapp. 33:1689–1699. [DOI] [PMC free article] [PubMed] [Google Scholar]
- Jacques C, d'Arripe O, Rossion B. 2007. The time course of the inversion effect during individual face discrimination. J Vis. 7:3. [DOI] [PubMed] [Google Scholar]
- Jacques C, Witthoft N, Weiner KS, Foster BL, Rangarajan V, Hermes D, Miller KJ, Parvizi J, Grill-Spector K. 2016. Corresponding ECoG and fMRI category-selective signals in human ventral temporal cortex. Neuropsychologia. 83:14–28. [DOI] [PMC free article] [PubMed] [Google Scholar]
- James TW, Gauthier I. 2006. Repetition-induced changes in BOLD response reflect accumulation of neural activity. Hum Brain Mapp. 27:37–46. [DOI] [PMC free article] [PubMed] [Google Scholar]
- Jonas J, Jacques C, Liu-Shuang J, Brissart H, Colnat-Coulbois S, Maillard L, Rossion B. 2016. A face-selective ventral occipito-temporal map of the human brain with intracerebral potentials. Proc Natl Acad Sci U S A. 113:E4088–E4097. [DOI] [PMC free article] [PubMed] [Google Scholar]
- Kaliukhovich DA, Vogels R. 2011. Stimulus repetition probability does not affect repetition suppression in macaque inferior temporal cortex. Cereb Cortex. 21:1547–1558. [DOI] [PubMed] [Google Scholar]
- Kane N, Acharya J, Benickzy S, Caboclo L, Finnigan S, Kaplan PW, Shibasaki H, Pressler R, van Putten M. 2017. A revised glossary of terms most commonly used by clinical electroencephalographers and updated proposal for the report format of the EEG findings. Revision 2017. Clin Neurophysiol Pract. 2:170–185. [DOI] [PMC free article] [PubMed] [Google Scholar]
- Kanwisher N, McDermott J, Chun MM. 1997. The fusiform face area: a module in human extrastriate cortex specialized for face perception. J Neurosci. 17:4302–4311. [DOI] [PMC free article] [PubMed] [Google Scholar]
- Kovacs G, Kaiser D, Kaliukhovich DA, Vidnyanszky Z, Vogels R. 2013. Repetition probability does not affect fMRI repetition suppression for objects. J Neurosci. 33:9805–9812. [DOI] [PMC free article] [PubMed] [Google Scholar]
- Kuehl LK, Brandt ES, Hahn E, Dettling M, Neuhaus AH. 2013. Exploring the time course of N170 repetition suppression: a preliminary study. Int J Psychophysiol. 87:183–188. [DOI] [PubMed] [Google Scholar]
- Kuravi P, Vogels R. 2017. Effect of adapter duration on repetition suppression in inferior temporal cortex. Sci Rep. 7:3162. [DOI] [PMC free article] [PubMed] [Google Scholar]
- Li L, Miller EK, Desimone R. 1993. The representation of stimulus familiarity in anterior inferior temporal cortex. J Neurophysiol. 69:1918–1929. [DOI] [PubMed] [Google Scholar]
- Logothetis NK, Pauls J, Augath M, Trinath T, Oeltermann A. 2001. Neurophysiological investigation of the basis of the fMRI signal. Nature. 412:150–157. [DOI] [PubMed] [Google Scholar]
- Lueschow A, Miller EK, Desimone R. 1994. Inferior temporal mechanisms for invariant object recognition. Cereb Cortex. 4:523–531. [DOI] [PubMed] [Google Scholar]
- Manning JR, Jacobs J, Fried I, Kahana MJ. 2009. Broadband shifts in local field potential power spectra are correlated with single-neuron spiking in humans. J Neurosci. 29:13613–13620. [DOI] [PMC free article] [PubMed] [Google Scholar]
- McCarthy G, Puce A, Belger A, Allison T. 1999. Electrophysiological studies of human face perception. II: response properties of face-specific potentials generated in occipitotemporal cortex. Cereb Cortex. 9:431–444. [DOI] [PubMed] [Google Scholar]
- McDonald CR, Thesen T, Carlson C, Blumberg M, Girard HM, Trongnetrpunya A, Sherfey JS, Devinsky O, Kuzniecky R, Dolye WK et al. 2010. Multimodal imaging of repetition priming: using fMRI, MEG, and intracranial EEG to reveal spatiotemporal profiles of word processing. Neuroimage. 53:707–717. [DOI] [PMC free article] [PubMed] [Google Scholar]
- McMahon DB, Olson CR. 2007. Repetition suppression in monkey inferotemporal cortex: relation to behavioral priming. J Neurophysiol. 97:3532–3543. [DOI] [PubMed] [Google Scholar]
- Miller EK, Gochin PM, Gross CG. 1991. Habituation-like decrease in the responses of neurons in inferior temporal cortex of the macaque. Vis Neurosci. 7:357–362. [DOI] [PubMed] [Google Scholar]
- Miller KJ, Hermes D, Honey CJ, Sharma M, Rao RP, den Nijs M, Fetz EE, Sejnowski TJ, Hebb AO, Ojemann JG et al. 2010. Dynamic modulation of local population activity by rhythm phase in human occipital cortex during a visual search task. Front Hum Neurosci. 4:197. [DOI] [PMC free article] [PubMed] [Google Scholar]
- Miller KJ, Hermes D, Witthoft N, Rao RP, Ojemann JG. 2015. The physiology of perception in human temporal lobe is specialized for contextual novelty. J Neurophysiol. 114:256–263. [DOI] [PMC free article] [PubMed] [Google Scholar]
- Miller KJ, Honey CJ, Hermes D, Rao RP, den Nijs M, Ojemann JG. 2014. Broadband changes in the cortical surface potential track activation of functionally diverse neuronal populations. Neuroimage. 85(Pt 2):711–720. [DOI] [PMC free article] [PubMed] [Google Scholar]
- Nir Y, Fisch L, Mukamel R, Gelbard-Sagiv H, Arieli A, Fried I, Malach R. 2007. Coupling between neuronal firing rate, gamma LFP, and BOLD fMRI is related to interneuronal correlations. Curr Biol. 17:1275–1285. [DOI] [PubMed] [Google Scholar]
- Parvizi J, Jacques C, Foster BL, Witthoft N, Rangarajan V, Weiner KS, Grill-Spector K. 2012. Electrical stimulation of human fusiform face-selective regions distorts face perception. J Neurosci. 32:14915–14920. [DOI] [PMC free article] [PubMed] [Google Scholar]
- Pinto Y, van der Leij AR, Sligte IG, Lamme VA, Scholte HS. 2013. Bottom-up and top-down attention are independent. J Vis. 13:16. [DOI] [PubMed] [Google Scholar]
- Puce A, Allison T, McCarthy G. 1999. Electrophysiological studies of human face perception. III: effects of top-down processing on face-specific potentials. Cereb Cortex. 9:445–458. [DOI] [PubMed] [Google Scholar]
- Rangarajan V, Hermes D, Foster BL, Weiner KS, Jacques C, Grill-Spector K, Parvizi J. 2014. Electrical stimulation of the left and right human fusiform gyrus causes different effects in conscious face perception. J Neurosci. 34:12828–12836. [DOI] [PMC free article] [PubMed] [Google Scholar]
- Ray S, Maunsell JH. 2011. Different origins of gamma rhythm and high-gamma activity in macaque visual cortex. PLoS Biol. 9:e1000610. [DOI] [PMC free article] [PubMed] [Google Scholar]
- Rodriguez Merzagora A, Coffey TJ, Sperling MR, Sharan A, Litt B, Baltuch G, Jacobs J. 2014. Repeated stimuli elicit diminished high-gamma electrocorticographic responses. Neuroimage. 85(Pt 2):844–852. [DOI] [PMC free article] [PubMed] [Google Scholar]
- Rossion B. 2014. Understanding face perception by means of human electrophysiology. Trends Cogn Sci. 18:310–318. [DOI] [PubMed] [Google Scholar]
- Sawamura H, Orban GA, Vogels R. 2006. Selectivity of neuronal adaptation does not match response selectivity: a single-cell study of the FMRI adaptation paradigm. Neuron. 49:307–318. [DOI] [PubMed] [Google Scholar]
- Sayres R, Grill-Spector K. 2006. Object-selective cortex exhibits performance-independent repetition suppression. J Neurophysiol. 95:995–1007. [DOI] [PubMed] [Google Scholar]
- Schweinberger SR, Klos T, Sommer W. 1995. Covert face recognition in prosopagnosia: a dissociable function? Cortex. 31:517–529. [DOI] [PubMed] [Google Scholar]
- Schweinberger SR, Pickering EC, Jentzsch I, Burton AM, Kaufmann JM. 2002. Event-related brain potential evidence for a response of inferior temporal cortex to familiar face repetitions. Brain Res Cogn Brain Res. 14:398–409. [DOI] [PubMed] [Google Scholar]
- Stigliani A, Jeska B, Grill-Spector K. 2017. Encoding model of temporal processing in human visual cortex. Proc Natl Acad Sci U S A. 114:E11047–E11056. [DOI] [PMC free article] [PubMed] [Google Scholar]
- Stigliani A, Jeska B, Grill-Spector K. 2019. Differential sustained and transient temporal processing across visual streams. PLoS Comput Biol. 15:e1007011. [DOI] [PMC free article] [PubMed] [Google Scholar]
- Summerfield C, Trittschuh EH, Monti JM, Mesulam MM, Egner T. 2008. Neural repetition suppression reflects fulfilled perceptual expectations. Nat Neurosci. 11:1004–1006. [DOI] [PMC free article] [PubMed] [Google Scholar]
- Tang MF, Smout CA, Arabzadeh E, Mattingley JB. 2018. Prediction error and repetition suppression have distinct effects on neural representations of visual information. Elife. 7:e33123. [DOI] [PMC free article] [PubMed] [Google Scholar]
- Thorpe W. 1956. Learning and instinct in animals. Cambridge, MA: Harvard University Press. [Google Scholar]
- Verhoef BE, Kayaert G, Franko E, Vangeneugden J, Vogels R. 2008. Stimulus similarity-contingent neural adaptation can be time and cortical area dependent. J Neurosci. 28:10631–10640. [DOI] [PMC free article] [PubMed] [Google Scholar]
- Vinken K, Op de Beeck HP, Vogels R. 2018. Face repetition probability does not affect repetition suppression in macaque Inferotemporal cortex. J Neurosci. 38:7492–7504. [DOI] [PMC free article] [PubMed] [Google Scholar]
- Vogels R. 2016. Sources of adaptation of inferior temporal cortical responses. Cortex. 80:185–195. [DOI] [PubMed] [Google Scholar]
- Weiner KS, Sayres R, Vinberg J, Grill-Spector K. 2010. fMRI-adaptation and category selectivity in human ventral temporal cortex: regional differences across time scales. J Neurophysiol. 103:3349–3365. [DOI] [PMC free article] [PubMed] [Google Scholar]
- Zhou J, Benson NC, Kay K, Winawer J. 2019. Predicting neuronal dynamics with a delayed gain control model. PLoS Comput Biol. 15:e1007484. [DOI] [PMC free article] [PubMed] [Google Scholar]
- Zhou J, Benson NC, Kay KN, Winawer J. 2018. Compressive temporal summation in human visual cortex. J Neurosci. 38:691–709. [DOI] [PMC free article] [PubMed] [Google Scholar]
Associated Data
This section collects any data citations, data availability statements, or supplementary materials included in this article.