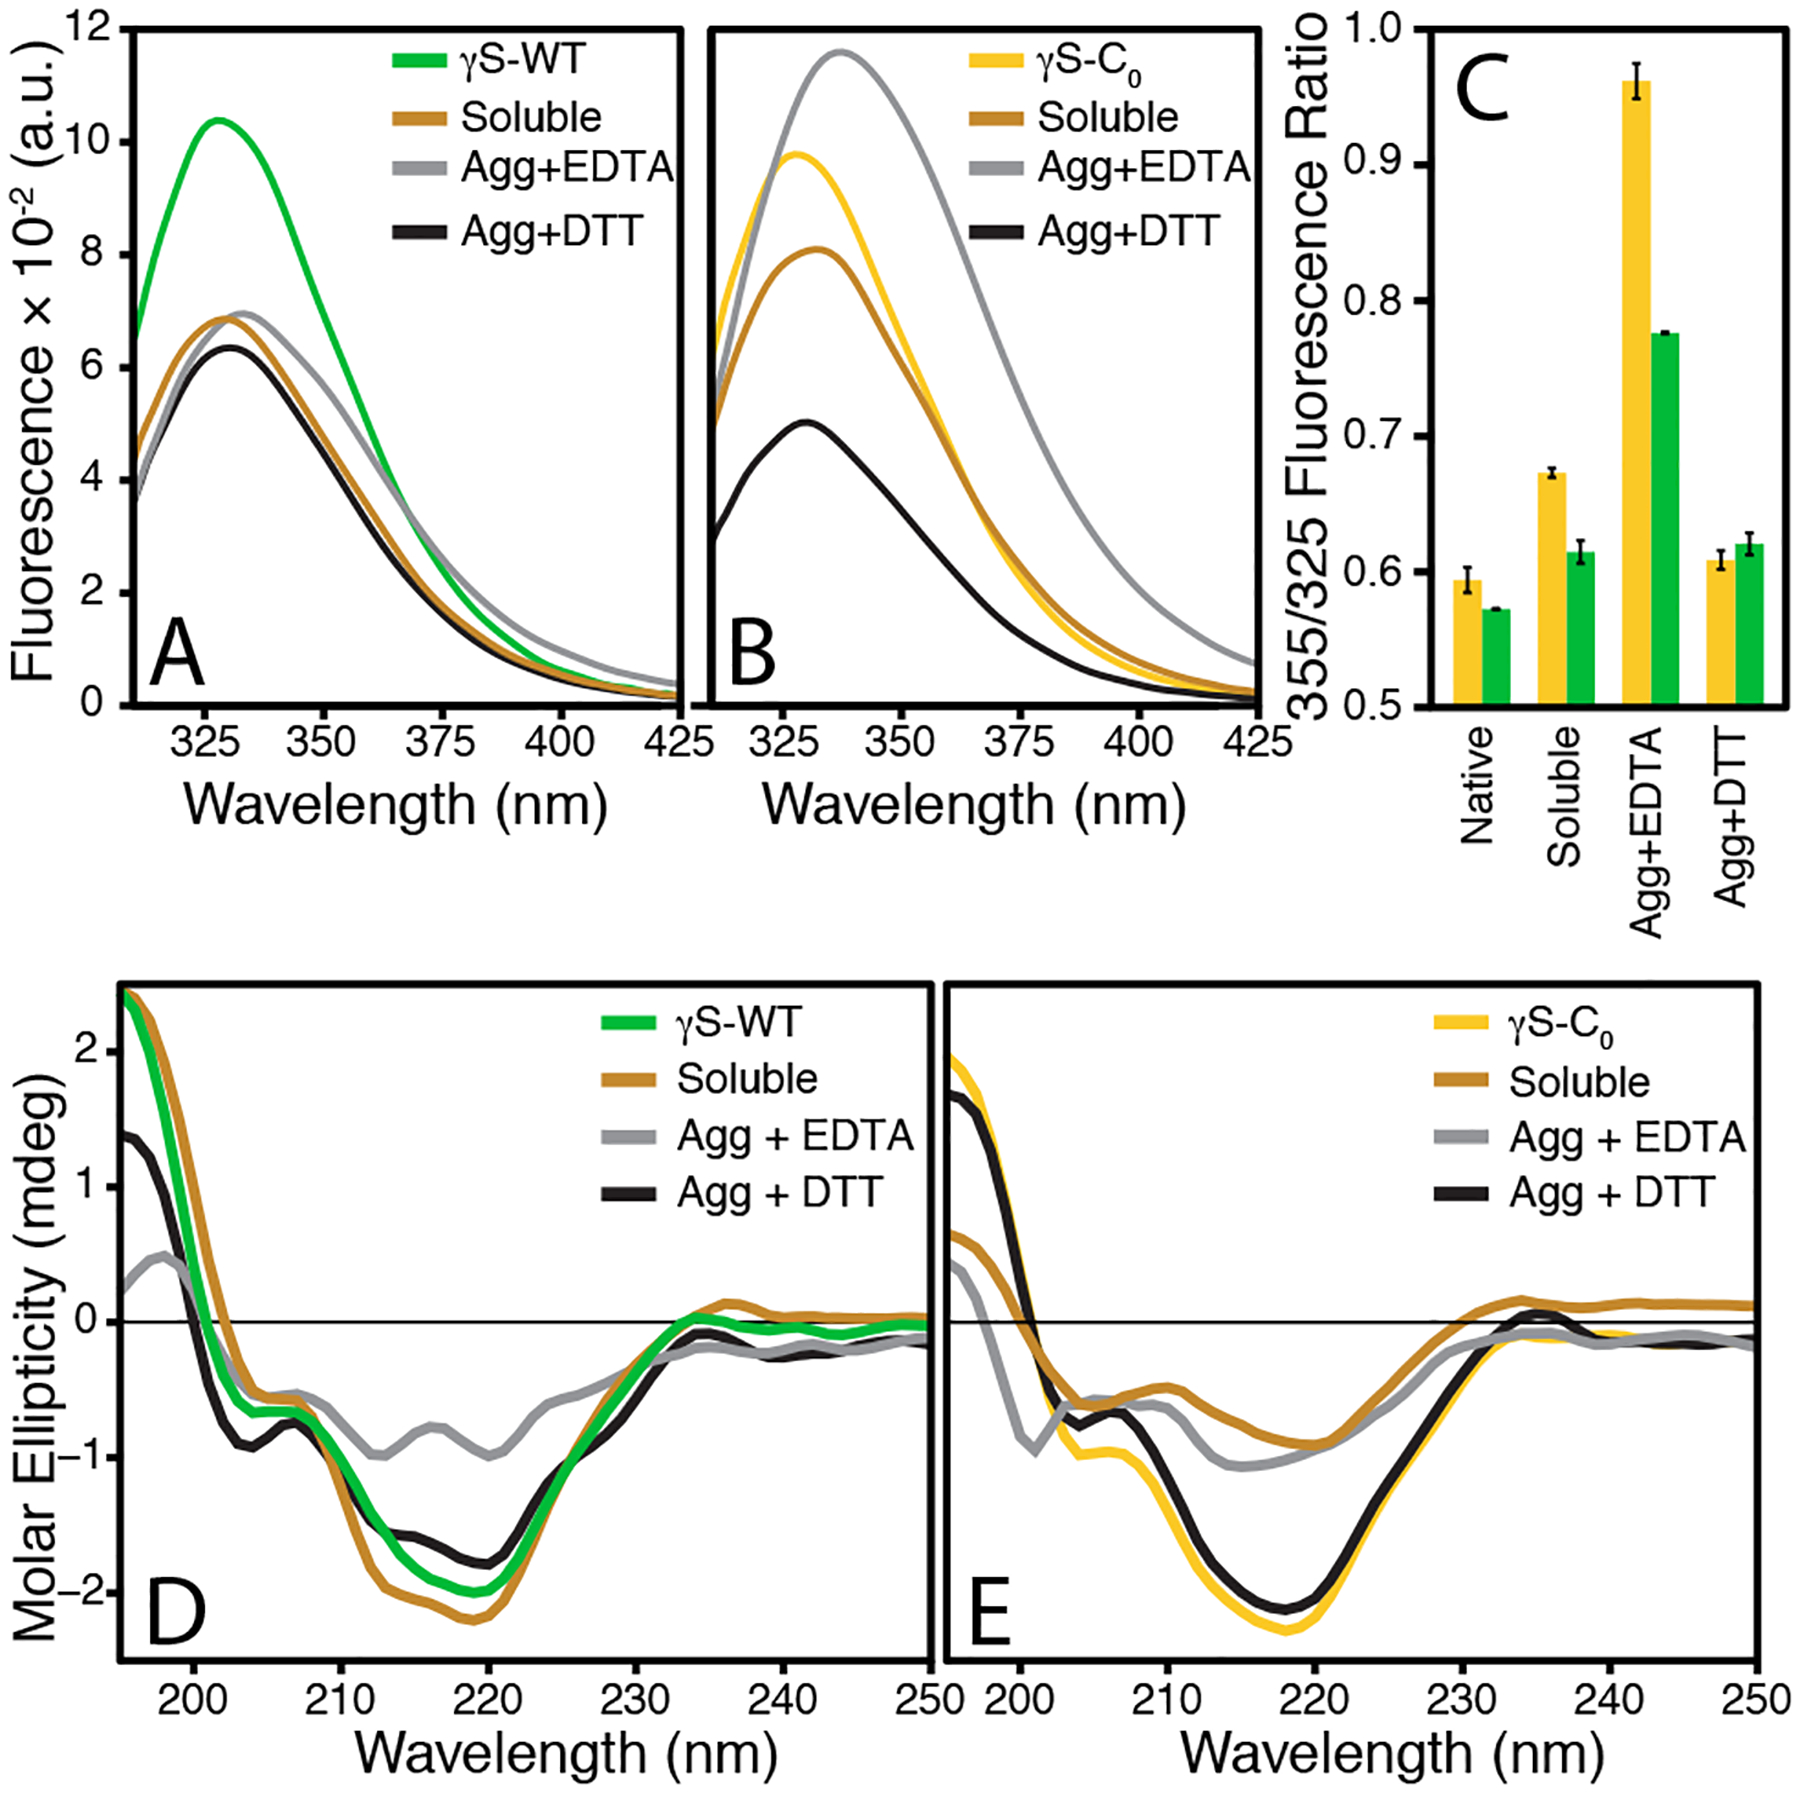
Figure 4:

Fluorescence and CD spectra of soluble and aggregated γS-WT and γS-C0 after incubation with 2 equivalents of CuCl2. Both EDTA-resolubilized species exhibit the greatest extent of unfolding, with considerably more unfolding occurring in γS-C0 than γS-WT. (A) Fluorescence of untreated and copper-incubated samples of γS-WT. (B) Fluorescence of untreated and copper-incubated samples of γS-C0. (C) The 355 nm over 325 nm fluorescence intensity ratio for each of the samples measured in parts (A) and (B). Error bars represent one standard deviation. (D) CD of untreated and copper-incubated samples of γS-WT. (E) CD of untreated and copper-incubated samples of γS-C0.
