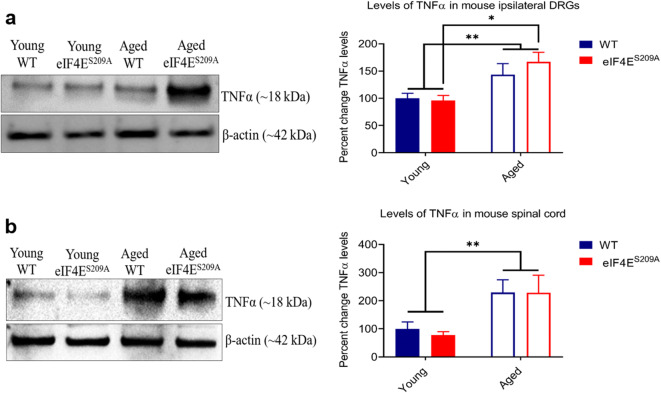
Fig. 6.
Levels of TNFα in indicated tissues. a Representative western blot for TNFα in ipsilateral DRGs and its densitometric analysis. Data are represented as mean and standard error of the mean (young WT and eIF4ES209A, and aged eIF4ES209A n = 6; aged WT n = 7). A two-way ANOVA was performed followed by Tukey’s post hoc for multiple comparisons. *p = 0.0216. b Representative western blot for TNFα in the spinal cord and its densitometric analysis. Data plotted and analyzed as for part a (young WT, n = 6; young eIF4ES209A, n = 5; aged WT, n = 7; aged eIF4ES209A, n = 6). **p = 0.0041

