Abstract
Purpose
Breast cancer (BC) is the most common cancer in women. Emerging evidence has demonstrated that lncRNAs play an important role in BC. The objective of this study was to investigate the impact of the long non-coding RNA (lncRNA), H19/miRNA-130a-3P/special AT-rich sequence-binding protein-1 (SATB1) axis on BC progression.
Materials and Methods
Expression of lncRNA and RNA was quantified via RT-qPCR. CCK-8, colony formation, wound healing, transwell, and flow cytometric analyses were used to analyze the proliferation, migration, invasion and apoptosis of cells. A dual-luciferase reporter assay and a RNA immunoprecipitation (RIP) assay were used to assess molecular binding. Protein levels were measured by Western blotting. The function of the lncRNA H19 (hereafter referred to as H19) was examined by xenotransplantation.
Results
We demonstrated that H19 expression was higher in cancer tissues and cancer cell lines than in adjacent non-tumor tissues and normal cell lines, respectively. H19 silencing inhibited the proliferation, migration and invasion of BC cells, and induced apoptosis. In addition, H19 directly bound to miR-130a-3p and downregulated its expression. We further demonstrated that H19 sponged miRNA-130a-3p, which resulted in SATB1 upregulation, thus promoting BC progression. Silencing of H19 substantially suppressed BC tumorigenesis in vivo.
Conclusion
Our data uncovered a novel mechanism of BC progression based on the H19-miR-130a-3p-SATB1 axis.
Keywords: H19, breast cancer, long noncoding RNA, miR-130a-3p, SATB1
Introduction
Breast cancer (BC), one of the most common cancers in women, poses a great threat to the health of women.1 According to recent estimates, approximately 279,100 new cases and 42,690 deaths from BC are projected for 2020 in the United States.2 Although some progress has been made in mastectomy, chemotherapy, radiotherapy and even molecular targeted therapy in the last few decades, the 5-year overall survival rate of BC patients remains poor, especially in metastatic cases.3 An examination of BC-related molecular networks may help identify mechanisms that regulate gene transcription in tumors and enable the development of new methods for targeted treatment.4 Therefore, elucidating the mechanisms underlying the initiation and development of BC may provide effective targets for cancer diagnosis, prognosis and management.5
Long non-coding RNAs (lncRNAs) belong to a class of RNAs that comprises RNAs consisting of more than 200 nucleotides.6 Aberrant lncRNA expression has frequently been observed in many human diseases, especially cancer.7 Several reports have shown that lncRNAs play an important regulatory role in a variety of malignant tumors.8,9 H19, which is located on chromosome 11p15.5 and expressed exclusively from the maternal allele, encodes a 2.3-kb lncRNA.10 H19 plays a critical role in all stages of tumorigenesis.11 Recent studies have highlighted the carcinogenic effects of H19 in a variety of cancers, such as lung, stomach, and pancreatic cancers.12–14 Moreover, we have previously demonstrated that H19 is a putative biomarker of BC.15 However, the role of H19 in cancer has not yet been characterized at the molecular level.
The aim of this study was to investigate the expression of H19 in BC and the mechanism(s) underlying its regulation. Our study showed that imbalance between H19 and miR-130a-3p affects BC progression by targeting special AT-rich sequence-binding protein-1 (SATB1). Our study identifies a new molecular mechanism that underlies the occurrence and development of BC, thereby providing a new theoretical basis for BC treatment.
Materials and Methods
Clinical Samples
The present study was performed with the approval of the Ethics Committee of Guangxi Medical University Cancer Hospital and in accordance with the provisions of the Helsinki Declaration. All participants provided written informed consent. A total of 50 BC specimens and 50 para-cancerous normal tissue specimens were collected. These tissues were surgically resected at the Guangxi Medical University Cancer Hospital between January and May 2019. All cases were validated via a histological test for BC that was conducted according to World Health Organization criteria. None of the patients had received preoperative radiation or chemotherapy. Tissue samples were immediately stored in −196°C liquid nitrogen until needed for subsequent experiments.
Cell Culture and Transfection
Human normal mammary epithelial cells (MCF-10A) and BC cells (MDA-MB-231 and MCF-7) were purchased from the Chinese Academy of Sciences (Beijing, China).
The cells were cultured in Dulbecco’s modified Eagle’s medium (DMEM; Gibco, Grand Island, NY, USA) containing 10% fetal bovine serum (FBS; Gibco) and 1% penicillin/streptomycin (Gibco) at 37°C and under 5% CO2 conditions. H19-specific small interfering RNAs (siRNAs), NC mimic, miR-130a-3p inhibitor, and scammer RNA (NC) were transfected into the cells using Lipofectamine RNAiMAX Transfection Reagent (Invitrogen, Carlsbad, CA, USA), while the plasmids were transfected with Lipofectamine 3000 (Invitrogen), according to the manufacturer’s instructions.
Reverse Transcription-Quantitative Polymerase Chain Reaction (RT-qPCR)
Total RNA was extracted from BC tissues or cells using TRIzol reagent (Takara, Otsu, Japan). The quality and quantity of RNA were evaluated using a Nanoscale Spectrophotometer (Thermo Fisher Scientific, Massachusetts, USA). Subsequently, total RNA was reverse transcribed into cDNA using a Reverse Transcription kit (Takara). RT-qPCR was performed on a qtower3 G (Jena Analysis, Germany) system using Power TB Green (Takara), which was also used for data collection. The 2−ΔΔCt method was used to analyze relative gene expression.
The primers for lncRNA H19 were (forward) 5ʹ-ACTCAGGAATCGGCTCTGGAAGG-3ʹ and (reverse) 5ʹ-GATGTGGTGGCTGGTGGTCAAC-3. The primers for miR-130a-3p were (forward) 5ʹ-GATGCTCTCAGTGCAATGTTA-3ʹ and (reverse) 5ʹ-CTCTGTCTCTCGTCTTGTTGGTAT-3ʹ; The primers for U6 were (forward) 5ʹ-GCGCGTCGTGAAGCGTTC-3ʹ and (reverse) 5′-GTGCAGGGTCCGAGGT-3′.
Cell Counting Kit-8 (CCK-8) Assay and Colony Formation Assay
BC cells in the logarithmic growth phase were treated with trypsin (Beyond, Shanghai, China), following which the cell suspension was adjusted to 1 × 10⁴/mL, and 100 μL of this suspension was added to each well of a 96-well plate. The cells were cultured for 24, 48, and 72 h after inoculation, and 10 μL of CCK8 (Dojindo, Tokyo, Japan) was added to each well. Next, the cells were cultured for 1 h, and the optical density (OD) value was measured at 450 nm using a microplate reader (Bio-Tek Instruments, Hopkinton, MA, USA).
For the colony-forming test, 500 cells were cultured in 6-well plates for 14 days. The colonies were fixed with 4% paraformaldehyde (Solarbio, Beijing, China) for 10 min, stained with crystal violet for 30 min and photographed. The colonies were counted manually under a microscope (Olympus, Tokyo, Japan).
Wound Healing Assay
Cell migration was determined by the wound healing test. At confluence, the cells were scraped off with a 200 μL tip and gently rinsed with phosphate-buffered saline (PBS). The cells were further cultured in serum-free medium for 24 h. Photographs were taken under a microscope (Olympus, Tokyo, Japan) at 0 and 24 h, and the scratch area was measured using Image J software.
Matrigel Transwell Assay
In the migration test, 1 × 10⁵ cells were inoculated into the upper chambers (8 μm pore diameter, BD Biosciences, San Jose, CA, USA) and coated with Matrigel (BD Biosciences, San Jose, CA, USA). Complete medium (600 μL) was added to the bottom chamber. After incubation at 37°C for 24 h, the cells on the top surface of the membrane were removed with cotton swabs. The invading cells were fixed with 4% paraformaldehyde, stained with crystal violet, and washed with distilled water. The cells were then counted under an inverted microscope (Olympus, Tokyo, Japan).
Flow Cytometry Assay
Apoptosis was detected using an annexin APC/7-AAD apoptosis kit (BD Biosciences, San Jose, CA, USA). The cells were digested with trypsin without EDTA and washed twice with PBS. After resuscitation in 100 μL of 1×binding buffer containing 5 μL of Annexin V-APC and 5 μL of 7-AAD, the cells were incubated in the dark at room temperature for 20 min. Next, 400 μL of 1×binding buffer were added to each sample, and apoptosis was detected via flow cytometry (BD Biosciences).
Dual-Luciferase Reporter Assay
Prediction of microRNA (miRNA) targets was performed using TargetScan (http://www.targetscan.org/vert_72/), and the binding sites between miRNAs and lncRNAs were predicted via Starbase (http://starbase.sysu.edu.cn/). PmirGLO luciferase reporter gene vectors containing wild-type (H19-wt) or mutant (H19-mut) H19 were transfected into MDA-MB-231 and MCF-7 cells with liposome 2000 reagent (Invitrogen), and co-transfected with miR-130a-3p mimic or control cells. Similarly, luciferase reporter gene vectors containing SATB1-wt or SATB1-mut were transfected into MDA-MB-231 and MCF-7 cells, and co-transfected with miR-130a-3p. After 48 h, luciferase activity was determined according to the dual-luciferase reporter detection system (E1910; Promega, Beijing, China).
RNA Immunoprecipitation (RIP) Assay
MDA-MB-231 and MCF-7 cells were transfected with miR-130a-3p or miR-NC for 48 h. RIP was analyzed using a Magna RIP RNA Binding Protein Immunoprecipitation Kit (Millipore Sigma, Burlington, MA, USA). The cells were lysed with RIP buffer containing magnetic beads, which were conjugated with an antibody against IgG (Millipore Sigma) or argonaute2 (Ago2; Millipore Sigma) overnight at 4°C. H19 enrichment in the IgG or Ago2 immunoprecipitation complex was detected by RT-qPCR.
Protein Isolation and Western Blot Analysis
The cells were washed twice with pre-cooled PBS, and total protein was extracted using radio-immunoprecipitation assay buffer (RIPA; Beyotime Biotechnology, Shanghai, China). The BCA method was used to determine protein concentration (Beyond Biotechnology, Shanghai, China). After denaturation, equivalent protein samples were separated using 10% sodium dodecyl sulfate polyacrylamide gel electrophoresis (SDS-PAGE). The proteins were then transferred to polyvinylidene fluoride (PVDF) membranes (Millipore, Billerica, MA, USA), which were blocked with 5% skimmed milk for 1 h. The blots were incubated overnight with anti SATB1 (ab109122, Abcam, Cambridge, UK) and GAPDH (ab8245, Abcam) at 4°C. Subsequently, goat anti-rabbit HRP-labeled secondary antibodies (ab205718, Abcam) and an enhanced chemiluminescence reagent (Beyond Biotechnology) were used for detection.
Tumor Xenograft Assay
All experimental protocols strictly adhered to the guidelines for experimental animal care and use issued by the National Institutes of Health and were approved by the Animal Care and Use Committee of the Guangxi Medical University Cancer Hospital. Female, 4-week-old BALB/c nude mice (Guangxi Medical University Experimental Animal Center, Guangxi, China) were raised in a specific pathogen-free environment and subcutaneously injected with MDA-MB-231 cells stably expressing si-H19 or NC. Each group contained six nude mice. After 1 week of cell inoculation, the width and length of the transplanted tumor were measured with a Vernier caliper every week. The tumor volumes were determined according to the following equation: tumor volume (mm3) = 0.5 × length (mm) × width2 (mm2). At week 5 post-inoculation, all mice were euthanatized, and subcutaneous xenografts were collected, weighed and stored in liquid nitrogen for further use.
Immunohistochemistry
The tissue sections were dried at 60°C for 1 h, then dewaxed with an automatic dyeing machine and rehydrated. After washing with PBS, the sections were incubated with 3% hydrogen peroxide for approximately 5 min. The slices were then immersed in a 0.01 mol/L 3% citrate buffer and heated in a microwave oven at 95°C. After 30 min, non-immunized goat serum was added, and the resulting preparation was incubated overnight with Ki-67 antibody (ab15580, Abcam, Cambridge, UK) at 4°C. After incubation with Ki-67 antibody, the sections were washed in PBS, and incubated with HRP-labeled goat anti-rabbit IgG (ab205718, Abcam) for 30 min. The sections were then exposed to newly prepared diaminobenzidine for 4–6 min and stained with hematoxylin for 15 s.
Statistical Analysis
Statistical analysis was performed by using GraphPad PRISM 5.0 software (Graphpad, Inc., La Jolla, CA, USA). IHC quantification was performed via Image J 1.48 software. Each experiment was repeated thrice. All data are expressed as mean ± standard deviation (SD). Differences between groups were evaluated using Student’s t-test or one-way ANOVA. The correlation between H19 and miR-130a-3p expression was assessed using Pearson’s correlation analysis. Statistical significance was set at P < 0.05.
Results
H19 is Overexpressed in BC Tissues and Cell Lines
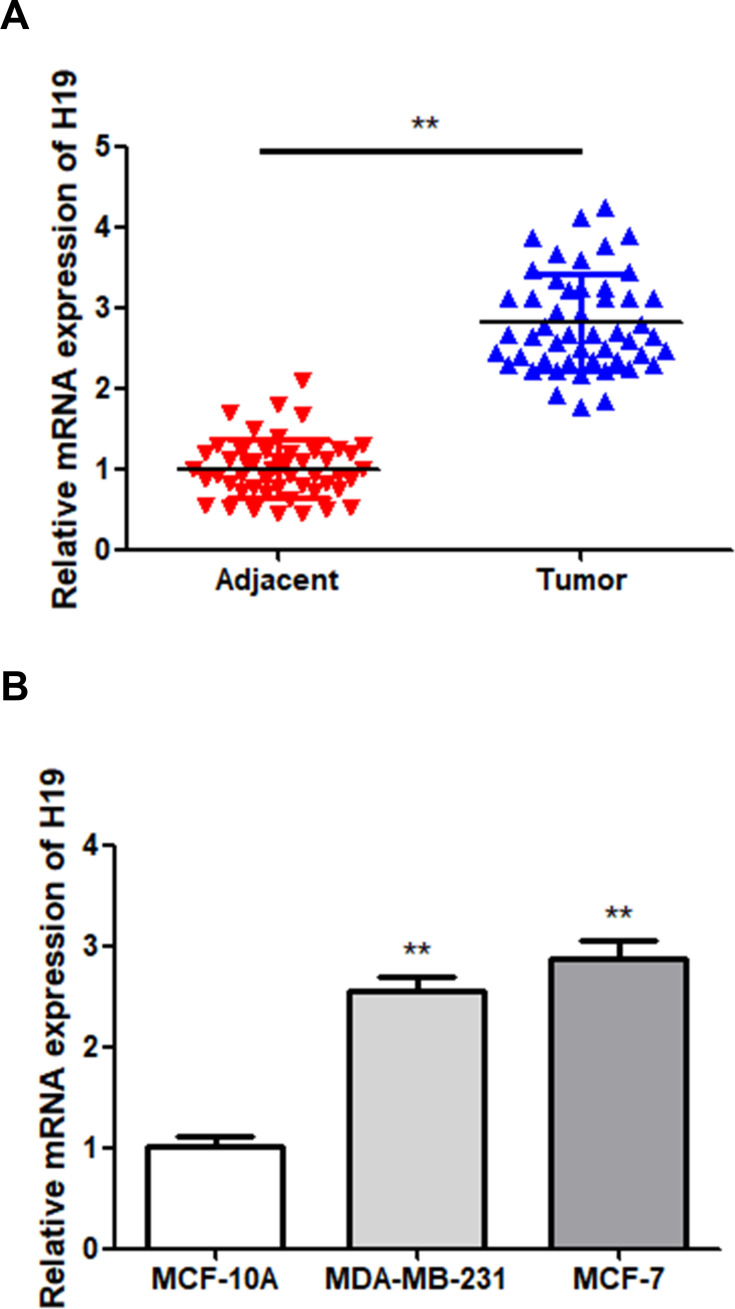
In order to determine the role of H19 in BC, H19 expression in BC tissues and cell lines was first examined via RT-qPCR. The results showed that H19 expression was upregulated in tumor tissues compared to that in adjacent normal tissues (Figure 1A; P < 0.01). The BC cell lines showed a higher expression level of H19 compared to MCF-10A cells (Figure 1B; P < 0.01). These results indicated that H19 expression was upregulated in BC.
Figure 1.
Upregulation of H19 in BC samples. (A) The expression of H19 in BC and adjacent normal tissues was detected via RT-qPCR. (B) The expression of H19 in MCF-10A and two BC cells was detected via RT-qPCR; **P < 0.01.
H19 Knockdown Suppressed Cell Proliferation, Migration, and Invasion, and Enhanced Apoptosis in BC
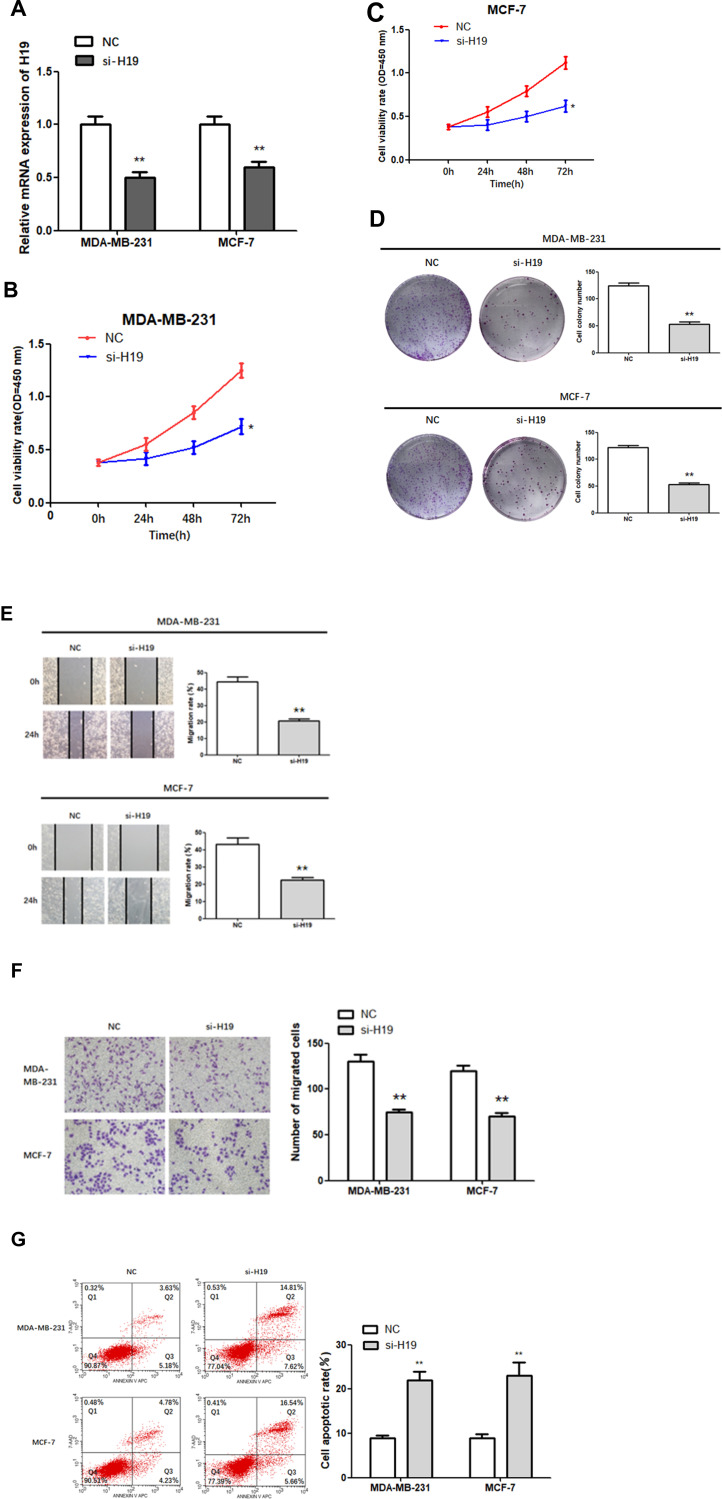
Subsequently, siRNA was constructed to further explore the role of H19 in BC. The results of the RT-qPCR assay indicated that transfection of si-H19 resulted in a significant reduction in the levels of H19 in MDA-MB-231 and MCF-7 cells (Figure 2A; P < 0.01), demonstrating successful transfection. Next, the proliferation of H19-silenced cells was measured via a CCK-8 assay and found to be significantly lower compared to NC cells (Figure 2B and C; P < 0.05).
Figure 2.
Function of H19 in MDA-MB-231 and MCF-7 cells. (A) RT-qPCR was used to detect the relative expression levels of H19 after silencing. (B–D) Following H19 silencing, CCK8 and colony formation assays were performed to evaluate cell proliferation. (E and F) After H19 silencing, wound healing and Matrigel transwell assays were used to measure cell migration and invasion. (G) Flow cytometry was used to detect apoptosis of H19-silenced cells; *P < 0.05, **P < 0.01.
Similarly, colony-forming tests showed that H19-silenced cells formed fewer colonies than control cells (Figure 2D; P < 0.01). Next, we investigated the effect of H19 silencing on cell migration and invasion using the wound scratch method and the Matrigel transwell method, respectively. The results showed that MDA-MB-231 and MCF-7 cells transfected with si-H19 migrated much more slowly (Figure 2E; P < 0.01) and were less invasive (Figure 2F; P < 0.01) compared to control cells. In addition, H19 suppression significantly increased apoptosis rates in both MDA-MB-231 and MCF-7 cells compared to that in the NC group (Figure 2G; P < 0.01). In conclusion, H19 downregulation inhibited the proliferation, migration and invasion of BC cells, and promoted cell apoptosis.
miR-130a-3p Shared a Targeted Relationship with H19 and Was Downregulated in BC
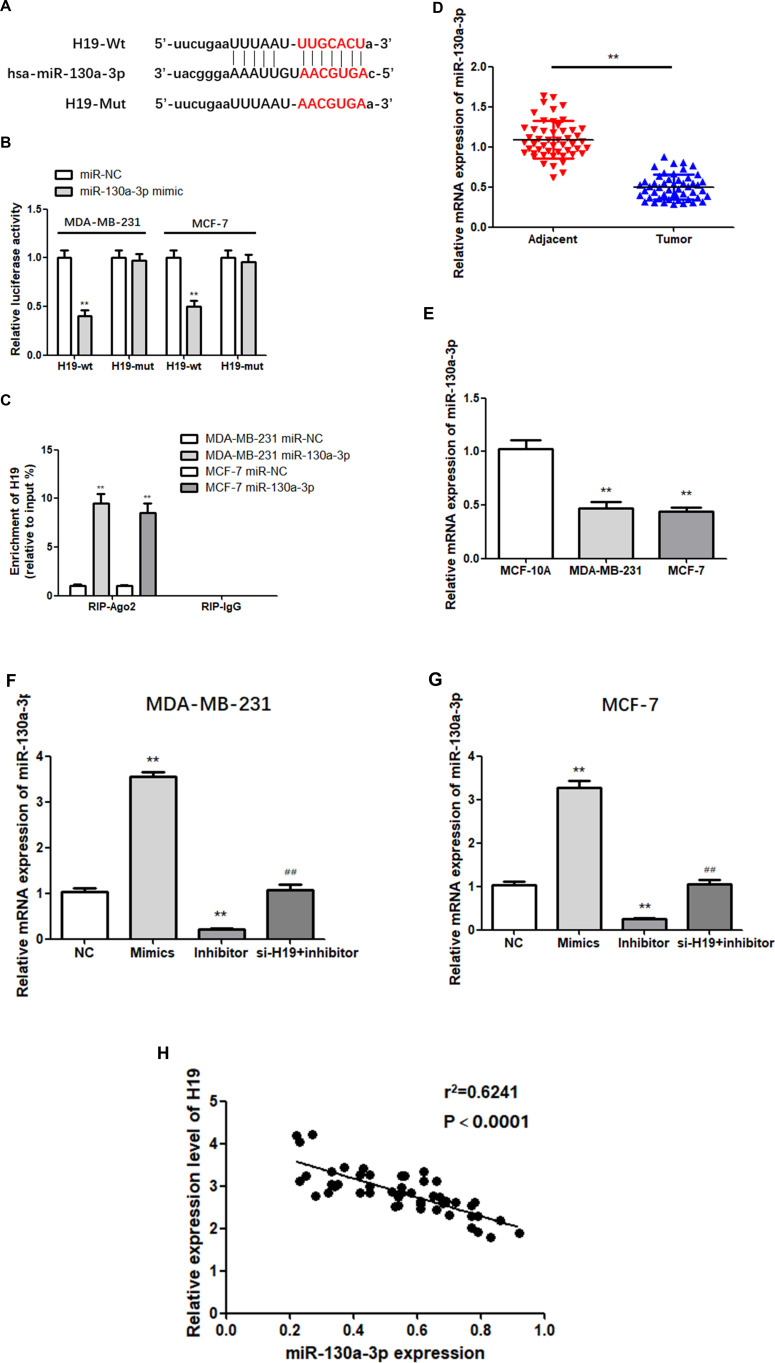
According to Starbase predictions, miR-130a-3p combines with the 3ʹ- UTR of H19 (Figure 3A). To verify this prediction, a dual-luciferase reporter assay was performed. The results showed that luciferase activity in the miR-130a-3p mimic and H19-wt co-transfection groups was relatively lower than that in the H19-wt and NC co-transfection groups, while no significant changes were observed in the H19-mut group (Figure 3B; P < 0.01). In addition, RIP analysis indicated that transfection with the miR-130a-3p mimic led to a substantial upregulation of H19 in RIP-Ago2, compared with RIP-IgG (Figure 3C; P < 0.01). These findings suggest that H19 binds to mir-130a-3p in a sequence-specific manner. Next, the expression of miR-130a-3p in 50 pairs of tissue was examined via RT-qPCR, which showed that miR-130a-3p was significantly downregulated in BC tissues (Figure 3D; P < 0.01). Similarly, the expression of miR-130a-3p in MDA-MB-231 cells and MCF-7 cells was significantly lower compared to that in MCF-10A cells (Figure 3E; P < 0.01). In addition, the relative expression of miR-130a-3p following transfection was examined by RT-qPCR. As expected, miR-130a-3p silencing significantly downregulated the expression of miR-130a-3p, while transfection with the miR-130a-3p mimic led to the opposite effect (Figure 3F and G; P < 0.01). H19 was negatively correlated with miR-130a-3p in BC tissues (3H). In conclusion, these results confirmed that miR-130a-3p was a direct target of H19, which downregulated it in BC cells.
Figure 3.
H19 targets miR-130a-3p. (A) Predicted binding sites of miR-130a-3p in H19 3ʹ-UTR. (B and C) Dual-luciferase reporter gene detection and RNA immunoprecipitation assay confirmed the relationship between H19 and miR-130a-3p. (D) MiR-130a-3p was downregulated in BC tissues compared to adjacent normal tissues. (E) MiR-130a-3p level was significantly decreased in BC cells compared to MCF-10A cells. (F and G) The miR-130a-3p mimic increased miR-130a-3p expression compared to negative controls (NC), while miR-130a-3p inhibitor decreased the expression of miR-130a-3p. (H) Negative correlation between H19 and miR-130a-3p expression in breast cancer tissues. **P < 0.01, compared to the NC group; ##P < 0.01, compared to the inhibitor group.
H19 Promoted BC Cell Proliferation, Migration and Invasion, and Suppressed Apoptosis by Downregulating miR-130a-3p
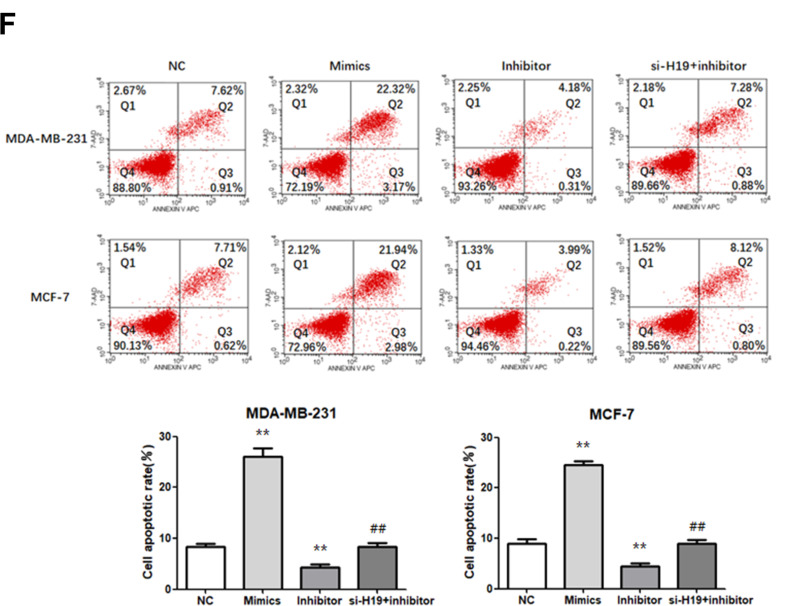
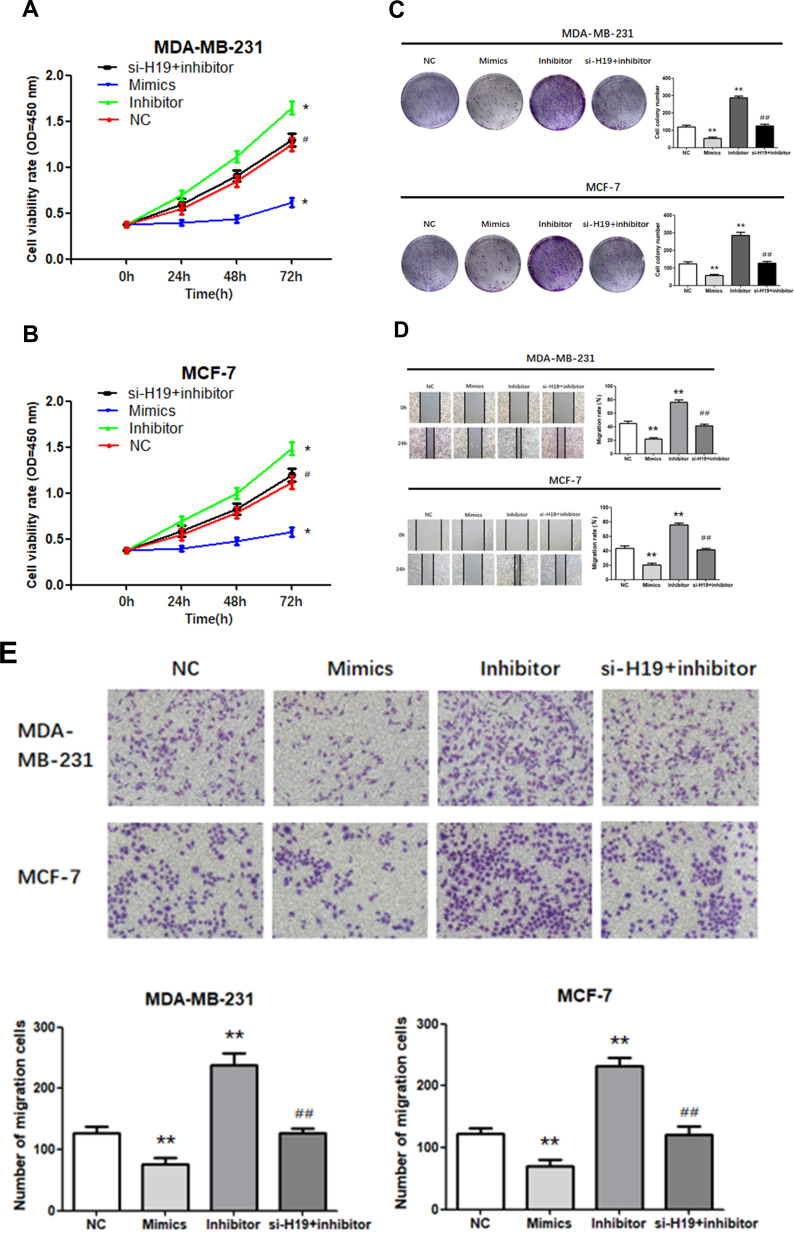
We investigated whether H19 regulated cell proliferation, migration, invasion, and apoptosis through miR-130a-3p. A “rescue” experiment was performed by co-transfecting a miR-130a-3p inhibitor and si-H19. The CCK-8 (Figure 4A and B; P < 0.05) and a colony formation assays (Figure 4C; P < 0.01) demonstrated that miR-130a-3p upregulation inhibited cell proliferation, while its suppression enhanced the proliferation of both MDA-MB-231 and MCF-7 cells. Wound scratching (Figure 4D; P<0.01) and Matrigel transwell (Figure 4E; P<0.01) assays showed that miR-130a-3p overexpression significantly inhibited cell migration and invasion, which had been enhanced by miR-130a-3p suppression, in both MDA-MB-231 and MCF-7 cells. Furthermore, flow cytometry indicated that miR-130a-3p overexpression increased the apoptosis rates in both cell lines, while its downregulation resulted in the opposite effect (Figure 4F; P < 0.01). In addition, the miR-130a-3p inhibitor promoted the proliferation, migration and invasion of the two cell lines, while its co-transfection with si-H19 prevented these effects. Similarly, the miR-130a-3p inhibitor decreased the apoptosis rate in both cell lines, while its co-transfection with si-H19 restored the apoptosis rate to normal levels. In summary, the downregulation of miR-130a-3p by H19, promoted BC cell proliferation, migration and invasion, and suppressed BC cell apoptosis.
Figure 4.
Transfection of cells with miR-130a-3p inhibitor abolished the effects of si-H19. (A and B) CCK-8 assay was used to determine the growth curve. (C) Representative images of colony-forming experiments. (D) Representative images of wound healing assays. (E) Representative results of Matrigel Transwell assay; the number of invading cells is indicated. (F) Detection of apoptosis rates in MDA-MB-231 and MCF-7 cells via flow cytometry. *P < 0.05, **P < 0.01, compared to the NC group; #P < 0.05, ##P < 0.01, compared to the inhibitor group.
Figure 4.
Continued.
SATB1 is a Target of miR-130a-3p and is Regulated by the H19/miR-130a-3p Axis in BC
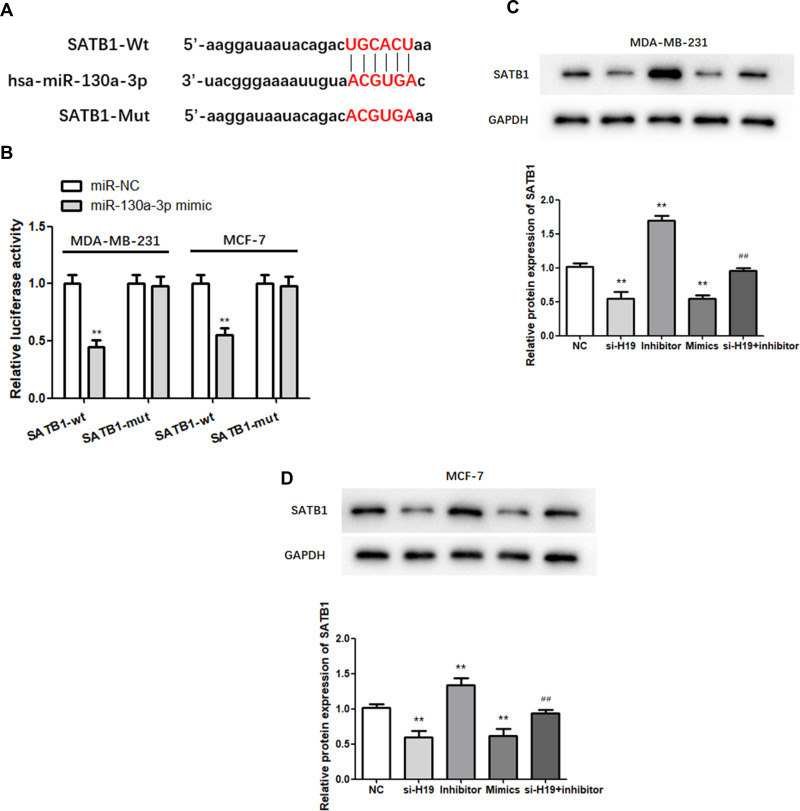
TargetScan analysis identified SATB1 as a candidate target of miR-130a-3p (Figure 5A). A dual-luciferase assay showed that relative luciferase activity was lower in the miR-130a-3p mimic and SATB1-wt co-transfection groups than in the SATB1-wt and NC co-transfection groups, while it was not significantly altered in the SATB1-mut group. This indicated that direct binding occurred between miR-130a-3p and SATB1 (Figure 5B; P < 0.01). Western blot analysis was used to further explore the effect of the miR-130a-3p/H19 axis on SATB1 protein expression in BC. In MDA-MB-231 and MCF-7 cells, miR-130a-3p overexpression or H19 silencing significantly inhibited the expression of SATB1 protein, while miR-130a-3p suppression increased the level of SATB1 protein compared to that of the NC group (Figure 5C and D; P < 0.01). In addition, H19 silencing significantly reduced SATB1 protein expression, which was restored to normal levels following co-transfection with the miR-130a-3p inhibitor (Figure 5C and D; P < 0.01). In conclusion, SATB1 expression was regulated by H19/miR-130a-3p in BC.
Figure 5.
MiR-130a-3p targets the 3ʹ-UTR of SATB1. (A) The predicted binding sites of miR-130a-3p in the SATB1 3′-UTR are shown. (B) Dual-luciferase reporter gene detection confirmed the relationship between miR-130a-3p and SATB1. (C and D) Analysis of SATB1 expression by Western blot. **P < 0.01, compared to the NC group; ##P < 0.01, compared to the inhibitor group.
H19 Silencing Suppressed BC Tumorigenesis in vivo
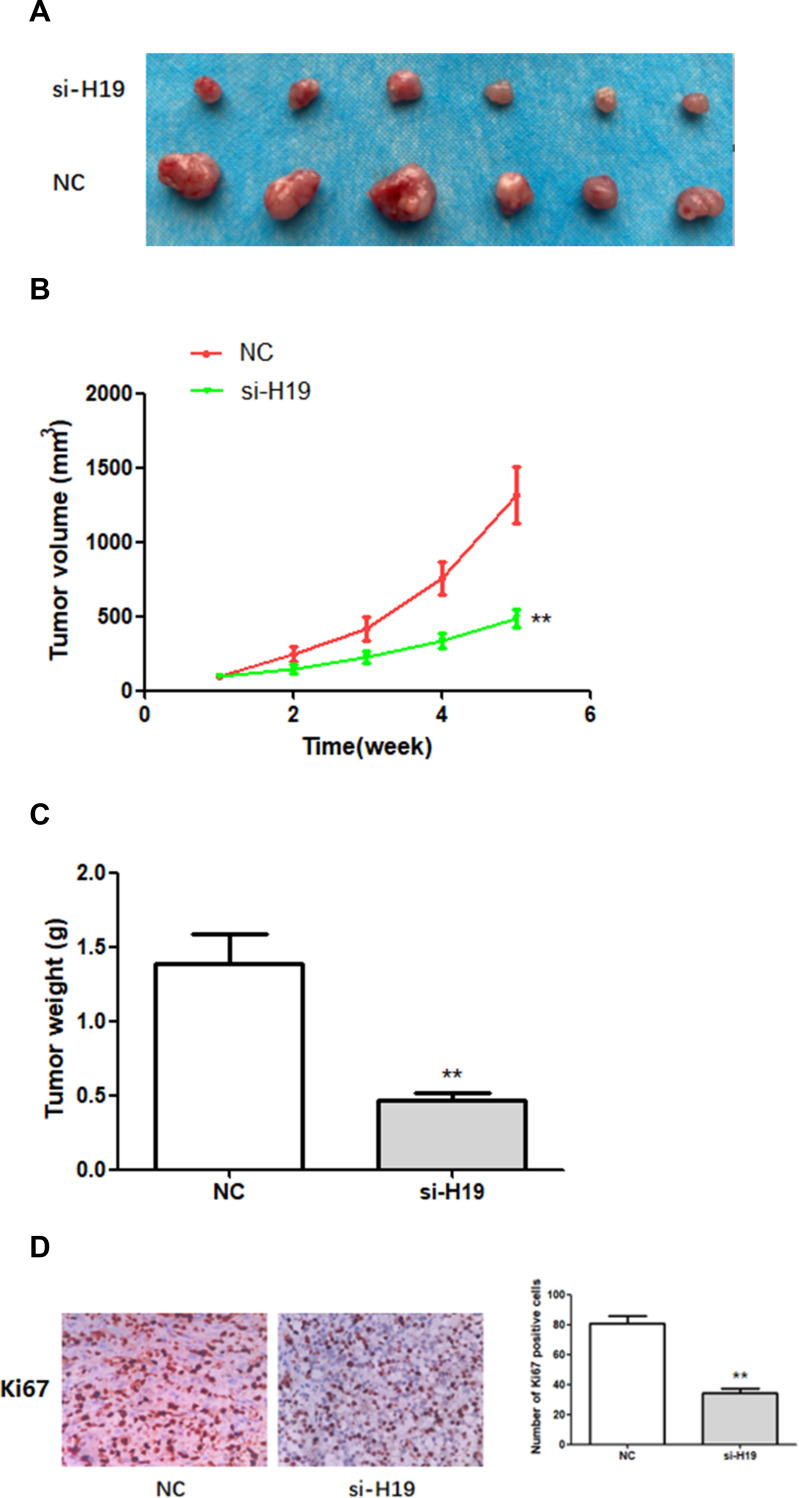
In order to study the effect of H19 on BC growth in vivo, a mouse xenograft model was established by subcutaneously injecting MDA-MB-231 cells stably expressing si-H19 or NC into mice. Five weeks after cell injection, subcutaneous xenografts were harvested and photographed (Figure 6A). Tumor growth in the si-H19 group was considerably slower than that in the NC group (Figure 6B). The weight of subcutaneous xenografts originating from H19-deficient MDA-MB-231 cells was significantly lower than that of xenografts derived from NC cells (Figure 6C). In addition, immunohistochemistry (IHC) indicated that downregulation of H19 decreased the number of Ki67-positive cells (Figure 6D). These findings indicated that downregulation of H19 inhibited the development of BC in vivo.
Figure 6.
The effects of H19 on the growth of breast cancer cells in vivo. (A–C) H19 suppression significantly inhibited BC development in vivo, as shown by the reduction in tumor volume and weight. (D) In vivo immunohistochemical analysis shows that H19 downregulation inhibited BC development. **P < 0.01, compared with NC group.
Discussion
The incidence of BC ranks first among female tumors, and the incidence of invasive ductal BC, which is the most commonly observed subtype, is increasing annually.16 Despite the rapid progress that has been made in diagnosing and treating BC, mortality remains high, and new sensitive targets need to be urgently identified.17 Currently, researchers are increasingly focusing attention on the development and progression of BC.18,19 The findings of this study indicated that H19 was significantly upregulated in BC compared to that in adjacent normal tissues and normal mammary epithelial cells, whereas miR-130a-3p expression was suppressed in BC tissues and cell lines. Downregulation of H19 inhibited the proliferation, migration and invasion of BC cells and promoted the apoptosis of these cells, by reducing the expression of miR-130a-3p. Moreover, H19 knockdown increased the expression of SATB1. These findings provide a theoretical basis for the study of lncRNA-targeted therapy for BC.
LncRNAs act as competitive endogenous RNAs (ceRNAs) of miRNAs, ultimately affecting the expression of miRNA target proteins at the post-transcriptional level.20 Incidentally, miRNAs are a type of small non-coding RNA, which influence multiple cellular processes by acting as the main regulators of gene expression.21 Reportedly, miRNAs regulate gene expression by binding to the 3 ‘- untranslated region (3ʹUTR) of target mRNAs.22 TP73-AS1-miR-200a, NEAT1-miR-211, and DANCR-miR-758-3p axes are closely related to BC progression.23–25 A bioinformatics based analysis conducted by our study predicted that H19 contained binding sites for miR-130a-3p, and that miR-130a-3p expression was regulated by H19 in vitro. Further experimental verification showed that miR-130a-3p exerted antitumor effects on BC, which result substantiated those of previous studies regarding the role of miR-130a-3p in glioma.26 Thus, our results demonstrated that H19 regulated BC progression by sponging miR-130a-3p. Evidently, epithelial mesenchymal transition (EMT) is an important process in tumor development. EMT is essential for developmental processes and has been shown to occur in wound healing, organ fibrosis and the initiation of metastasis during cancer progression. The Wnt/beta-catenin signaling pathway, an EMT inducer, plays an important role in EMT, by upregulating N-cadherin and downregulating E-cadherin and vimentin. Previous studies have confirmed that H19 knockdown inhibited EMT in BC cells.27,28
In addition, we identified SATB1 as a target of miR-130a-3p. SATB1, a chromatin organizer and regulator of global transcription, was first described by Dickinson and coworkers in 1992.29 SATB1, which is a nuclear matrix-binding protein, participates in chromatin remodeling and regulates the expression of multiple genes.29,30 SATB1 expression has been shown to be associated with the progression, invasion, metastasis and poor prognosis of breast, pancreatic, bladder, prostate, lung, ovarian, liver and kidney cancer, as well as nasopharyngeal carcinomas.31,32 Reports indicate that SATB1 may regulate the expression of more than 10% of the human genes.33,34 Our study demonstrated that SATB1 expression was positively correlated with H19. Furthermore, we verified that the expression of SATB1 was regulated by H19 and miR-130a-3p, thereby confirming that BC development was regulated by the H19/miR-130a-3p/SATB1 axis.
Conclusions
Our findings indicated that H19 accelerated BC cell proliferation, migration and invasion, while suppressing cell apoptosis by sponging miR-130a-3p and regulating SATB1. Moreover, H19 knockdown inhibited tumor growth in vivo. However, this study was beset by some limitations. First, the accuracy of results may be affected by the small sample size used. Second, the mechanism by which H19 overexpression induces BC progression remains unclear, and additional studies may be necessary to dissect the role of the lncRNA H19/miR-130a-3P/SATB1 axis in BC progression. Moreover, the association between H19 and other potential miRNA targets needs to be addressed. Finally, only two types of BC cells, MDA-MB-231 and MCF-7, were investigated making it difficult to draw definitive conclusions.
However, our study provided evidence that H19, mir-130a-3p, and SATB1 form an interactive regulatory network affecting the progression of BC cells.
Acknowledgments
This research was supported by the National Natural Science Foundation of China. (no. 81760481). Yuansheng Lin is the co-first author.
Abbreviations
BC, breast cancer; lncRNA, long non-coding RNA; SATB1, special AT-rich sequence-binding protein-1; RIP, RNA immunoprecipitation; OD, optical density; PBS, phosphate-buffered saline; SDS-PAGE, sodium dodecyl sulfate polyacrylamide gel electrophoresis; PVDF, polyvinylidene fluoride; EMT, epithelial-mesenchymal transition.
Data Sharing Statement
All data of this article can be obtained by contacting the corresponding author (Wei Wei). We confirm that any data intended for sharing will be de-identified.
Disclosure
The authors report no conflicts of interest in this work.
References
- 1.Bray F, Ferlay J, Soerjomataram I, Siegel RL, Torre LA, Jemal A. Global cancer statistics 2018: GLOBOCAN estimates of incidence and mortality worldwide for 36 cancers in 185 countries. CA Cancer J Clin. 2018;68(6):394–424. [DOI] [PubMed] [Google Scholar]
- 2.Siegel RL, Miller KD, Jemal A. Cancer statistics, 2020. CA Cancer J Clin. 2020;70(1):7–30. [DOI] [PubMed] [Google Scholar]
- 3.Tian T, Wang M, Lin S, et al. The impact of lncRNA dysregulation on clinicopathology and survival of breast cancer: a systematic review and meta-analysis. Mol Ther Nucleic Acids. 2018;12:359–369. doi: 10.1016/j.omtn.2018.05.018 [DOI] [PMC free article] [PubMed] [Google Scholar]
- 4.Chereda H, Bleckmann A, Kramer F, Leha A, Beissbarth T. Utilizing molecular network information via graph convolutional neural networks to predict metastatic event in breast cancer. Stud Health Technol Inform. 2019;267:181–186. [DOI] [PubMed] [Google Scholar]
- 5.Qin C, Jin L, Li J, et al. Long non-coding RNA LINC02163 accelerates malignant tumor behaviors in breast cancer by regulating the microRNA-511-3p/HMGA2 axis. Oncol Res. 2020. doi: 10.3727/096504020X15928179818438 [DOI] [PMC free article] [PubMed] [Google Scholar]
- 6.Gooding AJ, Zhang B, Jahanbani FK, et al. The lncRNA BORG drives breast cancer metastasis and disease recurrence. Sci Rep. 2017;7(1):12698. doi: 10.1038/s41598-017-12716-6 [DOI] [PMC free article] [PubMed] [Google Scholar]
- 7.Zhang Y, Tao Y, Liao Q. Long noncoding RNA: a crosslink in biological regulatory network. Brief Bioinform. 2018;19(5):930–945. doi: 10.1093/bib/bbx042 [DOI] [PubMed] [Google Scholar]
- 8.Joung J, Engreitz JM, Konermann S, et al. Genome-scale activation screen identifies a lncRNA locus regulating a gene neighbourhood. Nature. 2017;548(7667):343–346. doi: 10.1038/nature23451 [DOI] [PMC free article] [PubMed] [Google Scholar]
- 9.Nie FQ, Sun M, Yang JS, et al. Long noncoding RNA ANRIL promotes non-small cell lung cancer cell proliferation and inhibits apoptosis by silencing KLF2 and P21 expression. Mol Cancer Ther. 2015;14(1):268–277. doi: 10.1158/1535-7163.MCT-14-0492 [DOI] [PubMed] [Google Scholar]
- 10.Gabory A, Jammes H, Dandolo L. The H19 locus: role of an imprinted non-coding RNA in growth and development. Bioessays. 2010;32(6):473–480. doi: 10.1002/bies.200900170 [DOI] [PubMed] [Google Scholar]
- 11.Raveh E, Matouk IJ, Gilon M, Hochberg A. The H19 Long non-coding RNA in cancer initiation, progression and metastasis - a proposed unifying theory. Mol Cancer. 2015;14:184. doi: 10.1186/s12943-015-0458-2 [DOI] [PMC free article] [PubMed] [Google Scholar]
- 12.Li X, Lv F, Li F. Erratum: long noncoding RNA H19 facilitates small cell lung cancer tumorigenesis through miR-140-5p/FGF9 axis [Corrigendum]. Onco Targets Ther. 2020;13:5493. doi: 10.2147/OTT.S265902 [DOI] [PMC free article] [PubMed] [Google Scholar]
- 13.Gan L, Lv L, Liao S. Long noncoding RNA H19 regulates cell growth and metastasis via the miR223p/Snail1 axis in gastric cancer. Int J Oncol. 2019;54(6):2157–2168. [DOI] [PubMed] [Google Scholar]
- 14.Wang F, Rong L, Zhang Z, et al. LncRNA H19-derived miR-675-3p promotes epithelial-mesenchymal transition and stemness in human pancreatic cancer cells by targeting the STAT3 pathway. J Cancer. 2020;11(16):4771–4782. doi: 10.7150/jca.44833 [DOI] [PMC free article] [PubMed] [Google Scholar]
- 15.Zhong G, Wang K, Li J, Xiao S, Wei W, Liu J. Determination of serum exosomal H19 as a noninvasive biomarker for breast cancer diagnosis. Onco Targets Ther. 2020;13:2563–2571. doi: 10.2147/OTT.S243601 [DOI] [PMC free article] [PubMed] [Google Scholar]
- 16.Hu HB, Chen Q, Ding SQ. LncRNA LINC01116 competes with miR-145 for the regulation of ESR1 expression in breast cancer. Eur Rev Med Pharmacol Sci. 2018;22(7):1987–1993. [DOI] [PubMed] [Google Scholar]
- 17.Pan Z, Ding J, Yang Z, Li H, Ding H, Chen Q. LncRNA FLVCR1-AS1 promotes proliferation, migration and activates Wnt/beta-catenin pathway through miR-381-3p/CTNNB1 axis in breast cancer. Cancer Cell Int. 2020;20:214. doi: 10.1186/s12935-020-01247-2 [DOI] [PMC free article] [PubMed] [Google Scholar]
- 18.Pecero ML, Salvador-Bofill J, Molina-Pinelo S. Long non-coding RNAs as monitoring tools and therapeutic targets in breast cancer. Cell Oncol. 2019;42(1):1–12. doi: 10.1007/s13402-018-0412-6 [DOI] [PubMed] [Google Scholar]
- 19.Campos-Parra AD, Lopez-Urrutia E, Orozco Moreno LT, et al. Long non-coding RNAs as new master regulators of resistance to systemic treatments in breast cancer. Int J Mol Sci. 2018;19(9):2711. doi: 10.3390/ijms19092711 [DOI] [PMC free article] [PubMed] [Google Scholar]
- 20.Yan F, Ma Y, Liu L, Li L, Deng J, Sun J. Long noncoding RNA HOXD-AS1 promotes the proliferation, migration, and invasion of colorectal cancer via the miR-526b-3p/CCND1 axis. J Surg Res. 2020;255:525–535. doi: 10.1016/j.jss.2020.05.078 [DOI] [PubMed] [Google Scholar]
- 21.Armand-Labit V, Pradines A. Circulating cell-free microRNAs as clinical cancer biomarkers. Biomol Concepts. 2017;8(2):61–81. [DOI] [PubMed] [Google Scholar]
- 22.Voinnet O. Origin, biogenesis, and activity of plant microRNAs. Cell. 2009;136(4):669–687. doi: 10.1016/j.cell.2009.01.046 [DOI] [PubMed] [Google Scholar]
- 23.Zou Q, Zhou E, Xu F, Zhang D, Yi W, Yao J. A TP73-AS1/miR-200a/ZEB1 regulating loop promotes breast cancer cell invasion and migration. J Cell Biochem. 2018;119(2):2189–2199. doi: 10.1002/jcb.26380 [DOI] [PubMed] [Google Scholar]
- 24.Li X, Wang S, Li Z, et al. The lncRNA NEAT1 facilitates cell growth and invasion via the miR-211/HMGA2 axis in breast cancer. Int J Biol Macromol. 2017;105(Pt 1):346–353. doi: 10.1016/j.ijbiomac.2017.07.053 [DOI] [PubMed] [Google Scholar]
- 25.Zhang XH, Li BF, Ding J, et al. LncRNA DANCR-miR-758-3p-PAX6 molecular network regulates apoptosis and autophagy of breast cancer cells. Cancer Manag Res. 2020;12:4073–4084. doi: 10.2147/CMAR.S254069 [DOI] [PMC free article] [PubMed] [Google Scholar]
- 26.Hu Q, Yin J, Zeng A, et al. H19 functions as a competing endogenous RNA to regulate EMT by sponging miR-130a-3p in Glioma. Cell Physiol Biochem. 2018;50(1):233–245. doi: 10.1159/000494002 [DOI] [PubMed] [Google Scholar]
- 27.Gao H, Hao G, Sun Y, Li L, Wang Y. Long noncoding RNA H19 mediated the chemosensitivity of breast cancer cells via Wnt pathway and EMT process. Onco Targets Ther. 2018;11:8001–8012. doi: 10.2147/OTT.S172379 [DOI] [PMC free article] [PubMed] [Google Scholar]
- 28.Yan L, Yang S, Yue CX, et al. Long noncoding RNA H19 acts as a miR-340-3p sponge to promote epithelial-mesenchymal transition by regulating YWHAZ expression in paclitaxel-resistant breast cancer cells. Environ Toxicol. 2020;35(9):1015–1028. doi: 10.1002/tox.22938 [DOI] [PubMed] [Google Scholar]
- 29.Dickinson LA, Joh T, Kohwi Y, Kohwi-Shigematsu T. A tissue-specific MAR/SAR DNA-binding protein with unusual binding site recognition. Cell. 1992;70(4):631–645. doi: 10.1016/0092-8674(92)90432-C [DOI] [PubMed] [Google Scholar]
- 30.Kohwi-Shigematsu T, Kohwi Y, Takahashi K, et al. SATB1-mediated functional packaging of chromatin into loops. Methods. 2012;58(3):243–254. doi: 10.1016/j.ymeth.2012.06.019 [DOI] [PMC free article] [PubMed] [Google Scholar]
- 31.Fromberg A, Engeland K, Aigner A. The special AT-rich sequence binding protein 1 (SATB1) and its role in solid tumors. Cancer Lett. 2018;417:96–111. doi: 10.1016/j.canlet.2017.12.031 [DOI] [PubMed] [Google Scholar]
- 32.Glatzel-Plucinska N, Piotrowska A, Dziegiel P, Podhorska-Okolow M. The role of SATB1 in tumour progression and metastasis. Int J Mol Sci. 2019;20(17):4156. doi: 10.3390/ijms20174156 [DOI] [PMC free article] [PubMed] [Google Scholar]
- 33.Pavan Kumar P, Purbey PK, Sinha CK, et al. Phosphorylation of SATB1, a global gene regulator, acts as a molecular switch regulating its transcriptional activity in vivo. Mol Cell. 2006;22(2):231–243. doi: 10.1016/j.molcel.2006.03.010 [DOI] [PubMed] [Google Scholar]
- 34.Purbey PK, Singh S, Notani D, Kumar PP, Limaye AS, Galande S. Acetylation-dependent interaction of SATB1 and CtBP1 mediates transcriptional repression by SATB1. Mol Cell Biol. 2009;29(5):1321–1337. doi: 10.1128/MCB.00822-08 [DOI] [PMC free article] [PubMed] [Google Scholar]


