Abstract
Biliary tract cancer (BTC) is typically lethal due to the difficulty of early stage diagnosis. Thus, novel biomarkers of BTC precursors are necessary. Biliary intraepithelial neoplasia (BilIN) is a major precursor of BTC and is classified as low or high grade based on cell atypia. In normal gastric mucosa, gastric gland mucin‐specific O‐glycans are unique in having α1,4‐linked N‐acetylglucosamine (αGlcNAc) attached to MUC6. Previously, we reported that αGlcNAc functions as a tumor suppressor of differentiated‐type gastric adenocarcinoma and that decreased αGlcNAc glycosylation on MUC6 in gastric, pancreatic, and uterine cervical neoplasms occurs in cancer as well as in their precursor lesions. However, αGlcNAc and MUC6 expression patterns in biliary tract neoplasms have remained unclear. Here, we analyzed MUC5AC, MUC6, and αGlcNAc expression status in 51 BTC cases and compared the expression of each with progression from low‐grade BilIN to invasive adenocarcinoma (IAC). The frequency of αGlcNAc‐positive and MUC6‐positive lesions decreased with tumor progression. When we compared each marker’s expression level with tumor progression, we found that the MUC6 expression score in IAC was significantly lower than in low‐grade or high‐grade BilIN (P < 0.001 or P < 0.01, respectively). However, the αGlcNAc expression score was low irrespective of histological grade, and also lower than that of MUC6 across all histological grades (P < 0.001 for low‐grade and high‐grade BilIN, and P < 0.01 for IAC). These results suggest that decreased expression of αGlcNAc relative to MUC6 marks the initiation of BTC progression.
Keywords: αGlcNAc, biliary tract cancer, BilIN, cholangiocarcinoma, glycosylation, MUC6
Alpha‐1,4‐linked N‐acetylglucosamine glycosylation on MUC6 is already decreased in biliary intraepithelial neoplasia.

1. INTRODUCTION
Biliary tract cancer (BTC) is a lethal cancer. Its incidence remains high in East and South Asia and parts of South America, and disease incidence globally has rapidly increased over the decades. 1 , 2 BTC is often diagnosed at an advanced stage, marked by jaundice and liver dysfunction. In advanced cases, cancer cells have often spread to the pancreas, liver, and regional lymph nodes, greatly decreasing the chance for a curative resection. However, any clinical molecular markers that might be useful for early diagnosis are unknown. Thus, novel biomarkers of the early phase of BTC are required. In the 2010 WHO Classification of Tumours of the Digestive System, biliary intraepithelial neoplasia (BilIN) was defined as a precursor lesion of BTC. 3 , 4 BilIN is often observed in biliary epithelia around BTC. It can be subclassified as BilIN‐1, BilIN‐2, and BilIN‐3 based on cell atypia. 3 , 4 The revised WHO guidelines, published in 2019, recommend a two‐tiered system (ie low‐grade versus high‐grade BilIN), rather than the former three‐tiered system. In the new guidelines, high‐grade BilIN corresponds to the previous classification of BilN‐3 and low‐grade BilIN to the previous classification of BilIN‐1 and BilIN‐1. 5
Mucins are heavily glycosylated glycoproteins. Gastric mucins are classified as surface and gland mucins, and the latter contain MUC6. Gland mucins also characteristically contain specific O‐glycans decorated with terminal alpha‐1,4‐linked N‐acetylglucosamine (αGlcNAc) residues attached to the MUC6 scaffold. 6 , 7 In normal gastric mucosa, αGlcNAc and MUC6 are co–expressed in gland mucous cells. 7 , 8 Previously, we used expression cloning to isolate cDNA encoding α1,4‐N‐acetylglucosamin transferase (α4GnT), which catalyzes αGlcNAc biosynthesis. 9 We then demonstrated that immunohistochemical localization of α4GnT is associated with the Golgi region of mucous cells that produce the mucous glycoproteins having αGlcNAc, such as the glandular mucous cells of the stomach and Brunner’s gland of the duodenum. 7 In the same study, using laser confocal microscopy and immunoprecipitation, we revealed that αGlcNAc is largely attached to MUC6 secreted from gastroduodenal mucosa, but αGlcNAc is also linked to MUC5AC produced by few mucous cells located in the isthmus of the gastric fundic mucosa, indicating that most of αGlcNAc is associated with MUC6 core proteins. 7
We then generated A4gnt‐deficient mice, which showed complete loss of αGlcNAc in gland mucin. 10 Significantly, mutant mice spontaneously developed gastric differentiated‐type adenocarcinoma through a hyperplasia‐dysplasia‐carcinoma sequence without Helicobacter pylori infection. 10 We also reported that αGlcNAc expression is frequently lost in human gastric differentiated‐type adenocarcinoma expressing MUC6, 11 as well as in gastric neoplasms exhibiting oxyntic gland differentiation, including gastric adenocarcinoma of fundic gland differentiation (GA‐FG). 12 Furthermore, we analyzed pyloric gland adenoma (PGA) of the stomach, a precursor of differentiated‐type gastric cancer, and observed that decreased αGlcNAc expression in high‐grade PGA was accompanied by upregulation of Ki‐67 labeling index. 13 These findings suggest that αGlcNAc could serve as a tumor suppressor and link αGlcNAc loss to gastric carcinogenesis from its precancerous status.
Accordingly, we previously evaluated αGlcNAc and MUC6 expression in gastric gland‐like mucin‐producing tumors arising in extra‐gastric organs. In the pancreas, we observed significantly decreased αGlcNAc expression relative to MUC6 not only in invasive carcinoma but in corresponding premalignant lesions, including intraductal papillary mucinous neoplasm (IPMN) and pancreatic intraepithelial neoplasia (PanIN), indicating that decreased αGlcNAc glycosylation occurs in early phases of these malignancies. 14 In the uterine cervix, we observed reduced αGlcNAc expression relative to MUC6 in gastric‐type adenocarcinoma (GAS) as well as in atypical lobular endocervical glandular hyperplasia (LEGH), a premalignant precursor of GAS, indicating that decreased αGlcNAc glycosylation occurs in early phases of GAS carcinogenesis in the uterine cervix. 15 , 16 Overall, these studies suggest that αGlcNAc could serve as a critical biomarker of malignant potential in early stages of pyloric gland‐type epithelial neoplasia. In this context, BTC and BillIN often exhibit expression of MUC5AC, a gastric foveolar‐type mucin marker. 17 MUC5AC expression becomes more extensive with increasing degrees of BilIN. 17 However, the significance of pyloric gland‐type mucin expression has remained unclear.
Here, we used immunohistochemistry to examine expression patterns of MUC5AC, MUC6, and αGlcNAc in low‐grade and high‐grade BilIN, which are precursor lesions of BTC, as well as in IAC. We then compared relative αGlcNAc and MUC6 expression in each lesion.
2. MATERIALS AND METHODS
2.1. Patient samples
We evaluated BTC tissues from 51 surgically resected cases at Shinshu University Hospital, Matsumoto, Japan. We excluded tubulopapillary adenocarcinoma and its precursor lesions, including intraductal papillary neoplasms of biliary tract and pyloric gland adenoma cases, as they are different entities from BTC derived from BilIN. 5 All specimens were fixed in 10% buffered formalin and embedded in paraffin wax. Tissue sections were stained with H&E for histopathological analysis. We selected non–neoplastic periductal accessory glands (47 cases) as well as lesions exhibiting low‐grade BilIN (45 lesions), high‐grade BilIN (43 lesions), and IAC (46 lesions), as classified by the latest World Health Organization criteria for further evaluations. 5
This study was approved by the Ethics Committee of the Shinshu University School of Medicine, Matsumoto, Japan (no. 4080) and was in accordance with the Declaration of Helsinki.
2.2. Immunohistochemistry
Primary antibodies used in this study were: anti–MUC5AC (clone CLH2, mouse IgG, Novocastra) diluted 1:100, anti–MUC6 (clone CLH5, mouse IgG; Novocastra) diluted 1:100, and anti–αGlcNAc (clone HIK1083, mouse IgM; Kantokagaku) diluted 1:100. Conventional immunohistochemistry for all primary antibodies was carried out using the EnVision system (DakoCytomation). Tissue sections of 3‐µm thickness were deparaffinized in xylene and dehydrated in ethanol. Except for αGlcNAc, antigens were retrieved by boiling sections in 10 mmol/L Tris/HCl buffer (pH 8.0) containing 1 mmol/L EDTA for 25 minutes in a microwave oven. For staining, we used an automated stainer (Nichirei Bioscience) according to the vendor’s protocol. A negative control experiment was carried out by omitting primary antibodies from the staining procedure, and no positive signals were seen (data not shown). Immunohistochemical evaluation was undertaken in two ways. First, lesions in which > 10% of the total number of tumor cells of each lesion stained positively were judged as positive. Second, MUC5AC, MUC6, and αGlcNAc expression levels were further scored semi‐quantitatively from 0 to 3 as follows: 0 (≤10% positive cells), 1 (11%‐33% positive cells), 2 (34%‐66% positive cells), or 3 (≥67% positive cells), as described previously. 14 , 15 , 16
2.3. Statistical analysis
Correlations between each histological grade (low‐grade BilIN, high‐grade BilIN, and IAC) and the number of lesions positive for each mucin marker (MUC5AC, MUC6, and αGlcNAc) was statistically analyzed using Fisher’s exact probability test. Semi‐quantitative expression scores for each mucin marker (MUC5AC, MUC6, and αGlcNAc) were analyzed statistically using the Wilcoxon matched pairs test. All analyses were carried out with Microsoft Office Excel 2010 (Microsoft). P‐values < 0.05 were considered statistically significant.
3. RESULTS
3.1. Expression of mucin core proteins MUC5AC and MUC6 as well as alpha‐1,4‐linked N‐acetylglucosamine in non–neoplastic biliary tract
To evaluate mucin phenotypes in non–neoplastic tissue, we performed immunohistochemical analysis of non–neoplastic biliary tract epithelial cells adjacent to the tumor in patient samples to determine the expression of MUC5AC, MUC6, and αGlcNAc. In the biliary tract, MUC5AC was expressed in non–neoplastic surface epithelium but not in non–neoplastic periductal mucous gland cells (Figure 1). Both MUC6 and αGlcNAc were co–expressed in both non–neoplastic deeper pits of bile ducts and periductal accessory gland cells of the biliary tract (Figure 1). MUC5AC and MUC6 were detected in cytoplasm rather than mucus droplets of the cells, whereas αGlcNAc was restricted to mucus droplets of the cells (Figure 1).
Figure 1.
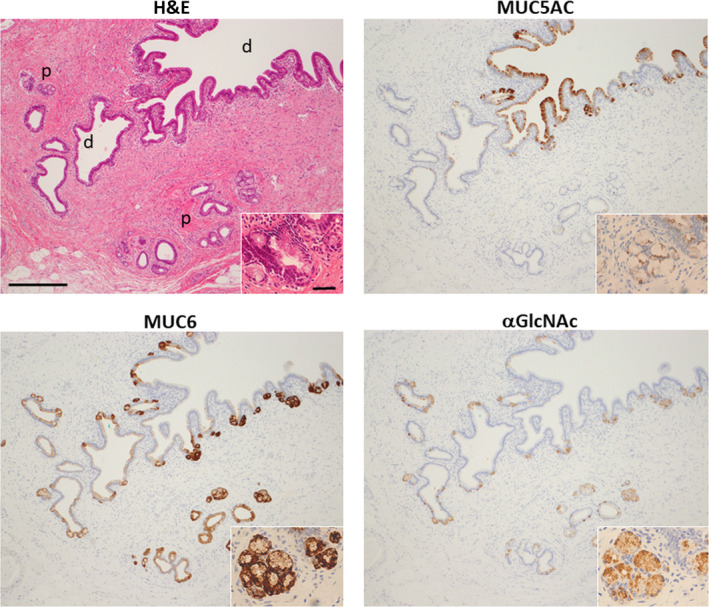
Mucin expression of MUC5AC, MUC6, and alpha‐1,4‐linked N‐acetylglucosamine (αGlcNAc) in surrounding non–neoplastic epithelium and periductal accessory glands of the bile duct. In the upper left panel, “p” indicates periductal gland and “d” indicates biliary duct. Note that MUC5AC is expressed in non–neoplastic epithelium but not in non–neoplastic periductal glands. MUC6 and αGlcNAc are co–expressed in non–neoplastic deeper pits of bile ducts and periductal accessory glands (scale bar = 250 μm). Insets show enlarged views of the same sections (scale bar = 20 µm)
3.2. Expression of MUC5AC, MUC6, and alpha‐1,4‐linked N‐acetylglucosamine in biliary neoplasm lesions exhibiting the biliary intraepithelial neoplasia‐adenocarcinoma sequence
We undertook same immunohistochemical analyses of MUC5AC, MUC6, and αGlcNAc expression in selected neoplastic biliary tract epithelial lesions in patient samples. MUC5AC was expressed in tumor cells irrespective of the histological grade (Figure 2). MUC5AC was positive in 40 (88.9%) of 45 low‐grade BilIN, 40 (93.0%) of 43 high‐grade BilIN, and 41 (89.1%) of 46 IAC lesions (Table 1). The number of MUC5AC‐positive lesions did not differ significantly among histological grades (P = 0.38 between low‐grade BilIN and high‐grade BilIN, P = 0.40 between high‐grade BilIN and IAC, and P = 0.62 between low‐grade BilIN and IAC). MUC6 was typically expressed in both low‐grade and high‐grade BilIN but was undetectable in IAC lesions (Figure 2). Overall, MUC6 was expressed in 41 (91.1%) of 45 low‐grade BilIN, 34 (79.1%) of 43 high‐grade BilIN, and 24 (52.2%) of 46 IAC lesions (Table 1). The number of MUC6‐positive lesions in IAC was significantly lower than that seen in high‐grade or low‐grade BilIN (P < 0.01 or P < 0.001, respectively). However, low‐grade and high‐grade BilIN lesions did not differ significantly in MUC6 positivity (P = .10). αGlcNAc was typically positive in low‐grade BilIN but negative in high‐grade BilIN and IAC (Figure 2). We observed αGlcNAc expression in 19 (42.2%) of 45 low‐grade BilIN, 8 (18.6%) of 43 high‐grade BilIN, and 6 (13.0%) of 46 IAC lesions (Table 1). The number of αGlcNAc‐positive lesions representing low‐grade BilIN was significantly greater than that seen in high‐grade BilIN or IAC lesions (P < 0.05 and P < 0.01, respectively). Differences in the number of αGlcNAc‐positive lesions in high‐grade BilIN and IAC were not significant (P = .33).
Figure 2.
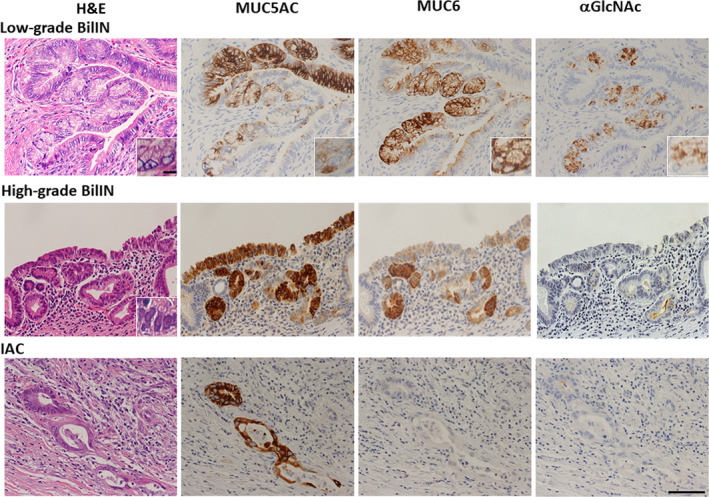
Representative immunohistochemical expression pattern of MUC5AC, MUC6, and alpha‐1,4‐linked N‐acetylglucosamine (αGlcNAc) in low‐grade and high‐grade biliary intraepithelial neoplasia (BilIN) and invasive adenocarcinoma (IAC). MUC5AC is expressed in tumor cells, irrespective of tumor grade. MUC6 is expressed in tumor cells in low‐grade BilIN and high‐grade BilIN. αGlcNAc is expressed in low‐grade BilIN, in regions coincident with MUC6 expression. However, αGlcNAc expression appears more restricted than that of MUC6. αGlcNAc is not expressed in tumor cells in either high‐grade BilIN or IAC. Scale bar (bottom, right) = 100 μm. Inset shows enlarged view of the same sections (scale bar = 10 μm)
Table 1.
Frequency of MUC5AC‐, MUC6‐, and αGlcNAc‐positive lesions among 51 BTC cases associated with the BilIN‐IAC sequence
| Number of lesions | MUC5AC (%) | MUC6 (%) | αGlcNAc (%) | |
|---|---|---|---|---|
| Low‐grade BilIN | 45 | 40 (88.9) | 41 (91.1)* | 19 (42.2)**, *** |
| High‐grade BilIN | 43 | 40 (93.0) | 34 (79.1)** | 8 (18.6)*** |
| IAC | 46 | 41 (89.1) | 24 (52.2)*, ** | 6 (13.0)** |
| Total | 134 | 121 (90.3) | 99 (73.9) | 33 (24.6) |
Abbreviations: αGlcNAc, alpha‐1,4‐linked N‐acetylglucosamine; BilIN, biliary intraepithelial neoplasia; BTC, biliary tract cancer; IAC, invasive adenocarcinoma.
P < 0.001.
P < 0.01.
P < 0.05.
3.3. Semiquantitative evaluation of MUC5AC and MUC6, and alpha‐1,4‐linked N‐acetylglucosamine expression in biliary neoplasm lesions exhibiting the biliary intraepithelial neoplasia‐adenocarcinoma sequence
As αGlcNAc is largely attached to MUC6, and relatively decreased expression of αGlcNAc in MUC6‐positive lesions is associated with gastric, pancreatic, and uterine cervical cancer progression, 7 , 14 , 15 , 16 we compared MUC5AC, MUC6, and αGlcNAc immunoreactivity semi‐quantitatively in low‐grade and high‐grade BilIN and IAC lesions. MUC5AC expression was high in three histological grades (low‐grade and high‐grade BilIN and IAC), and we did not observe significant differences in expression scores among histological grades (P = 0.73 between low‐grade and high‐grade BilIN, P = 0.57 between high‐grade BilIN and IAC, and P = 0.83 between low‐grade BilIN and IAC) (Figure 3 and Table S1). The MUC6 expression score in IAC was significantly lower than that in low‐grade or high‐grade BilIN (P < 0.001 and P < 0.01, respectively), but significant difference in MUC6 expression score was not seen between low‐grade and high‐grade BilIN (P = 0.31) (Figure 3 and Table S2). The αGlcNAc expression score was low in three histological grades (low‐grade and high‐grade BilIN, and IAC), and there was no significant difference in expression score among these histological grades (P = 0.19 between low‐grade and high‐grade BilIN, P = 0.77 between high‐grade BilIN and IAC, and P = 0.30 between low‐grade BilIN and IAC) (Figure 3 and Table S3). We next asked whether MUC6 and αGlcNAc expression scores differed according to histological grade. In all histological grades, αGlcNAc expression levels were significantly lower than those of MUC6 (low‐grade and high‐grade BilIN, and P < 0.01 for IAC) (Figure 4).
Figure 3.
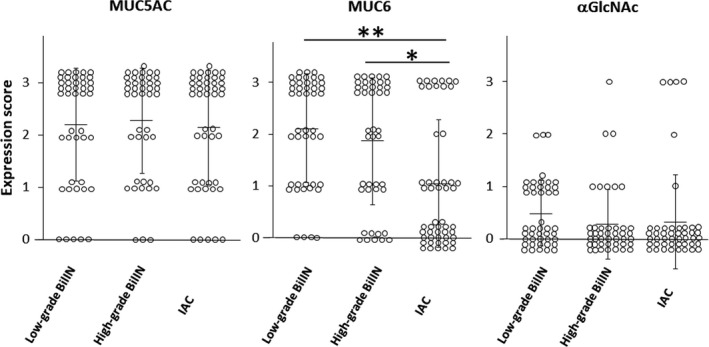
Semi‐quantitation of MUC5AC, MUC6, and alpha‐1,4‐linked N‐acetylglucosamine (αGlcNAc) expression score in low‐grade and high‐grade biliary intraepithelial neoplasia (BilIN) and invasive adenocarcinoma (IAC). Vertical bars indicate the mean ± SD. *P < 0.01 and **P < 0.001 by the Wilcoxon matched‐pair test
Figure 4.
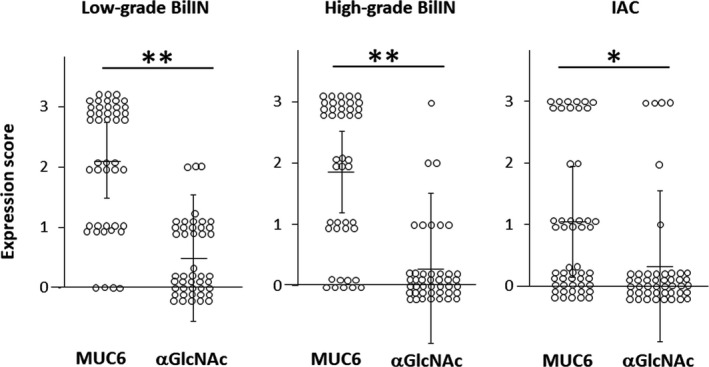
Differences in MUC6 and alpha‐1,4‐linked N‐acetylglucosamine (αGlcNAc) expression scores in low‐grade and high‐grade biliary intraepithelial neoplasia (BilIN) and invasive adenocarcinoma (IAC). Vertical bars indicate the mean ± SD. *P < 0.01 and **P < 0.001 by the Wilcoxon matched‐pair test
3.4. Semiquantitative evaluation of MUC6 and alpha‐1,4‐linked N‐acetylglucosamine expression in non–neoplastic periductal glands
The expression score of MUC6 in non–neoplastic periductal glands was significantly higher than that of αGlcNAc (P < 0.001) (Figure 5 and Table S4). However, the αGlcNAc expression score in non–neoplastic periductal glands was much higher than for the other three histological grades (low‐grade and high‐grade BilIN, and IAC) (P < 0.0001) (Figures 3 and 5).
Figure 5.
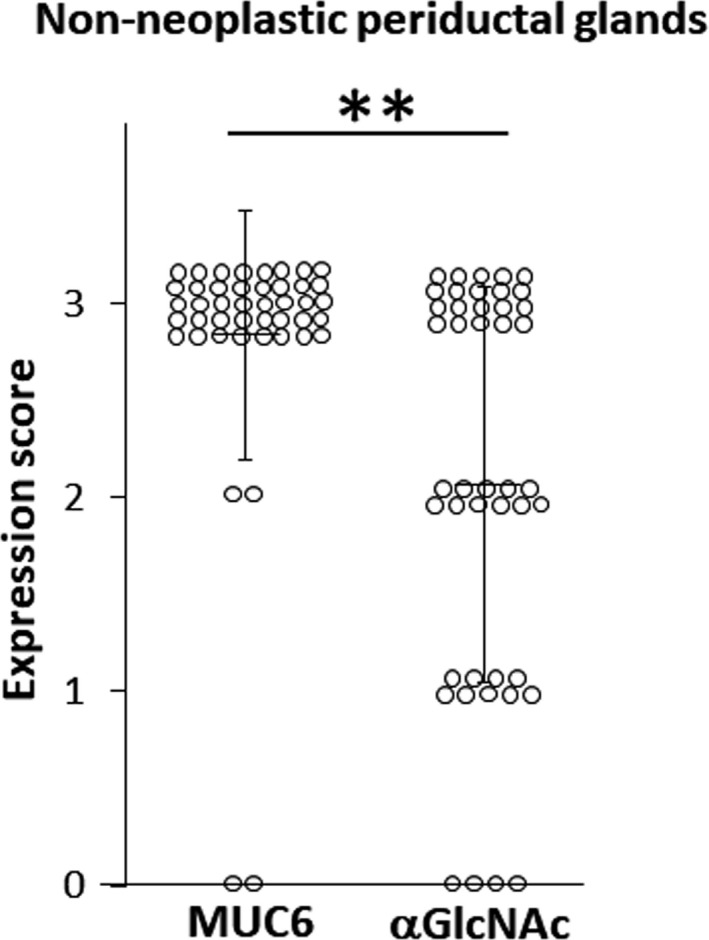
Differences in MUC6 and alpha‐1,4‐linked N‐acetylglucosamine (αGlcNAc) expression scores in non–neoplastic periductal glands. Vertical bars indicate the mean ± SD. **P < 0.001 by the Wilcoxon matched‐pair test
4. DISCUSSION
The present study reveals that decreased αGlcNAc expression relative to MUC6 is already apparent in the early phases of BTC progression in the BilIN‐IAC sequence. Both MUC6 and αGlcNAc were largely co–expressed in non–neoplastic deeper pits of bile ducts and periductal accessory glands in the biliary tract (Figure 1), but the MUC6 expression score in non–neoplastic periductal accessory glands was significantly higher than that of αGlcNAc (Figure 5). However, the αGlcNAc expression score in non–neoplastic periductal glands was much higher than those in low or high‐grade BilIN or IAC (Figures 3 and 5). In each phase of carcinogenesis during the BillIN‐IAC sequence, the expression score of αGlcNAc was significantly lower than that of MUC6 (Figure 4).
We previously reported reduced αGlcNAc expression relative to that of MUC6 in pancreatic neoplasms, including both the pancreatic intraductal neoplasm‐invasive ductal adenocarcinoma (PanIN‐IDAC) sequence and the intraductal papillary mucinous neoplasm‐invasive adenocarcinoma (IPMN‐IPMNAIC) sequence. 14 Moreover, Kobayashi et al reported that both αGlcNAc and MUC6 were expressed in periductal mucous gland cells in the pancreas. 18 Here, we show that comparable changes occur in the early stages of BillIN‐IAC sequence as well, analogous to changes seen in the progression pancreatic neoplasm. A decrease of αGlcNAc glycosylation might be related to the initiation of BTC progression. α4GnT is the sole enzyme responsible for biosynthesis of αGlcNAc glycosylation. 9 Our preliminary experiments with immunohistochemistry for α4GnT, αGlcNAc, and MUC6 revealed that in non–neoplastic bile ducts, both αGlcNAc‐positive and MUC6‐positive cells always corresponded to α4GnT‐positive cells (Figure S1), suggesting that αGlcNAc biosynthesis was regulated by α4GnT expressed in cells of the biliary tract and that decreased α4GnT expression might be related to initiation of BTC progression. However, A4gnt‐knockout mice reveal no histological change in the biliary tract. 10 Thus, future studies regarding molecular mechanisms underlying decreases of α4GnT expression and αGlcNAc glycosylation in bile duct neoplasm initiation should be of great importance.
We previously reported that αGlcNAc could be a prognostic marker in GAS in uterine cervical cancer. 16 Thus, we asked whether αGlcNAc could be a prognostic marker in IAC. MUC6‐positive IAC cases (n = 24) were selected, and then αGlcNAc expression status (n = 6 for positive cases and n = 18 for negative cases) was compared with TNM classification status. However, there was no significant difference in the UICC‐TNM classification status between the two groups (Table S5).
Relevant to MUC6 expression, the number of positive lesions as well as the MUC6 expression score in IAC were significantly lower those in seen low‐grade or high‐grade BilIN (Table 1 and Figure 3). However, the number of positive lesions and the expression score in high‐grade BilIN did not differ significantly from those observed in low‐grade BilIN (Table 1 and Figure 3), indicating that MUC6 expression decreases in the late phase of BTC progression between high‐grade BilIN and IAC. Aishima et al reported that pyloric gland type intrahepatic cholangiocarcinoma (ICC), which is MUC6‐positive, exhibits a better survival rate than the null type, which is negative for both MUC5AC and MUC6. 17 Overall, these results strongly suggest that MUC6 expression begins to decrease in the late phase of biliary tract neoplasm progression and that that change signals the acquisition of malignancy. However, further studies are needed to define molecular mechanisms underlying these outcomes.
Relevant to MUC5AC expression, the number of positive lesions as well as the expression score were high in all BilIN‐IAC phases (Table 1 and Figure 3). However, MUC5AC was expressed in non–neoplastic biliary tract superficial epithelium but was not seen in periductal glands of the biliary tract, which were positive for MUC6 and αGlcNAc (Figure 1). Zen et al 19 reported MUC5AC expression in only 4 of 10 cases of non–neoplastic epithelium (40%), and these authors observed MUC5AC expression more frequently in BilIN (89%) and intraductal cholangiocarcinoma (ICC) with BilIN (83%). These results suggest that diffuse expression of MUC5AC is apparent in initial stages of BTC progression.
In routine pathological examinations, it is sometimes difficult to diagnose BTC that spreads around periducts. In that case, immunohistochemical analysis for MUC6 and αGlcNAc, as presented here, could facilitate identification of BTC cells; ie, both MUC6‐positive and αGlcNAc‐positive expression indicate non–neoplastic periductal accessory glands and both MUC6‐and αGlcNAc‐negative or MUC6‐positive and αGlcNAc‐negative expression indicate BTC cells (Figure S2). Therefore, in pathological diagnosis of biliary tract biopsies and/or surgical margin specimens, the immunohistochemical analysis of MUC6 and αGlcNAc could be helpful in distinguishing non–neoplastic epithelium from BTC, including BilIN.
In conclusion, the present study indicates that decreased expression of αGlcNAc relative to MUC6 is an initial event marking the early phase of BTC progression. Thus, MUC6 and αGlcNAc could be distinct biomarkers in distinguishing neoplastic epithelium from non–neoplastic epithelium in the biliary tract.
DISCLOSURE
The authors have no conflicts of interest to declare.
Supporting information
Fig S1
Fig S2
Table S1‐S5
ACKNOWLEDGMENTS
We wish to express our special thanks to Professor Emeritus Shin‐ichi Miyagawa and Professor Yuji Soejima, from the Department of Surgery, Shinshu University School of Medicine, for their encouragement and discussion over the course of this study. We also thank Dr Hidenori Ojima, from Department of Pathology, Keio University School of Medicine, for his histopathological advice and Mr Kota Iwama, a student of Shinshu University School of Medicine, for his assistance in experiments. This work was supported by Grants‐in‐Aid for Scientific Research (19K16555 to K. Yamanoi and 19H03441 to J. Nakayama) from the Japan Society for the Promotion of Science.
Okumura M, Yamanoi K, Uehara T, Nakayama J. Decreased alpha‐1,4‐linked N‐acetylglucosamine glycosylation in biliary tract cancer progression from biliary intraepithelial neoplasia to invasive adenocarcinoma. Cancer Sci. 2020;111:4629–4635. 10.1111/cas.14677
REFERENCES
- 1. Torre LA, Bray F, Siegel RL, Ferlay J, Lortet‐Tieulent J, Jemal A. Global cancer statistics, 2012. CA Cancer J Clin. 2015;65:87‐108. [DOI] [PubMed] [Google Scholar]
- 2. Saha SK, Zhu AX, Fuchs CS, et al. Forty–year trends in cholangiocarcinoma incidence in the U.S.: intrahepatic disease on the rise. Oncologist. 2016;21:594‐599. [DOI] [PMC free article] [PubMed] [Google Scholar]
- 3. Nakanuma Y, Curabo MP, Franceschi S, et al. Intrahepatic cholangiocarcinoma In: Bosman FT, Carneiro F, Hruban RH, et al. eds. WHO Classification of Tumours of the Digestive System; World Health Organization of Tumours, 4th ed. Lyon: IARC; 2010:217‐224. [Google Scholar]
- 4. Albores‐Saavedra J, Adsay NV, Crawford JM, et al. Carcinoma of the gallbladder and extrahepatic bile ducts In: Bosman FT, Carneiro F, Hruban RH, eds. WHO Classification of Tumours of the Digestive System; World Health Organization of Tumours, 4th ed. Lyon: IARC; 2010:266‐273. [Google Scholar]
- 5. Kimstra DS, Lam AK, Paradis V, Schirmacher P. Tumours of the gallbladder and extrahepatic bile ducts In: Lokuhetty D, White VA, Watanabe R, Cree IA, eds. WHO Classification of Tumours, Digestive System Tumours; World Health Organization of Tumours, 5th ed. Lyon: IARC; 2019:265‐294. [Google Scholar]
- 6. Ishihara K, Kurihara M, Goso Y, et al. Peripheral α‐linked N‐acetylglucosamine on the carbohydrate moiety of mucin derived from mammalian gastric gland mucous cells: epitope recognized by a newly characterized monoclonal antibody. Biochem J. 1996;318(Pt 2):409‐416. [DOI] [PMC free article] [PubMed] [Google Scholar]
- 7. Zhang MX, Nakayama J, Hidaka E, et al. Immunohistochemical demonstration of α1,4‐N‐acetylglucosaminyltransferase that forms GlcNAcα1,4Galβ residues in human gastrointestinal mucosa. J Histochem Cytochem. 2001;49:587‐596. [DOI] [PubMed] [Google Scholar]
- 8. Yamada S, Okamura T, Kobayashi S, Tanaka E, Nakayama J. Reduced gland mucin‐specific O‐glycan in gastric atrophy: a possible risk factor for differentiated‐type adenocarcinoma of the stomach. J Gastroenterol Hepatol. 2015;30:1478‐1484. [DOI] [PubMed] [Google Scholar]
- 9. Nakayama J, Yeh JC, Misra AK, Ito S, Katsuyama T, Fukuda M. Expression cloning of a human α1,4‐N‐acetylglucosaminyltransferase that forms GlcNAcα1→4Galβ→R, a glycan specifically expressed in the gastric gland mucous cell‐type mucin. Proc Natl Acad Sci USA. 1999;96:8991‐8996. [DOI] [PMC free article] [PubMed] [Google Scholar]
- 10. Karasawa F, Shiota A, Goso Y, et al. Essential role of gastric gland mucin in preventing gastric cancer in mice. J Clin Invest. 2012;122:923‐934. [DOI] [PMC free article] [PubMed] [Google Scholar]
- 11. Shiratsu K, Higuchi K, Nakayama J. Loss of gastric gland mucin‐specific O‐glycan is associated with progression of differentiated‐type adenocarcinoma of the stomach. Cancer Sci. 2014;105:126‐133. [DOI] [PMC free article] [PubMed] [Google Scholar]
- 12. Yamada S, Yamanoi K, Sato Y, Nakayama J. Diffuse MIST1 expression and decreased αGlcNAc glycosylation on MUC6 are distinct hallmark for gastric neoplasms exhibiting oxyntic gland differentiation. Histopathology. 2020;77:413‐422. [DOI] [PubMed] [Google Scholar]
- 13. Yamanoi K, Sekine S, Higuchi K, et al. Decreased expression of gastric gland mucin‐specific glycan α1,4‐linked N‐acetylglucosamine on its scaffold mucin 6 is associated with malignant potential of pyloric gland adenoma of the stomach. Histopathology. 2015;67:898‐904. [DOI] [PubMed] [Google Scholar]
- 14. Ohya A, Yamanoi K, Shimojo K, Fujii C, Nakayama J. Gastric gland mucin‐specific O‐glycan expression decreases with tumor progression from precursor lesions to pancreatic cancer. Cancer Sci. 2017;108:1897‐1902. [DOI] [PMC free article] [PubMed] [Google Scholar]
- 15. Yamanoi K, Ishii K, Tsukamoto M, Asaka S, Nakayama J. Gastric gland mucin‐specific O‐glycan expression decreases as tumor cells progress from lobular endocervical gland hyperplasia to cervical. Virchows Arch. 2018;473:305‐311. [DOI] [PubMed] [Google Scholar]
- 16. Ida K, Yamanoi K, Asaka S, et al. αGlcNAc and its catalyst α4GnT are diagnostic and prognostic markers in uterine cervical tumor, gastric type. Sci Rep. 2019;9:13043. [DOI] [PMC free article] [PubMed] [Google Scholar]
- 17. Aishima S, Kuroda Y, Nishihara Y, et al. Gastric mucin phenotype defines tumour progression and prognosis of intrahepatic cholangiocarcinoma: gastric foveolar type is associated with aggressive tumour behavior. Histopathology. 2006;49:35‐44. [DOI] [PubMed] [Google Scholar]
- 18. Kobayashi M, Fujinaga Y, Ota H. Reappraisal of the immunophenotype of pancreatic intraductal papillary mucinous neoplasms (IPMNs)—gastric pyloric and small intestinal immunophenotype expression in gastric and intestinal type IPMNs. Acta Histochem Cytochem. 2014;47:45‐57. [DOI] [PMC free article] [PubMed] [Google Scholar]
- 19. Zen Y, Sasaki M, Fujii T, et al. Different expression patterns of mucin core proteins and cytokeratins during intrahepatic cholangiocarcinogenesis from biliary intraepithelial neoplasia and intraductal papillary neoplasm of the bile duct—an immunohistochemical study of 110 cases of hepatolithiasis. J Hepatol. 2006;44:350‐358. [DOI] [PubMed] [Google Scholar]
Associated Data
This section collects any data citations, data availability statements, or supplementary materials included in this article.
Supplementary Materials
Fig S1
Fig S2
Table S1‐S5


