Abstract
Fibroblast growth factor receptor (FGFR) is associated with proliferation, migration, and angiogenesis of carcinomas, and FGFR signaling inhibitors are considered a key drug for the treatment of solid tumors with FGFR overexpression. Amplification of FGFR2 is reportedly identified in 3%‐10% of gastric cancers (GCs). The aim of this study is to clarify whether the identification of the circulating tumor cells (CTCs) with FGFR2 overexpression is useful to detect patients with FGFR2‐overexpressing GC. One hundred GC patients who underwent gastrectomy were enrolled. A total volume of 8 mL of peripheral blood was collected from each patient just before gastrectomy, and mononuclear cells were enriched by Ficol density gradient centrifugation. These cells were immunostained with PI/CD45/EpCAM/FGFR2. The number of CTCs with FGFR2 expression in each sample was enumerated by FACScan. The FGFR2 expression level of the resected primary tumor was assessed by immunohistochemistry. The number of FGFR2‐positive CTCs in the GC patients' peripheral blood was significantly correlated with the FGFR2 expression level of the primary GC. The relapse‐free survival of the patients with FGFR2‐positive CTCs (≥5 cells/10 mL blood) was significantly poorer (P = .018, log‐rank) than that of the patients without FGFR2‐positive CTCs (<5 cell/10 mL blood). These findings suggested that the determination of FGFR2‐positive CTCs might help identify an existing tumor with FGFR2 overexpression.
Keywords: clinical study, CTC, FGFR2, flow cytometry, gastric cancer
We aim to clarify the clinical significance of FGFR2‐positive CTCs in gastric cancer. FGFR2‐positive CTCs were correlated with the FGFR2 expression level of primary GC. The detection of FGFR2‐positive CTCs might help identify an existing FGFR2‐positive tumor.
![]()
Abbreviations
- APC
allophycocyanin
- CD45
cluster of differentiation 45
- CK
cytokeratin
- CTC
circulating tumor cell
- DMEM
Dulbecco's Modified Eagle Medium
- EpCAM
epithelial cell adhesion molecule
- FBS
fetal bovine serum
- FGFR
fibroblast growth factor receptor
- FITC
fluorescein isothiocyanate
- GC
gastric cancer
- PBS‐T
phosphate buffered saline with Tween 20
- PI
propidium iodide
1. INTRODUCTION
Despite recent advances in diagnostic devices and therapies for gastric cancer (GC), the prognosis of this cancer remains poor; GC is the fifth most common lethal carcinoma and the third leading morbidity in the world. 1 , 2 , 3 The clinical use of targeted therapy for specific molecules involved in the genesis and progression of cancer has been increasing and has improved the prognosis of many cancer patients. 4 , 5 , 6
Fibroblast growth factor receptor (FGFR), a transmembrane receptor tyrosine kinase, has several roles in the genesis of cancer. 7 , 8 FGFR2 amplification is reportedly identified in 3%‐10% of primary GCs. 9 , 10 FGFR signaling inhibitors have been considered a key drug in the treatment of GCs that show FGFR2 overexpression. 11 A number of FGFR inhibitors such as AZD4547, 12 NVP‐BGJ398, 13 TAS120, 14 E7090, 15 LY2877445, 16 BAY1163877, 17 and bemarituzumab (FPA144) were developed in recent years. A phase I study of FPA144 showed a good disease control rate for gastroesophageal cancer patients with FGFR2‐IIIb overexpression, 18 and a phase III trial has been ongoing for FGFR2‐positive GC patients (NCT03343301). 3 However, a phase II study of AZD4547 was performed, and AZD4547 did not improve the prognosis of GC patients with FGFR2 amplification (NCT01457846). 12 One of the reasons for the negative results of the clinical study might be the tumor heterogeneity between primary and recurrent tumors.
Most of the prior molecular analyses for the determination of target molecules used surgical resected specimens or biopsy specimens from patients, and the specimens were examined by immunohistochemistry, fluorescence in situ hybridization (FISH), or polymerase chain reaction (PCR). 4 , 19 However, differences in the driver molecule (ie, tumor heterogeneity) have been reported between resected tumors and recurrent tumors, 20 , 21 , 22 especially in GC. 23 , 24
The determination of various molecules of resected specimens might not always represent the target molecule status of the patient's recurrent or metastatic tumor because of tumor heterogeneity. The analysis of circulating tumor cells (CTCs), as a liquid biopsy, might be useful for the molecular characterization of inaccessible tumors with tumor heterogeneity that will benefit from targeted therapy. 25 , 26 , 27 , 28 , 29 This suggests that the assessment of CTCs might overcome the issue of heterogeneity among cancer patients. The present study was conducted to clarify whether FGFR2 expression on CTCs would provide an accurate indication of the FGFR2 status of existing tumors in GC patients. Also, we assessed the correlation between CTCs with FGFR2 expression and the prognosis of GC patients. To the best of our knowledge, this is the first study to investigate the clinical significance of FGFR2+ CTCs in the peripheral blood of GC patients.
2. MATERIALS AND METHODS
2.1. Cell lines
Human GC cell lines, OCUM‐2MD3, 30 KATO‐III, MKN45, and NUGC4 (JCRB Cell Bank) were used. The cells were cultured with DMEM (Wako) at 37°C in 21% O2 with 5% CO2.
2.2. Western blot analysis
Cell lysates were collected after different treatments. Each sample was subjected to electrophoresis and transferred to a polyvinylidene difluoride membrane. The membrane was placed in PBS‐T solution containing each primary antibody: FGFR2 (1:200; Cell‐Signaling), pFGFR (Y653/654) (1:200; Cell‐Signaling), or β‐actin (1:1000; Sigma‐Aldrich) at 4℃ for overnight. The blots were incubated with secondary antibody for 30 minutes and were detected by enhanced chemiluminescence using ECL prime (GE Health Care).
2.3. Spike test
A total volume of 8 mL of peripheral blood was drawn from a healthy volunteer. A total of 250 cultured tumor cells of each four GC cell lines was spiked into 2 mL of the healthy volunteer's peripheral blood. Peripheral blood mononuclear cell fraction was enriched by Ficol at 1500 g for 15 minutes, followed by dividing into four samples. The sample was stained by propidium iodide (PI; BD Bioscience), anti‐human CD45 (BD Bioscience), anti‐FGFR2 (mFR2, Daiichi Sankyo Co) conjugated with Alexa Fluor 488 (G100L‐Alexa 488), and anti‐EpCAM conjugated with APC (BD Bioscience: 347200). As control, the sample was stained with IgG1 isotype control. Flow cytometry analysis was performed on a FACScan (BD LSR II; Becton Dickinson). When the cutoff value of FGFR2‐positive fluorescence was determined 1000, the FGFR2‐positive number of OCUM‐2MD3 and KATO‐III was high, and the FGFR2‐positive number of MKN45 and NUGC3 was low in the spike test. FGFR2+ cells were determined FGFR2 Alexa488 >103 after the exclusion of PI‐positive and CD45‐positive cells. Isotype negative control was defined as PI‐negative and CD45‐negative to exclude nonspecific binding of the primary antibody.
2.4. Sample preparation from GC patients' peripheral blood for CTC analysis
One hundred patients with GC who underwent gastrectomy at Osaka City University Hospital between December 2016 and January 2019 were enrolled. The pathological diagnoses and classifications were made according to the Japanese Classification of Gastric Carcinoma (14th edition). 31 This study was approved by the Osaka City University Ethics Committee (approval number 3159). Informed consent was obtained from all patients, and the study has been conducted according to the principles of the Declaration of Helsinki. A total volume of 8 mL of peripheral blood was collected from GC patients prior to surgery. Peripheral blood mononuclear cells were enriched by Ficol. The samples were immunostained with PI, CD45, EpCAM, FGFR2 (G100L‐Alexa 488), IgG1 isotype control, and CK, as described above.
2.5. Immunohistochemical determination of FGFR2
FGFR2 expression of resected specimens was assessed by immunohistochemical staining using the anti‐human FGFR2 (mFR2) for 60 minutes at room temperature. The percentage of FGFR2‐expressing cells at membrane or cytoplasm was evaluated, as previously reported by AL Paterson et al. 32 FGFR2 expression was categorized into four groups as follows: 0, no staining; 1+, cytoplasmic staining in 1%‐80% or membranous staining in 1%‐5%; 2+, cytoplasmic staining in 80%‐100% or membranous staining in 5%‐19%; 3+, membranous staining in 20%‐100%. The evaluation was done by two double‐blinded distinct observers without being aware of clinical data and outcome.
2.6. FISH of FGFR2
Randomly selected 28 cases were examined for FGFR2 gene amplification with FISH. The immunohistochemistry‐positive area of tumor paraffin‐embedded sections were subjected to FISH. Tumor sections were deparaffinized with the pretreatment reagent (Abbott Molecular Inc). After protease digestion procedures, FGFR2/CEN10p dual color FISH probes were hybridized at 75°C for 5 minutes and 37°C for 48 hours. FGFR2/CEN10p, both of which are located on chromosome 10, was defined as the ratio of the number of FGFR2 signals to the number of CEN10p signals, and FGFR2/CEN10p ≥2 was adopted as FGFR2 amplification. In each case, FGFR2 and CEN10p signals of 40 tumor cell nuclei were counted, and the average of FGFR2/CEN10p was obtained.
2.7. Statistical analysis
We used the chi‐squared test or Fisher's exact test to determine the significance of the difference between the covariates. A Kruskal‐Wallis test with post‐hoc comparison was used to compare differences between two independent groups. The survival durations were calculated using the Kaplan‐Meier method and analyzed by the log‐rank test. The Cox proportional hazards model was used to compute multivariate hazards ratios for the study parameters. In all of the tests, a P value <.05 was defined as statistically significant. Statistical analysis was performed using R for Mac OS X (version 3. 5. 2).
3. RESULTS
3.1. Determination of GC cells with FGFR2 expression in peripheral blood by spike test
The Western blot analysis revealed that KATO‐III cells and OCUM‐2MD3 cells expressed phosphorylated FGFR2, while MKN45 cells and NUGC4 cells did not (Figure 1A). When the cutoff value of FGFR2+ fluorescence was determined 1000 by IgG1 isotype control. FGFR2+ cells were not detected in the healthy volunteer's peripheral blood (Figure 1B). On the other hand, a total of 101 (40%) FGFR2+ cells were present in OCUM‐2MD3–spiked peripheral blood, and 177 (71%) cells were present in KATO‐III–spiked peripheral blood. In contrast, only four (2%) and nine (4%) FGFR2+ cells were detected in MKN45‐spiked and NUGC‐3–spiked peripheral blood, respectively (Figure 1C). The morphology of the FGFR2+ cells sorted by FACS in KATO‐III–spiked peripheral blood was similar to that of the cultured KATO‐III cells (Figure 1D), which suggested that FACS analysis might detect cancer cells with FGFR2 overexpression in peripheral blood. Expression of FGFR2 and FGFR2 gene amplification were found in OCUM‐2MD3 cells and KATO‐III cells, but not in MKN45 cells and NUGC cells sorted by FACS (Figure 1E).
Figure 1.
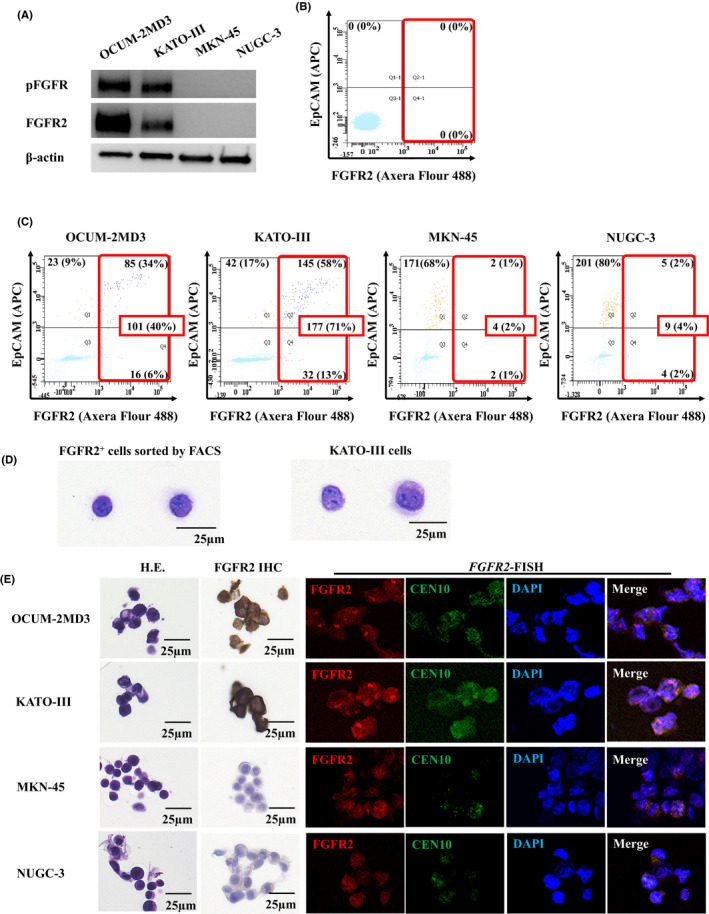
Fibroblast growth factor receptor2 (FGFR2) expression and determination of gastric cancer cells in peripheral blood. A, Western blot analysis of FGFR2/phospho‐FGFR (pFGFR) expression. KATO‐III cells and OCUM‐2MD3 cells expressed both FGFR2 and pFGFR2, but MKN45 cells and NUGC3 cells did not. B, Determination of FGFR2+ cells in peripheral blood of a healthy volunteer by flowcytometry. No FGFR2+ cell was detected when the cutoff value of FGFR2+ fluorescence was 1000. C, Detection of FGFR2+ gastric cancer cells in the peripheral blood of a healthy volunteer by flowcytometry. FGFR2+ cells of OCUM‐2MD3, KATO‐III, MKN45, and NUGC3 were detected (101 cells, 177 cells, 4 cells, and 9 cells of a total of 250 cells, respectively). D, H&E staining of FGFR2+ cells and cultured KATO‐III cells. The morphology of FGFR2+ cells sorted by FACScan is similar to that of cultured KATO‐III cells. E, FGFR2 immunostaining and FGFR2 FISH of cancer cell lines sorted by FACScan. FGFR2 expression and FGFR2 amplification were found in OCUM‐2MD3– or KATO‐III–spiked peripheral blood but not in MKN45– or NUGC–spiked peripheral blood
3.2. FACS analysis of peripheral blood of GC patients
Figure 2 shows the representative scattered graph of peripheral blood of a GC patient by FACS analysis. A total of eight FGFR2+cells were detected in peripheral blood by FACS, and two cells were EpCAM+CK+ in this case. In the 100 GC cases, FGFR2+ cells were detected in 50 (50%) cases (Table 1). Among these 50 cases with FGFR2+, EpCAM+ cells were detected only in two cases (data not shown).
Figure 2.
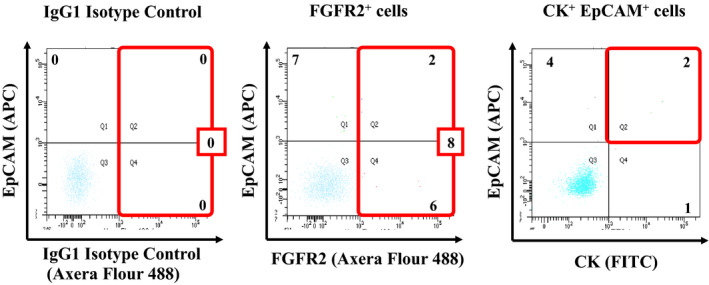
Representative scattered graphs of blood sample from a patient with gastric cancer. The cutoff value of fibroblast growth factor receptor2+ (FGFR2+) fluorescence was determined 1000 by IgG1 isotype control. Eight FGFR2+ cells were detected by FACS in a case. In the case, the number of EpCAM+CK+ cells was two. After the exclusion of propidium iodide–positive (PI‐positive) and CD45‐positive cells, FGFR2‐positive cells were defined as FGFR2+ cells, and EpCAM‐positive and cytokeratin‐positive (CK‐positive) cells were defined as EpCAM+CK+ cells
Table 1.
Relationship between the FGFR2+ circulating tumor cells (CTCs) and clinicopathologic features in 100 gastric cancer cases
| Number of FGFR2+ cells | P value | ||
|---|---|---|---|
| ≥5 cells/10 mL (n = 50) | <5 cells/10 mL (n = 50) | ||
| Age | |||
| ≤70 | 21 (42.0%) | 31 (62.0%) | .071 |
| >70 | 29 (58.0%) | 19 (38.0%) | |
| Gender | |||
| Female | 20 (40.0%) | 18 (36.0%) | .837 |
| Male | 30 (60.0%) | 32 (64.0%) | |
| Macroscopic type | |||
| Borrmann's type 4 | 0 (0.0%) | 6 (12.0%) | .15 |
| Other types | 50 (100%) | 44 (88.0%) | |
| Microscopic type | |||
| Differentiated | 27 (54.0%) | 27 (54.0%) | 1.00 |
| Undifferentiated | 23 (46.0%) | 23 (46.0%) | |
| Depth pf invasion | |||
| T1/ T2 | 26 (52.0%) | 31 (62.0%) | .419 |
| T3/ T4 | 24 (24.0%) | 19 (38.0%) | |
| Lymph node metastasis | |||
| N0 | 37 (74.0%) | 37 (74.0%) | 1.00 |
| N1/ N2/ N3 | 13 (26.0%) | 13 (26.0%) | |
| Lymphatic invasion | |||
| Negative | 27 (54.0%) | 31 (62.0%) | .544 |
| Positive | 23 (46.0%) | 19 (38.0%) | |
| Venous invasion | |||
| Negative | 32 (64.0%) | 37 (74.0%) | .387 |
| Positive | 18 (36.0%) | 13 (26.0%) | |
| Tumor size [median] | 25.7 [2.0‐40.0] | 20.0 [1.0‐33.5] | .525 |
| Stage | |||
| I and II | 36 (72.0%) | 36 (72.0%) | 1.000 |
| III and IV | 14 (28.0%) | 14 (28.0%) | |
| CEA [median] | 1.4 [0.5‐3.7] | 1.6 [0.5‐2.6] | .377 |
| CA19‐9 [median] | 1.0 [1.0‐22.0] | 1.0 [1.0‐11.8] | .232 |
Abbreviation: FGFR2+, fibroblast growth factor receptor 2+.
3.3. The correlation between FGFR2+ CTCs and the FGFR2 immunostaining in GC
Figure 3A shows representative FGFR2 immunostaining of primary gastric tumors which were taken by gastrectomy. FGFR2 immunostaining indicated that cancer cells overexpressed FGFR2 at either the cell membrane and/or the cytoplasm. The number of IHC‐0 cases, IHC‐1+ cases, IHC‐2+ cases, and IHC‐3+ cases was 39, 35, 17, and 9, respectively. The number of FGFR2+ CTCs in the 2 mL of blood from GC patients was 0.6 ± 1.2, 2.4 ± 4.2, 2.6 ± 2.9, and 8.3 ± 11.2 (mean ± SD) in the IHC‐0, IHC‐1+, IHC‐2+, and IHC‐3+ groups, respectively. The number of FGFR2+ CTCs increased in accordance with the FGFR2 IHC level. A significant difference was found between the IHC‐3+ group and the IHC‐0 group (P < .01), IHC‐1+ group (P < .01), and IHC‐2+ group (P < .01) by the Mann‐Whitney U‐test (Figure 3B).
Figure 3.
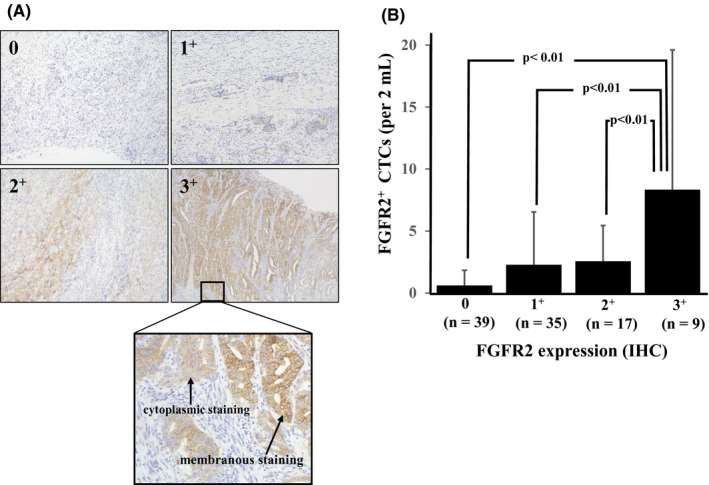
The association between fibroblast growth factor receptor2+ (FGFR2+) cells detected in peripheral blood and FGFR2 expression in primary gastric tumors. A, Representative pictures of FGFR2 immunostaining of primary gastric cancer. FGFR2 expression was categorized into four groups as 0, 1+, 2+, and 3+ in accordance with the membranous staining and cytoplasmic staining. B, Relationship between FGFR2+ circulating tumor cells (CTCs) and FGFR2 immunostaining level. The number of FGFR2+ CTCs in the peripheral blood of primary gastric cancer patients with high expression of FGFR2 was significantly greater than that of patients with low expression of FGFR2
3.4. The correlation between FGFR2+ CTCs and FGFR2 FISH in GC
Figure 4A provides representative pictures of the FGFR2 FISH analysis. The FGFR2/CEN10 ratio in the IHC‐0, IHC‐1+, IHC‐2+, and IHC‐3+ groups was 1.1 ± 0.1, 1.2 ± 0.2, 1.2 ± 0.3, and 2.1 ± 0.3 (mean ± SD), respectively. The FGFR2/CEN10 ratio significantly increased in accordance with the FGFR2 IHC level. (Figure 4B). There was significantly positive correlation between the number of FGFR2+ CTCs and the FGFR2/CEN10 ratio (r = .515; Spearman's rank correlation coefficient,P = .002; Figure 4C).
Figure 4.
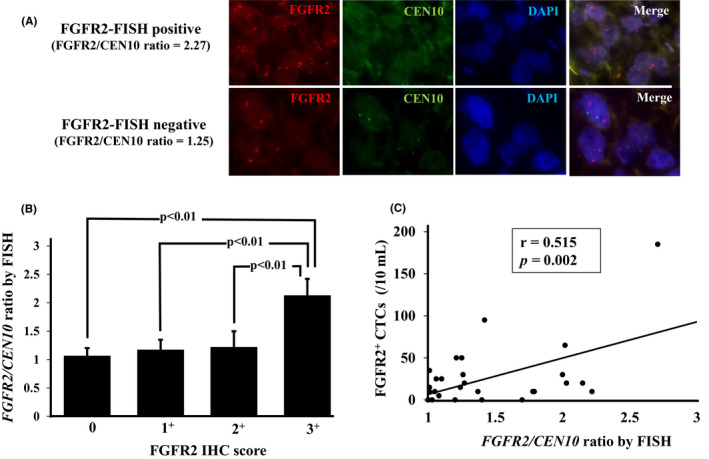
Correlation between fibroblast growth factor receptor2+ (FGFR2+) circulating tumor cells (CTCs) and FGFR2 FISH of gastric cancer patients. A, Representative picture of FGFR2 FISH. B, Correlation between immunohistochemistry (IHC) score and FGFR2 FISH. The FGFR2/CEN10 ratio was significantly correlated with the FGFR2 IHC score. C, Relationship between FGFR2+ CTCs by FACS and FGFR2 amplification by FISH. FGFR2+ CTCs were significantly correlated with the FGFR2/CEN10 ratio by Spearman's rank correlation test (r = .515, P = .002)
3.5. The correlation between FGFR2+ CTCs and CK+ EpCAM+ CTCs
The number of CK+EpCAM+ cells of the T3 and T4 cases was significantly greater (P < .001) than that of the T1 and T2 cases. The number of CK+EpCAM+ cells of the lymph node metastasis cases was significantly larger (P = .014) than that of the no–lymph node metastasis cases (Figure 5A). Spearman's rank correlation test indicated that FGFR2+ CTCs were not correlated with CK + EpCAM+CTCs (r = −.189, P = .060) (Figure 5B).
Figure 5.
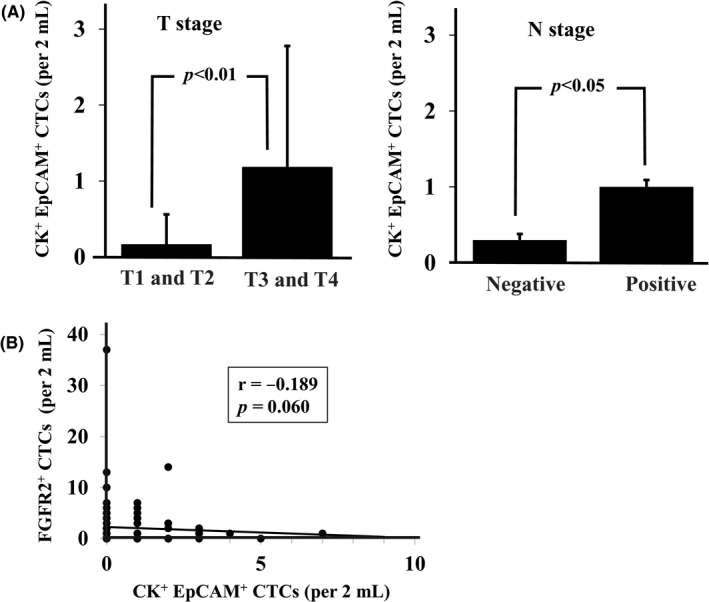
Correlation between cytokeratin+ (CK+)/EpCAM+ circulating tumor cells (CTCs) and T stage, N stage, or fibroblast growth factor receptor2+ (FGFR2+) CTCs. A, The number of CK+EpCAM+ cells was significantly larger (P = .014) in high T stage and lymph nodes metastasis. B, The number of CK+ EpCAM+ CTCs was not correlated with the number of FGFR2+ CTCs (Spearman's rank correlation test; r = −.189, P = .060)
3.6. The relationship between the FGFR2+ CTCs and clinicopathological features
The clinicopathological characteristics of all 100 patients according to their FGFR2+ CTC values are summarized in Table 1. The cutoff value for the number of FGFR2+ CTCs was determined as one cell per 2 mL peripheral blood based on the results of the receiver‐operating characteristics curve for relapse‐free survival (RFS) as the endpoint. Of all 100 patients enrolled in this study, the number of patients with one or more FGFR2‐positive CTCs was 50. There was no significant difference between the FGFR2+ CTC group and the FGFR2− CTC group.
3.7. Survival outcomes
Survival was analyzed for 89 patients (excluding the 11 pStage IV patients from the total of 100 patients). Among the 89 patients, recurrence‐free survival of patients with FGFR2+ cells ≥one cell per 2 mL was significantly poorer (P = .018, log‐rank test) than that of patients with no FGFR2+ cells (Figure 6A). On the other hand, there was no significant difference of RFS between patients with CK+EpCAM+ and those without CK+EpCAM+ (Figure 6B). The number of recurrence patients was significantly greater (Fisher, P = .026) in FGFR2‐positive CTCs cases (11 of 47 patients) than in FGFR2‐negative CTCs cases (3 of 42 patients). Table 2 summarizes the results of the univariate and multivariate analyses for RFS. The univariate analysis revealed that poor survival was significantly correlated with present FGFR2+ CTCs ≥5/10 mL (P = .029), macroscopic type 4 (P < .001), microscopic undifferentiated type (P = .017), high T stage (P = .003), and lymph node metastasis (P = .002). The multivariate analysis revealed that present FGFR2+ cells (P = .042), macroscopic type 4 (P = .003), and lymph node metastasis (P = .020) were independent prognostic factors.
Figure 6.
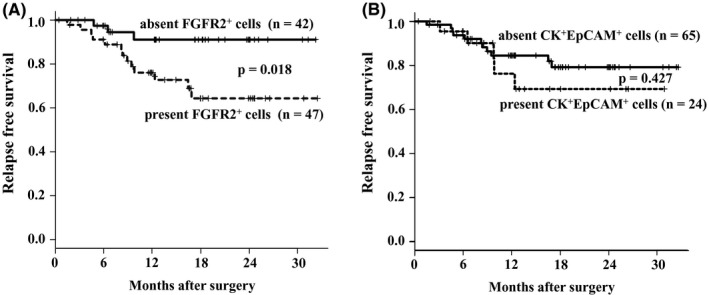
Relapse‐free survival of gastric cancer patients based on fibroblast growth factor receptor2+ (FGFR2+) circulating tumor cells (CTCs) and cytokeratin+ (CK+)/EpCAM+ CTCs. A, The Kaplan‐Meier survival curve indicates that the relapse‐free survival of patients with FGFR2+ CTCs was significantly (P < .001) poorer than that of the patients without FGFR2+ CTCs. B, No significant difference of the relapse‐free survival was found between CK+ EpCAM+ CTCs positive patients and CK+ EpCAM+ CTCs negative patients
Table 2.
Univariate and multivariate analysis for relapse‐free survival
| Univariate analysis | Multivariate analysis | |||
|---|---|---|---|---|
| Hazard ratio (95% CI) | p value | Hazard ratio (95% CI) | p value | |
| FGFR2+ cell ≥5 cells/10 mL | 4.07 (1.16‐14.3) | .029 | 4.87 (1.06‐22.4) | 0.042 |
| Age > 70 y‐old | 1.17 (0.44‐3.13) | .750 | ||
| Gender | ||||
| Female vs Male | 1.20 (0.45‐3.22) | .719 | ||
| Macroscopic type Borrmann's type 4 | 13.1 (1.57‐108.8) | .017 | 69.3 (4.13‐1164) | .003 |
| Microscopic type Undifferentiated type | 1.22 (0.45‐3.27) | .695 | ||
| Depth of invasion T3/4 vs T1/2 | 5.09 (1.76‐14.7) | .003 | 1.86 (0.55‐6.29) | .319 |
| Lymph node metastasis N1/2/3 vs N0 | 5.00 (1.74‐14.4) | .002 | 4.51 (1.26‐16.0) | .020 |
Abbreviation: CI, confidence interval; FGFR2+, fibroblast growth factor receptor2+.
4. DISCUSSION
The present results demonstrated that the existence of FGFR2+ CTCs in the peripheral blood of GC patients was significantly correlated with FGFR2 overexpression and FGFR2 gene amplification in gastric tumor. These findings suggest that the analysis of FGFR2+ CTCs is useful to identify patients who have an existing recurrent tumor with FGFR2 overexpression.
Several clinical trials using FGFR2‐selective inhibitors have been conducted. Some studies obtained positive results 18 or are ongoing, 3 while other studies obtained negative results. 12 , 13 One of the reasons for the negative results of clinical studies of FGFR2 inhibitors might be the tumor heterogeneity of FGFR2 expression between the resected specimen and the existing tumor. FGFR2+ CTCs might help detect the existing FGFR2‐overexpressing tumor. Our present findings indicate that FGFR2+ CTCs might be a promising predictive biomarker to overcome the issue of tumor heterogeneity of GC patients with FGFR2‐overexpressing tumors.
The determination of CK+EpCAM+ cells is a standard method for identifying CTCs in several types of cancer. 33 Although CK+EpCAM+ CTCs were detectable in peripheral blood, CK+EpCAM+ CTC was not associated with poor prognosis in this study. It has been reported that CK‐positive or EpCAM‐positive CTCs were not correlated with the prognosis of patients with a solid tumor including GC. 34 , 35 These findings suggest that CK+EpCAM+ CTCs might not have high malignant potential for GC patients. On the other hand, our results indicated that the prognosis of patients with FGFR2+ CTCs was significantly poorer than that of patients without FGFR2+ CTCs. There are two isotypes of the FGFR2: an FGFR2‐IIIb isotype, which is expressed mainly in epithelial cells, and an FGFR2‐IIIc isotype, which is expressed mainly in mesenchymal cells. 36 The switch from FGFR2‐IIIb to FGFR2‐IIIc by selective splicing is involved in the epithelial‐mesenchymal transition (EMT), an important process of metastasis and invasion. 37 , 38 In the present investigation, most of the FGFR2+ CTCs showed low EpCAM expression. Our FGFR2 antibody recognizes not only the FGFR2‐IIIb isotype but also the FGFR2‐IIIc isotype of cancer cells exhibiting the EMT. Most FGFR2+ CTCs might be EMT cancer cells with FGFR2‐IIIc expression, which might be one of the reasons for the finding that the number of FGFR2+ cells was not correlated with that of CK+EpCAM+ cells, and FGFR2+ CTCs can be used as a prognostic factor.
One of the limitations of this study is that the clustered CTCs were not evaluated because doublet cells were excluded in the FACS analysis. As it has been reported that the cluster formation of CTCs might promote metastasis, 39 in future it would be necessary to analyze the clinical significance of single CTCs versus CTC clusters. Another limitation is that postoperative CTCs were not evaluated in this study. The postoperative monitoring of FGFR2+ CTCs might be necessary to clarify whether FGFR2+ CTCs are useful to predict high‐risk patients for recurrence and to determine patients for the indication of FGFR2 inhibitors.
In conclusion, the determination of FGFR2+ CTCs might be useful to identify GC patients with existing tumor with FGFR2 overexpression. The presence of FGFR2+ CTCs might be a promising prognostic factor in GC patients.
DISCLOSURE
Masakazu Yashiro received research funding from Daiichi Sankyo Co., Ltd.
ACKNOWLEDGEMENTS
We thank Kokichi Honda (Daiichi Sankyo Co., Ltd.), Reimi Kawaida (Daiichi Sankyo Co., Ltd.), and Toshiaki Ohtsuka (Daiichi Sankyo Co., Ltd.) for providing human FGFR2‐IIIb antibody (mFR2‐10b) and human FGFR2‐IIIc antibody (mFR2‐28c) with helpful advice. This study is partially funded by KAKENHI (Grant‐in‐Aid for Scientific Research) Nos. 23390329 and 18H02883.
Kuroda K, Yashiro M, Miki Y, et al. Circulating tumor cells with FGFR2 expression might be useful to identify patients with existing FGFR2‐overexpressing tumor. Cancer Sci. 2020;111:4500–4509. 10.1111/cas.14654
REFERENCES
- 1. Torre LA, Bray F, Siegel RL, Ferlay J, Lortet‐Tieulent J, Jemal A. Global cancer statistics, 2012. CA Cancer J Clin. 2015;65:87‐108. [DOI] [PubMed] [Google Scholar]
- 2. Global Burden of Disease Cancer C , Fitzmaurice C, Allen C, et al. Global, regional, and national cancer incidence, mortality, years of life lost, years lived with disability, and disability‐adjusted life‐years for 32 cancer groups, 1990 to 2015: a systematic analysis for the global burden of disease study. JAMA Oncol. 2017;3:524‐548. [DOI] [PMC free article] [PubMed] [Google Scholar]
- 3. Catenacci DV, Tesfaye A, Tejani M, et al. Bemarituzumab with modified FOLFOX6 for advanced FGFR2‐positive gastroesophageal cancer: FIGHT Phase III study design. Future Oncol. 2019;15:2073‐2082. [DOI] [PubMed] [Google Scholar]
- 4. Bang YJ, Van Cutsem E, Feyereislova A, et al. Trastuzumab in combination with chemotherapy versus chemotherapy alone for treatment of HER2‐positive advanced gastric or gastro‐oesophageal junction cancer (ToGA): a phase 3, open‐label, randomised controlled trial. Lancet. 2010;376:687‐697. [DOI] [PubMed] [Google Scholar]
- 5. Fuchs CS, Tomasek J, Yong CJ, et al. Ramucirumab monotherapy for previously treated advanced gastric or gastro‐oesophageal junction adenocarcinoma (REGARD): an international, randomised, multicentre, placebo‐controlled, phase 3 trial. Lancet. 2014;383:31‐39. [DOI] [PubMed] [Google Scholar]
- 6. Wilke H, Muro K, Van Cutsem E, et al. Ramucirumab plus paclitaxel versus placebo plus paclitaxel in patients with previously treated advanced gastric or gastro‐oesophageal junction adenocarcinoma (RAINBOW): a double‐blind, randomised phase 3 trial. Lancet Oncol. 2014;15:1224‐1235. [DOI] [PubMed] [Google Scholar]
- 7. Yashiro M, Matsuoka T. Fibroblast growth factor receptor signaling as therapeutic targets in gastric cancer. World J Gastroenterol. 2016;22:2415‐2423. [DOI] [PMC free article] [PubMed] [Google Scholar]
- 8. Yashiro M, Shinto O, Nakamura K, et al. Synergistic antitumor effects of FGFR2 inhibitor with 5‐fluorouracil on scirrhous gastric carcinoma. Int J Cancer. 2010;126:1004‐1016. [DOI] [PubMed] [Google Scholar]
- 9. Cancer Genome Atlas Research N . Comprehensive molecular characterization of gastric adenocarcinoma. Nature. 2014;513:202‐209. [DOI] [PMC free article] [PubMed] [Google Scholar]
- 10. Cristescu R, Lee J, Nebozhyn M, et al. Molecular analysis of gastric cancer identifies subtypes associated with distinct clinical outcomes. Nat Med. 2015;21:449‐456. [DOI] [PubMed] [Google Scholar]
- 11. Hierro C, Alsina M, Sanchez M, Serra V, Rodon J, Tabernero J. Targeting the fibroblast growth factor receptor 2 in gastric cancer: promise or pitfall? Ann Oncol. 2017;28:1207‐1216. [DOI] [PubMed] [Google Scholar]
- 12. Van Cutsem E, Bang YJ, Mansoor W, et al. A randomized, open‐label study of the efficacy and safety of AZD4547 monotherapy versus paclitaxel for the treatment of advanced gastric adenocarcinoma with FGFR2 polysomy or gene amplification. Ann Oncol. 2017;28:1316‐1324. [DOI] [PubMed] [Google Scholar]
- 13. Nogova L, Sequist LV, Perez Garcia JM, et al. Evaluation of BGJ398, a fibroblast growth factor receptor 1–3 Kinase inhibitor, in patients with advanced solid tumors harboring genetic alterations in fibroblast growth factor receptors: results of a global phase I, dose‐escalation and dose‐expansion study. J Clin Oncol. 2017;35:157‐165. [DOI] [PMC free article] [PubMed] [Google Scholar]
- 14. Kalyukina M, Yosaatmadja Y, Middleditch MJ, Patterson AV, Smaill JB, Squire CJ. TAS‐120 cancer target binding: defining reactivity and revealing the first fibroblast growth factor receptor 1 (FGFR1) irreversible structure. ChemMedChem. 2019;14:494‐500. [DOI] [PubMed] [Google Scholar]
- 15. Watanabe Miyano S, Yamamoto Y, Kodama K, et al. E7090, a novel selective inhibitor of fibroblast growth factor receptors, displays potent antitumor activity and prolongs survival in preclinical models. Mol Cancer Ther. 2016;15:2630‐2639. [DOI] [PubMed] [Google Scholar]
- 16. Zhao G, Li WY, Chen D, et al. A novel, selective inhibitor of fibroblast growth factor receptors that shows a potent broad spectrum of antitumor activity in several tumor xenograft models. Mol Cancer Ther. 2011;10:2200‐2210. [DOI] [PubMed] [Google Scholar]
- 17. Collin MP, Lobell M, Hubsch W, et al. Discovery of rogaratinib (BAY 1163877): a pan‐FGFR inhibitor. ChemMedChem. 2018;13:437‐445. [DOI] [PubMed] [Google Scholar]
- 18. Bendell JC, Rogers S, Xiang H, et al. FPA144‐001: A first in human study of FPA 144, an ADCC‐enhanced, FGFR2b isoform‐selective monoclonal antibody in patients with advanced solid tumors. J Clin Oncol. 2016;34:140. [Google Scholar]
- 19. Gonzalez de Castro D, Angulo B, Gomez B, et al. A comparison of three methods for detecting KRAS mutations in formalin‐fixed colorectal cancer specimens. Br J Cancer. 2012;107:345‐351. [DOI] [PMC free article] [PubMed] [Google Scholar]
- 20. Fehm T, Muller V, Aktas B, et al. HER2 status of circulating tumor cells in patients with metastatic breast cancer: a prospective, multicenter trial. Breast Cancer Res Treat. 2010;124:403‐412. [DOI] [PubMed] [Google Scholar]
- 21. Simmons C, Miller N, Geddie W, et al. Does confirmatory tumor biopsy alter the management of breast cancer patients with distant metastases? Ann Oncol. 2009;20:1499‐1504. [DOI] [PMC free article] [PubMed] [Google Scholar]
- 22. Okuno T, Yashiro M, Masuda G, et al. Establishment of a New Scirrhous gastric cancer cell line with FGFR2 overexpression, OCUM‐14. Ann Surg Oncol. 2019;26:1093‐1102. [DOI] [PubMed] [Google Scholar]
- 23. Lim B, Kim JH, Kim M, Kim SY. Genomic and epigenomic heterogeneity in molecular subtypes of gastric cancer. World J Gastroenterol. 2016;22:1190‐1201. [DOI] [PMC free article] [PubMed] [Google Scholar]
- 24. Lawrence MS, Stojanov P, Polak P, et al. Mutational heterogeneity in cancer and the search for new cancer‐associated genes. Nature. 2013;499:214‐218. [DOI] [PMC free article] [PubMed] [Google Scholar]
- 25. Matsusaka S, Suenaga M, Mishima Y, et al. Circulating tumor cells as a surrogate marker for determining response to chemotherapy in Japanese patients with metastatic colorectal cancer. Cancer Sci. 2011;102:1188‐1192. [DOI] [PubMed] [Google Scholar]
- 26. Matsusaka S, Chin K, Ogura M, et al. Circulating tumor cells as a surrogate marker for determining response to chemotherapy in patients with advanced gastric cancer. Cancer Sci. 2010;101:1067‐1071. [DOI] [PMC free article] [PubMed] [Google Scholar]
- 27. Mishima Y, Matsusaka S, Chin K, et al. Detection of HER2 amplification in circulating tumor cells of HER2‐negative gastric cancer patients. Target Oncol. 2017;12:341‐351. [DOI] [PubMed] [Google Scholar]
- 28. Liu Y, Liu Q, Wang T, et al. Circulating tumor cells in HER2‐positive metastatic breast cancer patients: a valuable prognostic and predictive biomarker. BMC Cancer. 2013;13:202. [DOI] [PMC free article] [PubMed] [Google Scholar]
- 29. Hayes DF, Walker TM, Singh B, et al. Monitoring expression of HER‐2 on circulating epithelial cells in patients with advanced breast cancer. Int J Oncol. 2002;21:1111‐1117. [DOI] [PubMed] [Google Scholar]
- 30. Yashiro M, Chung YS, Nishimura S, Inoue T, Sowa M. Peritoneal metastatic model for human scirrhous gastric carcinoma in nude mice. Clin Exp Metastasis. 1996;14:43‐54. [DOI] [PubMed] [Google Scholar]
- 31. Japanese Gastric Cancer Association . Japanese classification of gastric carcinoma: 3rd English edition. Gastric Cancer. 2011;14:101‐112. [DOI] [PubMed] [Google Scholar]
- 32. Paterson AL, O'Donovan M, Provenzano E, et al. Characterization of the timing and prevalence of receptor tyrosine kinase expression changes in oesophageal carcinogenesis. J Pathol. 2013;230:118‐128. [DOI] [PubMed] [Google Scholar]
- 33. de Wit S, van Dalum G, Lenferink AT, et al. The detection of EpCAM(+) and EpCAM(‐) circulating tumor cells. Sci Rep. 2015;5:12270. [DOI] [PMC free article] [PubMed] [Google Scholar]
- 34. Arigami T, Uenosono Y, Yanagita S, et al. Clinical significance of circulating tumor cells in blood from patients with gastric cancer. Ann Gastroenterol Surg. 2017;1:60‐68. [DOI] [PMC free article] [PubMed] [Google Scholar]
- 35. Sun T, Zou K, Yuan Z, Yang C, Lin X, Xiong B. Clinicopathological and prognostic significance of circulating tumor cells in patients with head and neck cancer: a meta‐analysis. Onco Targets Ther. 2017;10:3907‐3916. [DOI] [PMC free article] [PubMed] [Google Scholar]
- 36. Katoh M. FGFR2 abnormalities underlie a spectrum of bone, skin, and cancer pathologies. J Invest Dermatol. 2009;129:1861‐1867. [DOI] [PubMed] [Google Scholar]
- 37. Wu G, Li Z, Jiang P, et al. MicroRNA‐23a promotes pancreatic cancer metastasis by targeting epithelial splicing regulator protein 1. Oncotarget. 2017;8:82854‐82871. [DOI] [PMC free article] [PubMed] [Google Scholar]
- 38. Warzecha CC, Sato TK, Nabet B, Hogenesch JB, Carstens RP. ESRP1 and ESRP2 are epithelial cell‐type‐specific regulators of FGFR2 splicing. Mol Cell. 2009;33:591‐601. [DOI] [PMC free article] [PubMed] [Google Scholar]
- 39. Aceto N, Bardia A, Miyamoto DT, et al. Circulating tumor cell clusters are oligoclonal precursors of breast cancer metastasis. Cell. 2014;158:1110‐1122. [DOI] [PMC free article] [PubMed] [Google Scholar]


