

Abstract
Our laboratory previously reported the usefulness as biomarkers of exosomes in the plasma of esophageal squamous cell carcinoma (ESCC) patients. However, the influence of tumor‐derived exosomes on the tumor itself and underlying mechanisms remain unclear. We here report changes in the phenotype and gene expression when cancer cells exist in an environment with tumor‐derived exosomes. The exosomes were isolated from the culture medium of human ESCC cells (TE2, T.Tn) by ultracentrifugation; cell proliferation assay, wound‐healing assay, and fluorescence imaging of the cell cycle were performed to clarify the phenotypic changes in the high concentration of tumor‐derived exosomes. Gene expression changes were also assessed by mRNA microarray, and the data were analyzed by gene set enrichment analysis (GSEA). The data revealed that the proliferation of both TE2 and T.Tn was inhibited, and cell migration ability was upregulated in the exosome exposure group (P < .05). Fluorescence imaging using a fluorescent ubiquitination‐based cell cycle indicator expressing ESCC cells revealed that the ratio of G1‐phase cells was significantly increased in the exosome exposure group (P < .05). Findings of the GSEA clarified that high‐density exposure of cancer‐derived exosomes to their parent cancer cells downregulated the expression of genes related to cell proliferation and cell cycle, and upregulated the expression of genes related to actin filament length and extracellular structure organization. In conclusion, an environment of high‐density tumor‐derived exosomes induces changes in the gene expression and phenotype of tumor cells and may lead to tumor progression or malignant transformation.
Keywords: cell cycle, esophageal squamous cell carcinoma, exosome, fucci, gene expression, migration
The wound closure rate was compared between groups with or without cancer‐derived exosome exposure. There was a significant difference between 10 μg/mL exosome concentration and control at 12 and 24 h in both TE2 and T.Tn (P < .05).
1. INTRODUCTION
Esophageal cancer is the sixth leading cause of cancer death worldwide, and its incidence is increasing more rapidly than that of other gastrointestinal malignancies. In 2018, an estimated 572 000 new cases were diagnosed, with 509 000 deaths occurring worldwide due to the disease. One of the major histologic subtypes of esophageal cancer is esophageal squamous cell carcinoma (ESCC), which is by far more common in eastern Asia and parts of Africa than in other areas. 1 , 2
Despite advances in diagnosis and treatment, the prognosis of patients with ESCC remains poor. Lymph node metastasis is one of the most important prognostic factors in ESCC, with an increasing number of metastatic lymph nodes being associated with a progressively poorer prognosis. To improve the poor prognosis, there is a need to clarify the mechanism underlying cancer progression, especially cancer cell migration and invasion.
Exosomes are membrane‐bound extracellular vesicles (EVs) secreted from most cell types. Our laboratory previously reported the usefulness as biomarkers of exosome quantification or exosomal miR‐1246 in the peripheral blood of ESCC patients. 3 , 4 Exosomes are useful as biomarkers, and those derived from tumors are intimately involved in the modulation of biological activities of their recipient cells via transfer of their oncogenic content (eg microRNA, protein). In the ESCC field, some reports have suggested that tumor‐derived exosomes can influence the efficacy of treatment (chemoresistance, radiosensitivity). 5 , 6 Furthermore, circulating exosomes from ESCC influence the immune system. 7 Many papers have focused on single or specific content and pathway, therefore the actual effects that tumor‐derived exosome can induce remain uncertain due to confounding factors.
Using an in vitro study and bioinformatics analysis. we here report the gene expression changes observed in cancer cells when in an environment containing a high concentration of cancer‐derived exosomes.
2. MATERIALS AND METHODS
2.1. Cell culture
TE1, TE2, TE4, TE5, TE6, TE8, TE10, TE11, TE15, and T.Tn human ESCC cell lines were used in this study. TE cell lines were obtained from Cell Resource Center for Biomedical Research Institute of Development, Aging, and Cancer, Tohoku University. The T.Tn cell line was obtained from the Japanese Cancer Research Resources Bank. All cells were cultured in Dulbecco's modified Eagle's medium (DMEM; Thermo Fisher Scientific) supplemented with 10% fetal bovine serum (FBS), 100 units/mL penicillin G sodium and 100 μg/mL streptomycin in a humidified atmosphere containing 5% CO2 in air at 37°C.
2.2. Fluorescent ubiquitination‐based cell cycle indicator (Fucci)‐expressing ESCC cell line
To visualize the cell cycle, a Fucci‐expressing ESCC cell line was established. First, Fucci‐S/G2/M Green vector (AM‐V9010M; MBL Life Science) was transfected into TE2 cells. Plasmid (500 ng) was then transfected into 2 × 10⁵ cells using 1 μg Lipofectamine 2000 (Thermo Fisher Scientific) and 500 μL of Abs‐free medium.
At 3 d after transfection, the cells were treated with hygromycin‐containing medium for selection. The selected cells were seeded and cloned by limiting dilution. The colony derived from a single stable cell was selected.
Next, Fucci‐G1 Orange vector (AM‐V9003M; MBL Life Science) was transfected into Fucci‐S/G2/M‐expressing TE2 cells, as above, and cells were treated with neomycin and selected in a similar manner.
2.3. Exosome isolation
Tumor‐derived exosomes were isolated and purified from TE2 or T.Tn culture medium by ultracentrifugation. Each cell line was seeded onto 10 cm dishes at a concentration of 1 × 10⁶ cells/dish containing DMEM with 10% of exosome‐free FBS (System Biosciences). After a 48‐h incubation, conditioned medium was harvested for exosome extraction. (Figure S1A).
Collected medium was centrifuged at 2000 g for 30 min at 4°C to remove cells and debris. Then, the supernatants were passed through a 0.22‐μm filter (Sigma Aldrich). The filtrates were ultracentrifuged at 100 000 g for 90 min at 4°C to collect the exosomes and using an Optima TLX ultracentrifuge (Beckman Coulter). The pellets, at the bottom of the tubes, were washed in phosphate‐buffered saline (PBS) and were further ultracentrifuged similarly as above. Finally, the exosomes were washed with PBS and collected by ultracentrifugation again at 100 000 g for 90 min at 4°C. The total protein concentration in purified exosomes was measured using a NanoDrop spectrometer (Thermo Fisher Scientific) and the isolated exosomes were used for further analysis.
To evaluate the exosome‐releasing capacity of ESCC cell lines (TE1, −2, −4, −5, −6, −8, −10, −11, −15 and T.Tn), exosomes were isolated from culture medium using an isolation reagent (Total Exosome Isolation kit [from culture media]; Thermo Fisher Scientific) according to the manufacturer's protocol. Each exosome preparation obtained from culture media was quantified according to acetylcholinesterase (AChE) activity (EXOCET Exosome Quantification Kit; System Biosciences). Quantification was performed according to the manufacturer's protocol.
2.4. Confirming the isolation of tumor‐derived exosomes
The existence of isolated exosomes by ultracentrifugation was confirmed by electron microscopy and western blotting. The exosome samples were absorbed to formvar film‐coated copper grids (400 mesh) and were stained with 2% phosphotungstic acid solution (pH 7.0) for 30 s. The samples were observed by a transmission electron microscopy (TEM) (JEM‐1400Plus; JEOL Ltd.) at an acceleration voltage of 80 kV. Digital images were captured using a charge coupled device (CCD) camera (Veleta; Olympus Soft Imaging Solutions GmbH).
Expression of CD9, CD63, CD81, and calnexin in the TE2 cells and exosomes were confirmed by western blot analysis. For exosomal protein analysis, isolated exosomes were diluted in exosome lysis buffer (System Biosciences) and then assessed. Anti‐human CD9 rabbit monoclonal IgG (1:1000; Cell Signaling Technology; cat. no. 13403), anti‐human CD63 mouse monoclonal IgG (BD Biosciences; cat. no. 556019), anti‐human CD81 mouse monoclonal IgG (1:1000, EXBIO; cat. no. 11‐558‐C100), and anti‐human calnexin rabbit polyclonal IgG (1:1000; Abcam; cat. no. ab22585) were used as primary antibodies.
2.5. Imaging exosome transfer between cells to the other cells
Exosomes isolated from TE2 or T.Tn culture medium were stained with green fluorescence using PKH67 (Sigma Aldrich) according to the manufacturer's protocol. Briefly, exosomes were labeled with 2.5 μmol/L of PKH67 dye in 400 μL of diluent C for 5 min, then blocked via addition of exosome‐free FBS, after which exosomes were washed with PBS by ultracentrifugation at 100 000 g, for 90 min, 4°C. Stained exosomes, isolated from TE2 or T.Tn cells, or unstained exosomes were then added to cells from each of the original cells (which had been pre‐incubated for 24 h) at a density of 10 μg/mL. After 12, 24, and 48 h of incubation, fluorescence images were obtained and analyzed. The fluorescent and bright‐field images of the treated cells were acquired using an Axio Observer Z1 microscope and an AxioCam MRm camera (Carl Zeiss).
2.6. The cell proliferation assay
Exosomes were collected from TE2 or T.Tn culture medium and quantified as above. TE2 or T.Tn cells were then seeded into 96‐well plates at 5 × 10³ cells/well in 100 μL containing 10% exosome‐free FBS. At 24 h after seeding, the isolated exosomes were added at 10 μg/mL. After 24, 48, and 72 h of culture, the cells were counted using a Cell Counting Kit‐8 (Dojindo; Figure 2A).
FIGURE 2.
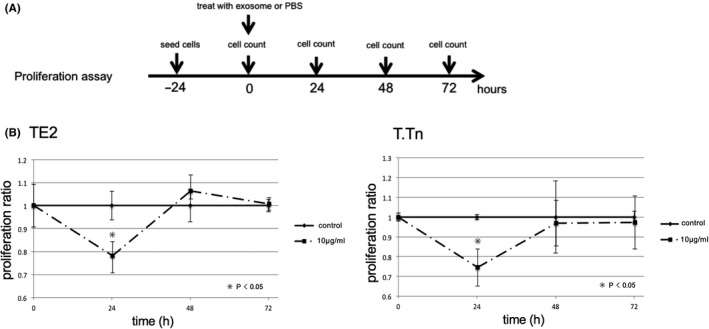
A, Protocol and time course for cell proliferation assay. Twenty‐four h after cell seeding, cells were exposed with exosome (10 μg/mL) or PBS. After 24, 48, 72 h culture, cell number were counted by Cell Counting Kit‐8. B, The cell proliferation index normalized by PBS control after 24, 48 and 72 h culture (left: TE2; right: T.Tn). The cell proliferation was inhibited by exosome exposure both TE2 and T.Tn in 24 h culture (P < .05)
2.7. The wound‐healing assay
The cell migration capacities were assessed using a wound‐healing assay. TE2 and T.Tn cells were grown in 96‐well plates to 70%‐80% confluence as a monolayer. The monolayer was then scratched with a fresh 10‐μL pipette tip, and exosome‐containing medium was added (1 or 10 μg/mL) or PBS. After 12 and 24 h of culture, wound photographs were taken, and wound closure rates were calculated using ImageJ software (NIH; Figure 3A).
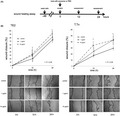
FIGURE 3.

A, Protocol and time course for wound‐healing assay. Forty‐eight h after cell seeding, cells were scratched with a 10‐μL pipette, and cells were exposed with exosome (1, 10 μg/mL) or PBS at the same time. After 12 or 24 h culture, wound closure rate was assessed. B, The results of wound‐healing assay. (left: TE2, right:T.Tn). The wound closure rate after 12 and 24 h of incubation were shown in the above. There was a significant difference between 10 μg/mL exosome concentration and control at 12 and 24 h both TE2 and T.Tn (P < .05). Representative images were shown below the graph
2.8. Time series imaging for cell cycle analyses
TE2‐Fucci, as established above, were used for cell cycle imaging. The cells were seeded onto 6‐well plates at 2 × 10⁵ cells/well. At 24 h after seeding, 10 μg/mL of exosomes was added to the treatment group, while the same amount of PBS was added to another group. At treatment, as well as 12 and 24 h after treatment, the cells were imaged by orange (G1) or green (S/G2/M) fluorescence.
2.9. The gene expression analysis
Following treatment of TE2 and T.Tn cells with exosomes (10 μg/mL) or PBS and incubation for 24 h, total RNA was extracted using the RNeasy Plus Mini Kit (QIAGEN). Microarrays were performed using a SurePrint G3 Human GE microarray v.3.0 (Agilent) according to the operation procedures. The results of the microarrays were further analyzed using gene set enrichment analysis (GSEA), with the gene set from the Molecular Signatures Database v.6.0. The software program estimated the statistical significance (nominal P‐value) of the enrichment score, which reflected the degree to which a gene set is overrepresented at the extremes of the entire ranked list of microarray data.
2.10. Statistical analysis
All numeric values were expressed as the average ± SD. Differences in the relationships between the 2 groups were assessed by Student t test. Statistical significance was considered to exist at P‐values <.05. All data were statistically analyzed using JMP v.13 software (SAS institute Inc).
3. RESULTS
3.1. Exosome release varied among human ESCC cell lines
For each ESCC cell line, exosomes were extracted from 1 mL of culture medium using an exosome isolation kit. The quantity of extracted exosomes was determined using an EXOCET quantification assay. TE1, TE2, TE4, TE5, TE8, and T.Tn cells showed high exosome release, while TE6, TE10, TE11, and TE15 cells showed low exosome release. (Figure S1B).
3.2. Ultracentrifuge method for exosome isolation
Exosomes were isolated from the culture medium of TE2 and T.Tn cells by ultracentrifugation. The exosomes were imaged by electron microscopy as previously reported. 3 Small round particles, approximately 50 nm in diameter, were recognized as both TE2 and T.Tn exosomes (Figure S1D). Furthermore, the presence of CD9, CD63, and CD81, common markers for exosomes, and the absence of calnexin, a major marker of the endosome, were confirmed by western blot analysis of the exosomes or of cell protein isolated from TE2 cells (Figure S1C).
3.3. Exosomes can be transferred between cancer cells
After 24 h of culture of stained exosomes with the original cells (TE2/T.Tn), bright‐field and fluorescence images were obtained. Green fluorescent foci were observed in cells only from the groups to which stained exosomes had been added (Figure 1A). Time course fluorescence imaging showed that the green fluorescent foci appeared within 24 h in both TE2 and T.Tn cells. Notably, the foci appeared within 12 h in T.Tn cells (Figure 1B). This result indicated that tumor cell‐derived exosomes could be transferred between cancer cells to other cells.
FIGURE 1.
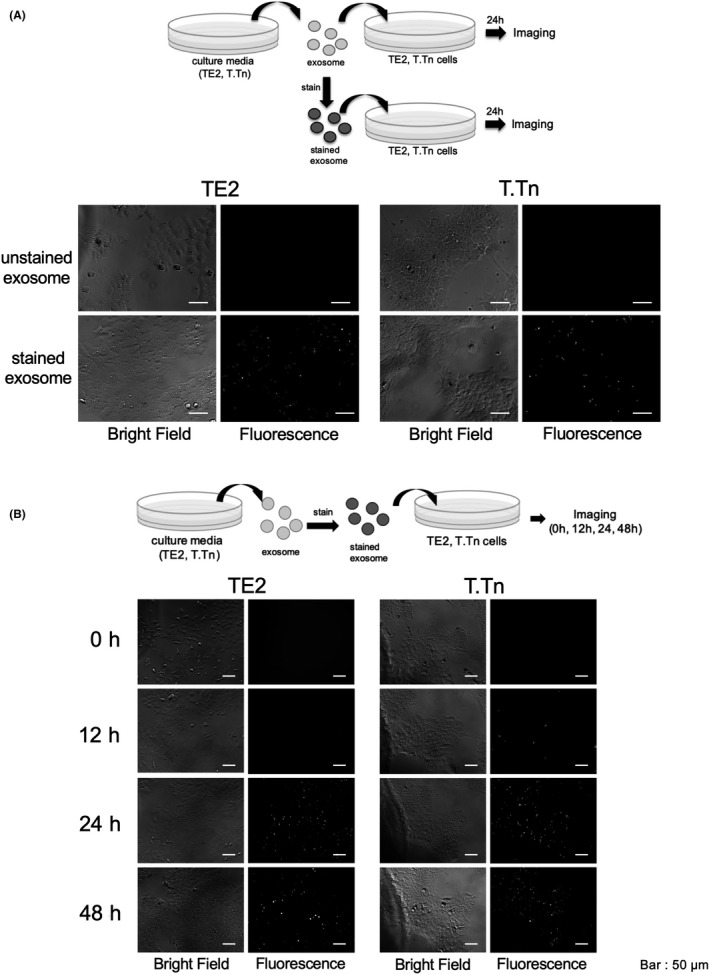
A, Representative images after 24 h of incubation (left: bright‐field, right: fluorescence). GFP‐positive foci were confirmed only in the groups with a stained exosome. B, Time course images of cultured cells with fluorescence‐stained exosomes. Green fluorescent foci appeared within 12 h in T.Tn cells, and not later than 24 h in TE2 cells
3.4. Cancer‐derived exosomes can inhibit cancer cell proliferation but stimulate cell migration
Cell number was compared between the exosome exposure group and the control group. For the TE2 cells, the proliferation index (exosome‐treated group/control group) was 0.78 ± 0.09 at 24 h, 1.06 ± 0.04 at 48 h, and 1.01 ± 0.03 at 72 h, and for the T.Tn cells, the index was 0.75 ± 0.09 at 24 h, 0.97 ± 0.12 at 48 h, and 0.97 ± 0.14 at 72 h. The proliferation of both TE2 and T.Tn was inhibited at 24 h in the exosome‐treated group (P < .05), whereas at 48 and 72 h there were no marked differences between the TE2 and T.Tn cells, regardless of exosome exposure (Figure 2B).
The wound closure rate was compared between the groups with and without cancer‐derived exosome exposure. For the TE2 cells, the respective wound closure rates at 12 and 24 h after incubation were 20.1% ± 8.5% and 74.9% ± 16.4% in the control group, 30.1% ± 18.9% and 82.1% ± 16.2% at 1 μg/mL, and 32.4% ± 7.5% and 91.6% ± 6.0% at 10 μg/mL. There were marked differences between 1 and 10 μg/mL and the control group at 12 h and also between 10 μg/mL and the control group at 24 h (P < .05). For the T.Tn cells, the respective wound closure rates at 12 and 24 h after incubation were 17.3% ± 2.5% and 29.4% ± 3.2% in the control group, 24.5% ± 6.4% and 43.2% ± 8.3% at 1 μg/mL, and 34.1% ± 7.0% and 42.7% ± 7.0% at 10 μg/mL. There were differences between 10 μg/mL and the control group at 12 and 24 h (P < .05; Figure 3B).
Taken together, these results indicated that exosome treatment could upregulate the migration ability of cancer cells.
3.5. A high density of tumor‐derived exosome can increase the G1 cell cycle proportion
Fucci‐expressing TE2 (TE2‐Fucci) cells were established as above and seeded with DMEM. Gemini‐Green was mainly expressed in the logarithmic growth phase (Figure 4A), and Cdt1‐Orange was expressed in the confluent state (Figure 4B).
FIGURE 4.
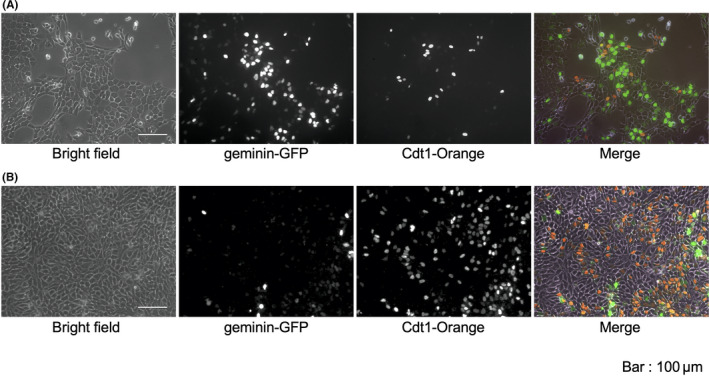
Representative live cell fluorescence imaging of Fucci‐expressing cell line (TE2‐Fucci). A, Logarithmic growth phase. B, Confluent state. Bars, 100 μm
The numbers of G1‐phase cells (orange) and S/G2/M‐phase cells (green) were assessed after 0, 12, and 24 h of culture with or without treatment with a high density of cancer‐derived exosomes (10 μg/mL; Figure 5A,B). The percentages of G1 cells in the control group were 1.12% ± 0.87% at 0 h, 3.66% ± 1.12% at 12 h, and 7.44% ± 0.42% at 24 h. In contrast, these percentages in the exosome‐treated group were 1.16% ± 0.84% at 0 h, 15.0% ± 3.34% at 12 h, and 20.3% ± 4.20% at 24 h. There were significant differences in the ratio of G1 cells between the exosome‐treated and control groups at 12 and 24 h (P < .05; Figure 5C).
FIGURE 5.
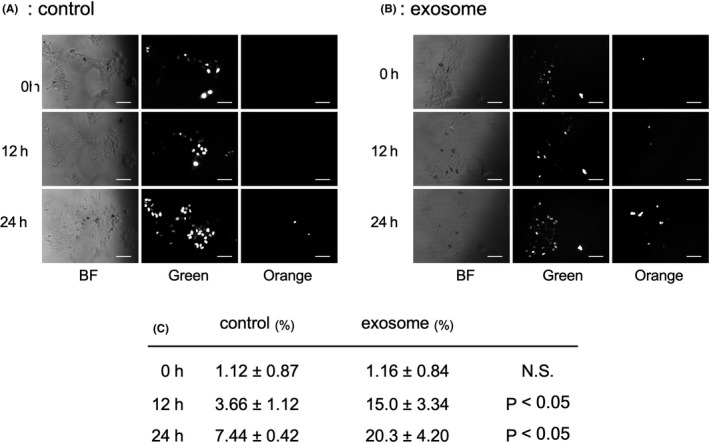
Time series of fluorescence imaging of TE2‐Fucci with or without exosome exposure. A, B, Representative images of TE2‐Fucci after 0, 12 and 24 h culture. Bars, 50 μm. C, The percentage of G1 phase cells were significantly increased by exosome exposure in 12 and 24 h culture (P < .05)
This result indicated that a high density of cancer‐derived exosomes reduced the G1‐ to S‐phase transition.
3.6. Tumor‐derived exosomes influence the gene expression of cancer cells
The mRNA microarray analysis for TE2/T.Tn cells with or without exosome exposure was performed as described above. The obtained mRNA microarray data were analyzed by GSEA for gene ontology (GO) analysis. GSEA detected the common upregulated or downregulated genes between TE2 and T.Tn cells with or without exosome exposure (Figure S2). GO analysis revealed the existence of several gene categories enriched in the control group (eg downregulated by exosome exposure), including categories of DNA repair, DNA recombination, DNA replication, and cell cycle (include mitotic cell cycle and G1/S‐phase transition; Figure 6A). In contrast, the exosome exposure group showed enrichment in the GO categories of actin binding, actin filament length (Figure 6B), extracellular structure organization, positive regulation of mitogen‐activated protein kinase (MAPK) cascade, and signal transducers and activators of transcription (STAT) cascade, among others (Table 1).
FIGURE 6.
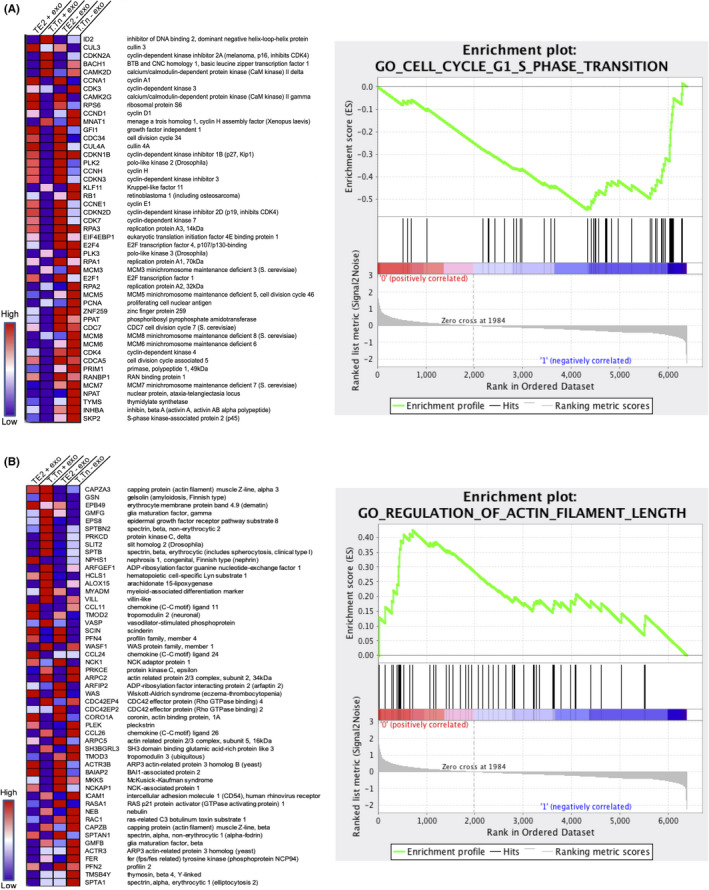
Heat map and enrichment graph of the gene expressions. A, Gene ontology for G1/S‐phase transition. B, Gene ontology for regulation of actin filament length
TABLE 1.
Gene ontology categories enriched in the groups with or without exosome exposure
| Category of gene ontology | Number of genes | Nominal P‐value |
|---|---|---|
| Enriched in exosome (−) | ||
| DNA_REPAIR | 164 | <.001 |
| DNA_RECOMBINATION | 69 | <.001 |
| DNA_REPLICATION | 65 | <.001 |
| CELL_CYCLE | 434 | <.001 |
| MITOTIC_CELL_CYCLE | 262 | <.001 |
| CELL_CYCLE_G1_S_PHASE_TRANSITION | 47 | <.001 |
| Enriched in exosome (+) | ||
| ACTIN_BINDING | 131 | <.001 |
| REGULATION_OF_ACTIN_FILAMENT_LENGTH | 51 | .008 |
| EXTRACELLULAR_STRUCTURE_ORGANIZATION | 131 | <.001 |
| POSITIVE_REGULATION_OF_MAPK_CASCADE | 163 | .008 |
| STAT_CASCADE | 20 | .007 |
These findings were consistent with the phenotypes obtained by the cell proliferation assay, cell migration assay, and cell cycle imaging.
4. DISCUSSION
Exosomes are EVs of 30‐100 nm in diameter. In the field of cancer research, exosomes are reportedly useful not only as biomarkers (ie for liquid biopsies) but also as signal transporters. Our laboratory previously reported that tumor‐derived exosomes could be released by tumors into the peripheral blood, so quantification of plasma exosomes can help predict the prognosis of patients with ESCC. 3 In addition, tumor‐derived microRNA‐1246 was transferred to lymph nodes near the tumor via exosomes. 4
Some reports have indicated that cancer‐derived exosomes are involved in tumor progression or the microenvironment (eg organotropic metastasis, 8 dissemination, 9 angiogenesis, 10 dormancy, 11 or immune evasion 12 ). However, few studies have analyzed the changes in cancer cells when cancer‐derived exosomes are added. In the present study, we revealed the effects of cancer‐derived exosomes on ESCC cancer cells. The results indicated that cancer‐derived exosomes could be taken up by cells and change their gene expression and phenotype, resulting in the cell tendency to halt the cell cycle and accelerate migration.
In the present study, ultracentrifugation was used to isolate tumor‐derived exosomes, as this method is standard for this approach; if exosomes has been isolated with reagents, these could have influenced our findings to some extent. The isolated exosomes were confirmed by TEM and western blotting, as previously reported. Regarding the density of exosome treatment, many reports have described treatment at a protein density of 1‐100 μg/mL. In our study, a concentration of 10 μg/mL of exosomes was used for treatment, which was approximately 1000 times the density of that found in the culture medium used for exosome isolation.
In this study, the interaction of tumor‐derived exosomes among cells was visualized using fluorescence imaging. We previously reported the establishment of a GFP‐tagged CD63‐expressing ESCC cell line (TE2‐CD63‐GFP); 3 images obtained in the present study were similar to those with CD63‐GFP, indicating that fluorescent‐tagged exosomes could be taken up by their mother cells. Recent studies have suggested that tumor‐derived exosomes can also be used as a therapeutic tool, as exosomes derived from cancer cells fuse preferentially with their parent cancer cells and can be used as a carrier of anticancer drugs. 13 Our results are consistent with these previous reports.
To overcome ESCC, regulation of metastasis to the lymph nodes or distant organs is key, a goal that is deeply associated with epithelial‐mesenchymal transition (EMT). We therefore focused mainly on the migration ability in our in vitro study. For cell proliferation and migration abilities, results of the cell proliferation assay and wound‐healing assay indicated that tumor‐derived exosomes could inhibit cell proliferation and upregulate cell migration within 24 h after addition of exosomes. Although the wound‐healing assay was influenced by cell proliferation, results of the proliferation assay excluded any influence of cell proliferation on wound closure. As time progressed (eg 48 and 72 h after treatment), differences in cell proliferation between the groups with and without exosome treatment began to disappear. This finding suggested that cancer cells continued to excrete exosomes into the medium, such that the exosome density in the control group became high, resulting in a similar density to that in the group with added exosomes. We may also infer that the added exosomes were taken up by cancer cells immediately.
Expression levels of genes related to DNA repair, DNA recombination, DNA replication, and the cell cycle were downregulated by exosome treatment, and matched the phenotypic changes. There were some differences in the degree or dynamics of the gene expression changes between TE2 and T.Tn cells, especially in relation to the cell cycle. The exosome‐releasing capacity of TE2 cells was higher than that of T.Tn cells, therefore the addition of equal numbers of exosomes may strongly affect T.Tn cells. Another possible reason was the timing of exosome uptake. The exosome uptake assay suggested that uptake of exosomes by T.Tn cells was faster than that by TE2 cells.
For cell migration ability, tumor‐derived exosomes upregulated actin binding and actin length. Actin‐binding proteins are thought to be related to tumor EMT. Our laboratory previously reported that FSCN1, an actin‐binding protein, was a poor prognostic factor in patients with ESCC, and its expression was regulated by microRNAs. 14 , 15 Upregulation of extracellular organization was consistent with the promotion of EMT. The data obtained in this study could not directly clarify a consistent trend in changes in the expression of genes involved in EMT (eg, CDH, ZEB, SNAI). Further research should be undertaken to investigate the relationship between exosome exposure and promotion of EMT. For the cell cycle, previous reports have shown that the state of cell cycle arrest or the G0/G1 phase was related to chemoresistance. 16 , 17 In addition, other studies have shown that G0/G1‐phase cancer cells also have an upregulated migration ability compared with S/G2/M‐phase cells according to Fucci imaging. 17 Our data indicated that tumor‐derived exosomes increased the proportion of G1‐phase cells, resulting in the downregulation of cell proliferation and promotion of cell migration, and matches previous reports. While changes in chemosensitivity were not assessed in the present study, a high concentration of tumor‐derived exosomes might influence the effects of chemotherapy.
In the present study, gene expression changes were assessed using a comprehensive mRNA microarray with or without exosome exposure and GSEA. 18 GSEA is widely used, but its application in the present study was a limitation as the mechanism and details of the protein pathway could not be clarified because the amount of isolated exosome was far too small to analyze.
In the field of exosome research for cancer, proteins in exosomes present in bodily fluids are often analyzed using mass spectrometry and proteomic analyses to detect biomarkers for certain kinds of cancer. 19 , 20 , 21 miRNAs carried by exosomes are thought to influence gene expression. Exosomes contain many types of miRNAs (eg miR‐21, miR 93‐5, miR‐339‐5p, and miR‐1246), especially exosomes from patients with ESCC or from ESCC cell lines, and these miRNAs are related to many signal pathways. 4 , 6 , 22 , 23 In the present study, we focused on the high density of whole exosomes, not individual content. Further analyses (’omics analyses between microRNAs, mRNAs, and proteins) will need to be conducted to reveal the underlying mechanisms involved.
Recent studies have suggested that exosomes can function as a promising shuttle for anticancer drugs. 24 Some reports have also shown that exosome inhibitors (eg GW4869) are a promising therapeutic tool for certain diseases (eg Duchenne muscular dystrophy, cardiac dysfunction, etc). 25 , 26 The present findings suggested that the inhibition of tumor‐derived exosomes is a potential therapeutic target. However, exosomes and major exosome marker proteins (eg CD9, CD63, CD81) are closely related to a some life activities, such as fertilization and aging, 27 , 28 so the therapeutic application of exosome inhibition might be accompanied by serious complications. If specific inhibition of cancer‐derived exosome is possible, it may be able to prevent tumor progression, invasion, and metastasis.
DISCLOSURE
All authors declare that: (a) no support, financial or otherwise, has been received from any organization that may have an interest in the submitted work; and (b) there are no other relationships or activities that could appear to have influenced the submitted work.
Supporting information
Fig S1‐S2
ACKNOWLEDGMENT
The present study was supported by a Grant‐in‐Aid for Scientific research (grant nos. 15K19872 and 19K23880) from the Japan Society for the Promotion of Science. The authors thank Aki Komatsu and Keiko Iida for experimental support.
Matsumoto Y, Kano M, Murakami K, et al. Tumor‐derived exosomes influence the cell cycle and cell migration of human esophageal cancer cell lines. Cancer Sci 2020;111:4348–4358. 10.1111/cas.14660
REFERENCES
- 1. Bray F, Ferlay J, Soerjomataram I, et al. Global cancer statistics 2018: GLOBOCAN estimates of incidence and mortality worldwide for 36 cancers in 185 countries. CA Cancer J Clin. 2018;68:394‐424. [DOI] [PubMed] [Google Scholar]
- 2. Blot WJ, Tarone RE. Esophageal cancer In: Thun MJ, Linet MS, Cerhan JR, Haiman CA, Schottenfeld D, eds. Cancer Epidemiology and Prevention, 4th edn New York, NY: Oxford University Press; 2018:579‐592. [Google Scholar]
- 3. Matsumoto Y, Kano M, Akutsu Y, et al. Quantification of plasma exosome is a potential prognostic marker for esophageal squamous cell carcinoma. Oncol Rep. 2016;36:2535‐2543. [DOI] [PMC free article] [PubMed] [Google Scholar]
- 4. Takeshita N, Hoshino I, Mori M, et al. Serum microRNA expression profile: miR‐1246 as a novel diagnostic and prognostic biomarker for oesophageal squamous cell carcinoma. Br J Cancer. 2013;108:644‐652. [DOI] [PMC free article] [PubMed] [Google Scholar]
- 5. Yang YC, Liu GJ, Yuan DF, et al. Influence of exosome‐derived miR‐21 on chemotherapy resistance of esophageal cancer. Eur Rev Med Pharmacol Sci. 2019;23:1513‐1519. [DOI] [PubMed] [Google Scholar]
- 6. Luo A, Zhou X, Shi X, et al. Exosome‐derived miR‐339‐5p mediates radiosensitivity by targeting Cdc25A in locally advanced esophageal squamous cell carcinoma. Oncogene. 2019;38:4990‐5006. [DOI] [PubMed] [Google Scholar]
- 7. Mao Y, Wang Y, Dong L, et al. Circulating exosomes from esophageal squamous cell carcinoma mediate the generation of B10 and PD‐1high Breg cells. Cancer Sci. 2019;110:2700‐2710. [DOI] [PMC free article] [PubMed] [Google Scholar]
- 8. Hoshino A, Costa‐Silva B, Shen TL, et al. Tumour exosome integrins determine organotropic metastasis. Nature. 2015;527:329‐335. [DOI] [PMC free article] [PubMed] [Google Scholar]
- 9. Yokoi A, Yoshioka Y, Yamamoto Y, et al. Malignant extracellular vesicles carrying MMP1 mRNA facilitate peritoneal dissemination in ovarian cancer. Nat Commun. 2017;8:14470. [DOI] [PMC free article] [PubMed] [Google Scholar]
- 10. Kosaka N, Iguchi H, Hagiwara K, et al. Neutral sphingomyelinase 2 (nSMase2)‐dependent exosomal transfer of angiogenic microRNAs regulate cancer cell metastasis. J Biol Chem. 2013;288:10849‐10859. [DOI] [PMC free article] [PubMed] [Google Scholar]
- 11. Ono M, Kosaka N, Tominaga N, et al. Exosomes from bone marrow mesenchymal stem cells contain a microRNA that promotes dormancy in metastatic breast cancer cells. Sci Signal. 2014;7:ra63. [DOI] [PubMed] [Google Scholar]
- 12. Clayton A, Mitchell JP, Court J, et al. Human tumor‐derived exosomes down‐modulate NKG2D expression. J Immunol. 2008;180:7249‐7258. [DOI] [PubMed] [Google Scholar]
- 13. Qiao L, Hu S, Huang K, et al. Tumor cell‐derived exosomes home to their cells of origin and can be used as Trojan horses to deliver cancer drugs. Theranostics. 2020;10:3474‐3487. [DOI] [PMC free article] [PubMed] [Google Scholar]
- 14. Kano M, Seki N, Kikkawa N, et al. miR‐145, miR‐133a and miR‐133b: Tumor‐suppressive miRNAs target FSCN1 in esophageal squamous cell carcinoma. Int J Cancer. 2010;127:2804‐2814. [DOI] [PubMed] [Google Scholar]
- 15. Akanuma N, Hoshino I, Akutsu Y, et al. MicroRNA‐133a regulates the mRNAs of two invadopodia‐related proteins, FSCN1 and MMP14, in esophageal cancer. Br J Cancer. 2014;110:189‐198. [DOI] [PMC free article] [PubMed] [Google Scholar]
- 16. Miwa S, Yano S, Kimura H, et al. Cell‐cycle fate‐monitoring distinguishes individual chemosensitive and chemoresistant cancer cells in drug‐treated heterogeneous populations demonstrated by real‐time FUCCI imaging. Cell Cycle. 2015;14:621‐629. [DOI] [PMC free article] [PubMed] [Google Scholar]
- 17. Yano S, Miwa S, Mii S, et al. Invading cancer cells are predominantly in G0/G1 resulting in chemoresistance demonstrated by real‐time FUCCI imaging. Cell Cycle. 2014;13:953‐960. [DOI] [PMC free article] [PubMed] [Google Scholar]
- 18. Subramanian A, Tamayo P, Mootha VK, et al. Gene set enrichment analysis: a knowledge‐based approach for interpreting genome‐wide expression profiles. Proc Natl Acad Sci USA. 2005;102:15545‐15550. [DOI] [PMC free article] [PubMed] [Google Scholar]
- 19. Tutanov O, Orlova E, Proskura K, et al. Proteomic analysis of blood exosomes from healthy females and breast cancer patients reveals an association between different exosomal bioactivity on non‐tumorigenic epithelial cell and breast cancer cell migration in vitro. Biomolecules. 2020;10:495. [DOI] [PMC free article] [PubMed] [Google Scholar]
- 20. Shiromizu T, Kume H, Ishida M, et al. Quantitation of putative colorectal cancer biomarker candidates in serum extracellular vesicles by targeted proteomics. Sci Rep. 2017;7:12782. [DOI] [PMC free article] [PubMed] [Google Scholar]
- 21. Erozenci LA, Böttger F, Bijnsdorp IV, et al. Urinary exosomal proteins as (pan‐)cancer biomarkers: insights from the proteome. FEBS Lett. 2019;593:1580‐1597. [DOI] [PubMed] [Google Scholar]
- 22. Tanaka Y, Kamohara H, Kinoshita K, et al. Clinical impact of serum exosomal microRNA‐21 as a clinical biomarker in human esophageal squamous cell carcinoma. Cancer. 2013;119:1159‐1167. [DOI] [PubMed] [Google Scholar]
- 23. Liu MX, Liao J, Xie M, et al. miR‐93‐5p transferred by exosomes promotes the proliferation of esophageal cancer cells via intercellular communication by targeting PTEN. Biomed Environ Sci. 2018;31:171‐185. [DOI] [PubMed] [Google Scholar]
- 24. Bunggulawa EJ, Wang W, Yin T, et al. Recent advancements in the use of exosomes as drug delivery systems. J Nanobiotechnology. 2018;16:81. [DOI] [PMC free article] [PubMed] [Google Scholar]
- 25. Matsuzaka Y, Tanihata J, Komaki H, et al. Characterization and functional analysis of extracellular vesicles and muscle‐abundant miRNAs (miR‐1, miR‐133a, and miR‐206) in C2C12 myocytes and mdx mice. PLoS One. 2016;11:e0167811. [DOI] [PMC free article] [PubMed] [Google Scholar]
- 26. Essandoh K, Yang L, Wang X, et al. Blockade of exosome generation with GW4869 dampens the sepsis‐induced inflammation and cardiac dysfunction. Biochim Biophys Acta. 2015;1852:2362‐2371. [DOI] [PMC free article] [PubMed] [Google Scholar]
- 27. Miyado K, Yamada G, Yamada S, et al. Requirement of CD9 on the egg plasma membrane for fertilization. Science. 2000;287:321‐324. [DOI] [PubMed] [Google Scholar]
- 28. Jin Y, Takeda Y, Kondo Y, et al. Double deletion of tetraspanins CD9 and CD81 in mice leads to a syndrome resembling accelerated aging. Sci Rep. 2018;8:5145. [DOI] [PMC free article] [PubMed] [Google Scholar]
Associated Data
This section collects any data citations, data availability statements, or supplementary materials included in this article.
Supplementary Materials
Fig S1‐S2