

Abstract
The efficacy of azacitidine (AZA) on survival of lower risk (LR) ‐ myelodysplastic syndromes (MDS) is controversial. To address this issue, we retrospectively evaluated the long‐term survival benefit of AZA for patients with LR‐MDS defined by International Prognostic Scoring System (IPSS). Using data from 489 patients with LR‐MDS in Nagasaki, hematologic responses according to International Working Group 2006 and overall survival (OS) were compared among patients that received best supportive care (BSC), immunosuppressive therapy (IST), erythropoiesis‐stimulating agents (ESA), and AZA. Patients treated with AZA showed complete remission (CR) rate at 11.3%, marrow CR at 1.9%, and any hematologic improvement at 34.0%, with transfusion independence (TI) of red blood cells in 27.3% of patients. and platelet in 20% of patients, respectively. Median OS for patients received IST, ESA, BSC, and AZA (not reached, 91 months, 58 months, and 29 months, respectively) differed significantly (P < .001). Infection‐related severe adverse events were observed in more than 20% of patients treated with AZA. Multivariate analysis showed age, sex, IPSS score at diagnosis, and transfusion dependence were significant for OS, but AZA treatment was not, which maintained even response to AZA, and IPSS risk status at AZA administration was added as factors. We could not find significant survival benefit of AZA treatment for LR‐MDS patients.
Keywords: characteristics and pathology of human cancer, chemotherapy and endocrine therapy, epigenetic therapy, hematopoietic organ
Multivariate analysis showed age, sex, IPSS score at diagnosis, and transfusion dependence were significant for OS, but AZA treatment was not, which maintained even response to AZA, and IPSS risk status at AZA administration was added as factors. We could not find significant survival benefit of AZA treatment for LR‐MDS patients.

Abbreviations
- AEs
adverse events
- AML
acute myeloid leukemia
- AZA
azacitidine
- BSC
best supportive care
- CI
comorbidity index
- CI
confidence interval
- CR
complete remission
- ECOG
Eastern Cooperative Oncology Group
- ESA
erythropoiesis‐stimulating agents
- FAB
French‐American‐British
- HI
hematological improvement
- HR
higher risk
- HSCT
hematopoietic stem cell transplantation
- int
intermediate
- IPSS
International Prognostic Scoring System
- IPSS‐R
revised version
- IST
immunosuppressive therapy
- LR
lower risk
- mCR
marrow CR
- MDS
myelodysplastic syndromes
- OR
Overall response
- OS
overall survival
- PC
platelet cells
- PR
partial remission
- PS
Performance status
- RBC
red blood cells
- TD
transfusion dependence
- TI
transfusion independence
- t‐MDS
therapy‐related MDS
- WHO
World Health Organization
1. INTRODUCTION
Myelodysplastic syndromes (MDS) are clonal hematopoietic stem cell disorders characterized by ineffective hematopoiesis and dysplasia of hematopoietic cells. 1 The primary cause of death in MDS patients is infection, mostly due to cytopenia and neutrophil dysfunction. In some patients, blast counts increase during the clinical course, resulting in progression to acute myeloid leukemia (AML), which is generally refractory to standard chemotherapy. The prognosis of MDS is often predicted using the International Prognostic Scoring System (IPSS), 2 and its revised version (IPSS‐R), 3 both of which are based upon the percentages of marrow blasts, chromosomal abnormalities, and cytopenia. Patients are considered to be at lower risk (LR) if they are classified into the low and intermediate (int)‐1 risk groups, and at higher risk (HR) if in the Int‐2 and high‐risk groups on the IPSS. Treatments differ between patients with LR and HR, as significant differences between these groups exist in the risk of leukemic transformation and survival. For LR‐MDS patients, the aim of treatment is mainly to improve cytopenias and quality of life, such as reducing the volume of transfusion. 1 Erythropoiesis‐stimulating agents (ESAs) 4 and immunosuppressive therapies (IST) 5 are used for patients with LR‐MDS for these purposes. New agents (eg, luspatercept 6 and lenalidomide 7 ) are becoming available for LR‐MDS to improve cytopenia, but response rates are still unsatisfactory, and most importantly, no agents have been found to significantly prolong survival of LR‐MDS in prospective randomized clinical trials. For HR‐MDS, because of the shorter survival than LR‐MDS, more aggressive strategies are applied, including intensive chemotherapy and hematopoietic stem cell transplantation (HSCT). 1 The hypomethylating agent, azacitidine (AZA), has been tested among HR‐MDS patients who were not candidates for HSCT, 8 and significantly prolonged time to leukemic transformation and survival compared with the conventional care regimens. AZA is therefore considered as first‐line treatment for HR‐MDS patients when HSCT, as the only curative option for MDS, is unavailable. Several studies have shown that AZA for LR‐MDS provided hematological response, hematological improvement, 9 and transfusion independence (TI). 10 Considering the effects of AZA on HR‐MDS for improving survival, determining whether AZA could significantly prolong survival of LR‐MDS is important. Reported outcomes of long‐term survival in LR‐MDS patients treated with AZA remain controversial, with some studies analyzing small numbers of cases, and some lacking a control group, 9 , 10 , 11 , 12 , 13 , 14 , 15 , 16 , 17 , 18 , 19 prompting us to address this issue. The current study used an observational scheme to retrospectively analyze outcomes for LR‐MDS patients diagnosed and treated at multiple institutions in Nagasaki Prefecture, particularly to evaluate the long‐term efficacy of AZA in the real‐world practice.
2. PATIENTS AND METHODS
2.1. Patients
In this study, MDS was diagnosed according to the French‐American‐British (FAB) 20 and World Health Organization (WHO) classification 2008, 21 and prognostic risk stratification at diagnosis was based on the IPSS and IPSS‐R. We retrospectively collected all LR‐MDS patients meeting the following criteria: IPSS low and int‐1; age >18 years old; and diagnosis between January 2000 and December 2016 at Nagasaki University Hospital or 9 affiliated facilities (listed in acknowledgement). To demonstrate a role of AZA in the real‐world practice, LR‐MDS patients at diagnosis were included and analyzed by treatment group, regardless of the risk status when treatment started. Data were updated as of the end of July 2017. We included patients with therapy‐related MDS (t‐MDS) and with transformation from aplastic anemia, but excluded patients with chronic myelomonocytic leukemia. Comorbidities were evaluated using the Charlson comorbidity index 22 and MDS comorbidity index (MDS‐CI). 23 Performance status (PS) was evaluated using Eastern Cooperative Oncology Group (ECOG) score. Transfusion dependence (TD) was defined as a condition requiring transfusion of > 2 units of red blood cells (TD‐RBC) or > 10 units of platelet cells (TD‐PC) within 4 weeks. 4 Median durations of follow‐up for patients in the AZA group and others were 19.8 months (range, 1.1‐80.8 months) and 23.4 months (range, 0‐128.2 months), respectively. This study was performed in accordance with the ethical standards of the World Medical Association Declaration of Helsinki and was approved by the internal review boards of each participating institution.
2.2. Treatment
AZA was administered at 75 mg/m2/day subcutaneously or intravenously for 5‐7 days of a 28‐day cycle. In some patients, AZA doses were modified according to the conditions of the patient and at the discretion of the attending physicians. Some patients received immunosuppressive drugs such as cyclosporine and/or anti‐human thymocyte immunoglobulin as IST, and some received darbepoetin, as an ESA. Remaining patients received best supportive care (BSC) other than AZA, IST or ESA.
2.3. Response criteria
Best treatment response was evaluated according to International Working Group 2006 criteria. 24 Overall response (OR) was defined as the combination of complete remission (CR), partial remission (PR), marrow CR (mCR), or any hematological improvement (HI). TI was defined as a continuous transfusion‐free period > 8 weeks. Adverse events (AEs) were assessed in accordance with Common Terminology Criteria for Adverse Events, version 4.0.
2.4. Statistical analysis
Clinical covariates were compared using the Mann‐Whitney U‐test for continuous variables and Fisher's exact test for categorical variables. Multivariate analysis of the correlation between patient characteristics and treatment response was performed using logistic regression analysis. Overall survival (OS) was defined from date of diagnosis to date of death or last follow‐up. Patients who received hematopoietic stem cell transplantation (HSCT) were censored from the OS analysis at the day of transplantation, and those were alive at last follow‐up were also censored at the date of last follow‐up. Hematologic response and OS were compared among patients who received AZA, BSC, IST, and ESA, and also compared between patients treated with and without AZA. OS was estimated using Kaplan‐Meier methods, 25 and log‐rank tests were used to analyze statistical differences between curves. Multivariate analysis using the Cox proportional hazards regression method was used to identify significant and independent predictors of OS. Those variables showing significant associations with OS from univariate analyses were included in the multivariate model. Values of P < .05 were considered statistically significant. All statistical analyses were performed using EZR 26 and Statistical Analysis Software (SAS version 9.4 for Windows; SAS Institute).
3. RESULTS
3.1. Patient characteristics
Among the 489 patients analyzed, 53 patients were treated with AZA (AZA group), 50 patients with IST (IST group), and 39 patients with ESA (ESA group) as an initial therapy, while 347 patients received BSC (BSC group). We combined patients in the IST, ESA, and BSC groups, and categorized them as the Non‐AZA group for comparisons with patients in the AZA group.
Median ages at diagnosis were 71 years (range, 44‐87 years) and 76 years (range, 19‐94 years) in the AZA and non‐AZA groups, respectively, showing a significant difference (P = .020, Table 1), although ages were similar between the AZA and IST groups (Table 1). We also observed differences in onset of MDS (P = .042), karyotype risk by IPSS‐R (P = .035), ECOG PS (P = .004), and the percentages of both TD‐RBC and TD‐PC patients (P < .001, respectively) between AZA and non‐AZA groups (Table 1). TD‐RBC was seen in 33 patients (57.9%) and TD‐PC in 20 patients (37.7%) in the AZA group. However, when TDs of each treatment group were compared separately, significant differences in both TD‐RBC and TD‐PC were seen between AZA and BSC groups, but not between AZA and IST or ESA groups (data not shown, Table 1), demonstrating high TD rates for patients treated with IST, ESA, or AZA. Among AZA and non‐AZA groups, no significant differences were seen in other basic clinical parameters (Table 1, and Table S1).
Table 1.
Clinical features of patients by treatment group
| Parameter | Non‐AZA group | AZA group | P value | |||
|---|---|---|---|---|---|---|
| IST group | ESA group | BSC group | Total | (non ‐AZA vs AZA) | ||
| No. of patients | 50 | 39 | 347 | 436 | 53 | |
| Age, median | 69 | 78 | 77 | 76 | 71 | 0.020 a |
| Range | 20‐90 | 57‐89 | 19‐94 | 19‐94 | 44‐87 | |
| Sex | ||||||
| Male, n (%) | 25 (50) | 24 (61.5) | 187 (53.9) | 236 (54.1) | 36 (67.9) | 0.059 b |
| Female, n (%) | 25 (50) | 15 (38.5) | 160 (46.1) | 200 (45.9) | 17 (32.1) | |
| Onset | ||||||
| De novo, n (%) | 44 (88) | 35 (89.7) | 324 (93.4) | 403 (92.4) | 47 (88.7) | 0.042 b |
| Secondary, n (%) | 6 (12) | 3 (7.7) | 6 (1.7) | 15 (3.4) | 0 | |
| t‐MDS, n (%) | 0 | 1 (2.6) | 17 (4.9) | 18 (4.1) | 6 (11.3) | |
| FAB classification | ||||||
| RA, n (%) | 46 (92) | 31 (79.5) | 286 (82.4) | 363 (83.3) | 41 (77.4) | 0.132 b |
| RARS, n (%) | 0 | 3 (7.7) | 13 (3.7) | 16 (3.7) | 0 | |
| RAEB, n (%) | 4 (8) | 5 (12.8) | 42 (12.1) | 51 (11.7) | 11 (20.8) | |
| RAEB‐T, n (%) | 0 | 0 | 6 (1.7) | 6 (1.4) | 1 (1.9) | |
| IPSS | ||||||
| Low, n (%) | 11 (22.0) | 17 (43.6) | 130 (37.5) | 158 (36.2) | 12 (22.6) | 0.066 b |
| Intermediate‐1, n (%) | 39 (78.0) | 22 (56.4) | 217 (62.5) | 278 (63.8) | 41(77.4) | |
| Karyotype risk by IPSS‐R | ||||||
| Very good, n (%) | 5 (10) | 4 (10.2) | 21 (6.1) | 30 (6.9) | 2 (3.8) | 0.035 b |
| Good, n (%) | 33 (66) | 25 (64.1) | 273 (78.7) | 331 (75.9) | 38 (71.7) | |
| Intermediate, n (%) | 10 (20) | 8 (20.5) | 40 (11.5) | 58 (13.3) | 6 (11.3) | |
| Poor, n (%) | 2 (4) | 0 | 8 (2.3) | 10 (2.3) | 6 (11.3) | |
| Very poor, n (%) | 0 | 2 (5.1) | 5 (1.4) | 7 (1.6) | 1 (1.9) | |
| ECOG PS | ||||||
| 0‐1, n (%) | 28 (56) | 15 (38.5) | 166 (47.8) | 209 (47.9) | 34 (64.1) | 0.004 b |
| 2‐4, n (%) | 14 (28) | 19 (48,7) | 145 (41.8) | 178 (40.8) | 19 (35.8) | |
| Unknown, n (%) | 8 (16) | 5 (12.8) | 36 (10.4) | 49 (11.2) | 0 | |
| ANC (x109/L), median (range) | 1.43 (0.27‐4.1) | 1.88 (0.33‐8.7) | 1.69 (0.18‐11.2) | 1.70 (0.18‐11.7) | 1.98 (0.29‐7.0) | 0.408 a |
| Hb (g/dL), median (range) | 8.2 (3.5‐14.7) | 7.6 (4.0‐10.9) | 8.7 (2.5‐15.1) | 8.4 (2.5‐15.1) | 9.1 (4‐14.7) | 0.102 a |
| Plt (x109/L), median (range) | 41.5 (4.0‐374) | 120.0 (15.0‐611.0) | 96.0 (5.0‐458.0) | 93.0 (4.0‐611.0) | 79.0 (8.0‐673.0) | 0.400 a |
| BM blasts (%), median (range) | 0.8 (0‐8.0) | 1.4 (0.2‐5.8) | 1.8 (0‐10.8) | 1.6 (0‐10.8) | 1.8 (0.4‐9) | 0.149 a |
| TD | ||||||
| RBC, n (%) | 33 (67.3) | 21 (60.0) | 94 (31.1) | 148 (48.4) | 33 (57.9) | <0.001 b |
| PC, n (%) | 13 (26.5) | 3 (8.5) | 44 (14.6) | 60 (15.5) | 20 (37.7) | <0.001 b |
| Received HSCT, n (%) | 5 (10) | 0 | 7 (2.0) | 12 (2.8) | 3 (5.7) | |
| Risk of MDS at treatment | ||||||
| Lower‐risk | 50 (100) | 39 (100) | NA | NA | 41 (77.4) | |
| Higher‐risk | 0 | 0 | NA | NA | 12 (22.6) | |
Abbreviations: ANC, absolute neutrophil count; AZA, azacitidine; BM, bone marrow; BSC, best supportive care; ECOG, Eastern Cooperative Oncology Group; ESA, erythropoiesis‐stimulating agent; FAB, French‐American‐British; Hb, hemoglobin; HSCT, hematopoietic stem cell transplantation; IPSS, international prognostic scoring system; IPSS‐R, revised international prognostic scoring system; IST, immunosuppressive therapy; NA, not applied; PC, platelet cells; Plt, platelets; PS, performance status; RA, refractory anemia; RAEB, refractory anemia with excess of blasts; RAEB‐T, RAEB in transformation; RARS, refractory anemia with ringed sideroblasts; RBC, red blood cells; TD, transfusion dependency; t‐MDS, therapy‐related myelodysplastic syndromes.
Calculated using the Mann‐Whitney test.
Calculated using Fisher's exact test.
Median time from diagnosis to AZA administration was 105 days (range, 3‐1853 days). Reasons for AZA administration in the AZA group (multiple answers) were TD (n = 35, 66.0%), blast increase (n = 18, 34.0%), refractory cytopenias (n = 6, 11.3%) and the presence of poor risk karyotype (n = 5, 9.4%). When AZA was started, 12 of 53 patients (22.6%) progressed to the HR state of MDS, and 41 of 53 patients (77.4%) remained in a LR‐MDS status (Table 1). Median number of AZA treatment cycles was 6 (range, 1‐28). Three patients (5.7%) received allogeneic HSCT (allo‐HSCT) after AZA treatment.
3.2. Response to AZA
In the AZA group, the OR rate was 35.8%, including 11.3%, 1.9%, and 34.0% of patients achieving CR, marrow CR, and any HI, respectively (multiple count, Table 2). Stable disease was seen in 64.2% of patients. In terms of hematological improvement, the percentage erythroid response (29.4%) was higher than that for other lineages (20.0% for platelets, and 15.4% for granulocytes; Table 2). Median duration of CR was 8.5 months (range, 2.0‐21.9 months), and durations for hematological improvements were 5.0 months for platelets and granulocytes, and 8.0 months for erythrocytes (Table 2). TI of RBC and PC was seen in 27.3% and 20.0% of patients, respectively (Table 2), with median durations of 6.0 (range, 2.0‐13.0 months) and 4.5 months (range, 2.0‐13.0 months), respectively.
Table 2.
Best response to azacitidine
| Outcome | AZA group (n = 53) | |
|---|---|---|
| N (%) | Median duration (mo, range) | |
| Hematologic response | ||
| Complete remission | 6 (11.3) | 8.5 (2.0‐21.9) |
| Marrow CR | 1 (1.9) | 4 |
| Stable disease | 34 (64.2) | ‐ |
| Failure | 11 (20.7) | ‐ |
| Disease progression | 1 (1.9) | ‐ |
| Hematologic improvement | ||
| Any | 18/53 (34.0) | ‐ |
| Erythrocyte | 15/51 (29.4) | 8.0 (2.0‐21.9) |
| Platelet | 8/40 (20.0) | 5.0 (2.0‐13.0) |
| Granulocyte | 4/26 (15.4) | 5.0 (2.0‐21.9) |
| Transfusion independency | ||
| Red blood cell | 9/33 (27.3) | 6.0 (2.0‐13.0) |
| Platelet | 4/20 (20.0) | 4.5 (2.0‐13.0) |
Multivariate logistic testing showed no significant differences in hematologic response or improvement by sex, age, IPSS at diagnosis, and TD (Model 1, Table 3). As mentioned above, when AZA was started, 22.6% (12 of 53 patients) were in higher‐risk status in the AZA group, but risk status at the time of AZA administration did not show a significant correlation with response by multivariate analysis (Model 2, Table 3).
Table 3.
Clinical factors affecting overall response rate (multivariate logistic regression analysis)
| Variable | Odds ratio (95% CI) | P value |
|---|---|---|
| Model 1 | ||
| Sex | ||
| Male | 0.655 (0.188‐2.28) | 0.597 |
| Female | 1 | |
| Age | 1.023 (0.962‐1.088) | 0.469 |
| IPSS at diagnosis | ||
| Low | 1.237 (0.296‐5.174) | 0.771 |
| Intermediate‐1 | 1 | |
| Transfusion dependence | ||
| Yes | 1.015 (0.264‐3.910) | 0.983 |
| No | 1 | |
| Model 2 | ||
| Sex | ||
| Male | 0.586 (0.162‐2.12) | 0.415 |
| Female | 1 | |
| Age | 1.027 (0.967‐1.091) | 0.389 |
| IPSS risk at AZA administration | ||
| Higher | 3.937 (0.737‐21.047) | 0.387 |
| Lower | 1 | |
| Transfusion dependence | ||
| Yes | 0.832 (0.219‐3.169) | 0.788 |
| No | 1 | |
Abbreviations: AZA, azacitidine; IPSS, international prognostic scoring system.
3.3. Overall survival
Median OS for patients in the IST, ESA, BSC, and AZA groups (not reached, 91 months, 58 months, and 29 months, respectively) differed significantly (P < .001, Figure 1), with expected 3‐year OS rates at 71.5%, 77.8%, 61.1%, and 36.3% for IST, ESA, BSC, and AZA group, respectively. Among factors listed in Table 1, age, sex, IPSS at diagnosis, TD, and treatment group were significantly associated with OS in univariate analysis. Of note, progression to HR‐MDS at the time of AZA treatment did not have any impact on OS by univariate analysis in the AZA group (Figure S1, P = .579). OS curves by IPSS category at diagnosis are shown in Figure 2 (3‐year OS, 77.8% for low, and 46.8% for int‐1 at diagnosis, respectively; P < .001), and those by TD are shown in Figure 3 (3‐year OS, 77.5% for without TD, and 44.4% for TD, P < .001). Using these significant pretreatment factors by univariate analysis, we performed multivariate analysis to search for an independently significant factor. As shown in Model 1 (Table 4), age, sex, IPSS at diagnosis, TD, and treatment group of IST and ESA were independently significant for OS, but AZA treatment was not, demonstrating that the AZA group did not show better survival than the BSC group even significant factors were adjusted. Because AZA treatment improved the hematological situation for some patients (Table 2), response to AZA was added as a factor for multivariate analysis of OS. Response to AZA was categorized as response (OR including CR, marrow CR, PR, and any HI), stable disease, or no response (failure or disease progression). In multivariate analysis including response to AZA (Model 2, Table 4), no response was an independent prognostic factor (hazard ratio, 2.99; 95% confidence interval (CI), 1.64‐5.45, P < .001), with age, sex, IPSS at diagnosis, and TD, but response (CR, mCR, HI) or stable disease was unrelated to better OS compared with the non‐AZA group. As a whole, 15 of 489 patients received allo‐HSCT (3 in AZA, and 12 in non‐AZA group, respectively), and 10 of these patients were alive as of last analysis. As mentioned in PATIENTS AND METHODS section, those who received allo‐HSCT were censored for OS analysis at the day of transplantation.
Figure 1.
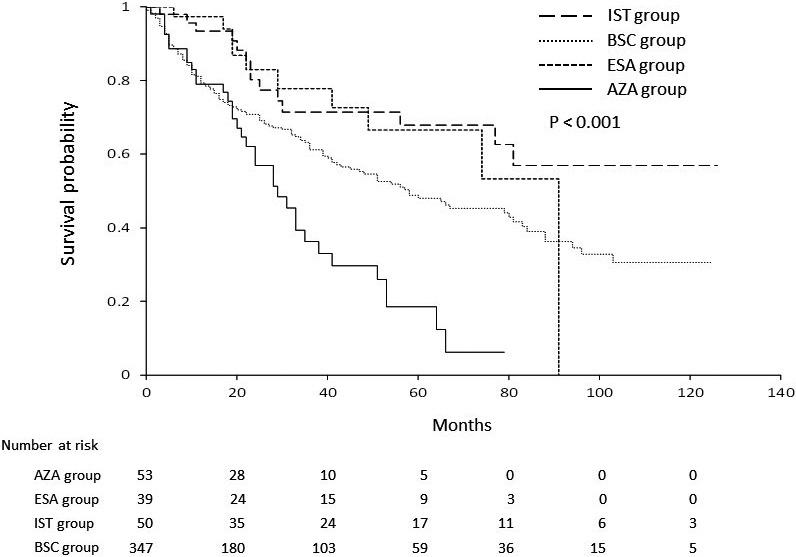
Overall survival by treatment group. A significant difference in survival curves was seen by the 4 treatment groups (P < .001). ESA, Erythropoiesis‐stimulating agents; IST, immunosuppressive therapies; AZA, azacitidine; BSC, best supportive care
Figure 2.
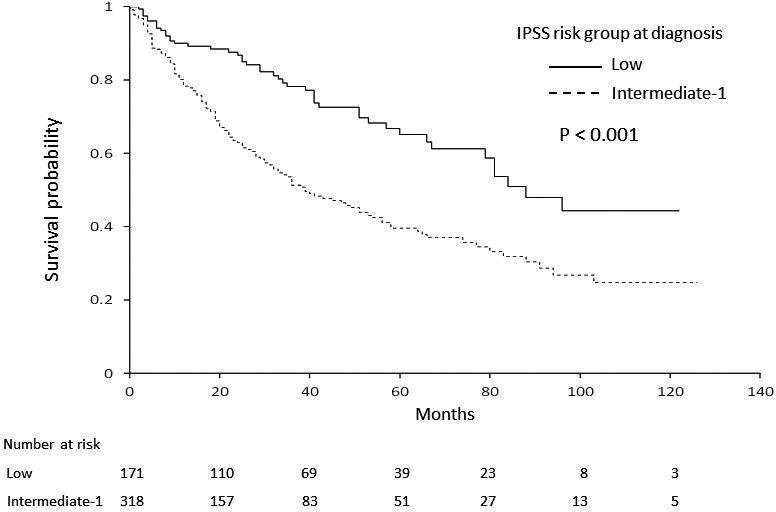
Overall survival by IPSS risk at diagnosis. Patients in the low‐risk category of IPSS showed significantly better survival than those in the intermediate‐1 risk category (P < .001). IPSS, International Prognostic Scoring System
Figure 3.
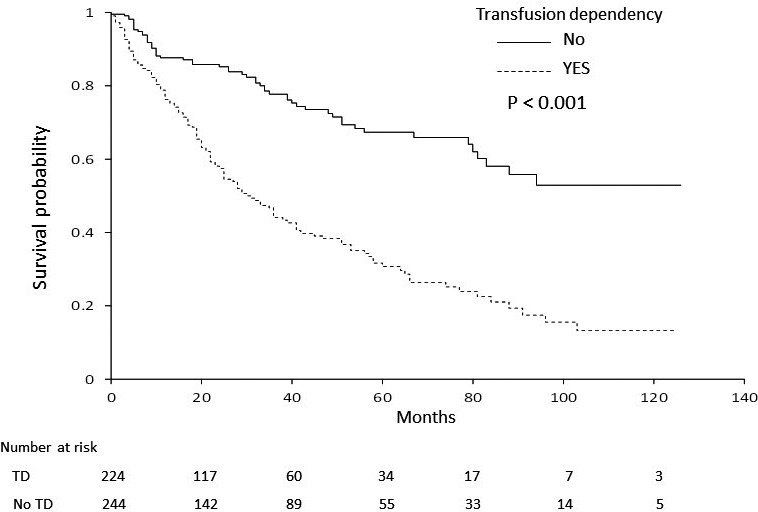
Overall survival according to transfusion dependency. Patients that were independent of transfusion showed better prognosis than patients dependent on transfusion (P < .001). TD, transfusion dependency
Table 4.
Multivariate analysis of prognostic factors for overall survival
| Variable | Hazard ratio | 95% CI | P value |
|---|---|---|---|
| Model 1: pretreatment factors | |||
| Age at diagnosis (per year) | 1.05 | 1.03‐1.07 | <0.001 |
| Sex | |||
| Male | 1.6 | 1.18‐2.14 | 0.002 |
| Female | 1 | — | — |
| IPSS at diagnosis | |||
| Low | 0.51 | 0.36‐0.72 | <0.001 |
| Int‐1 | 1 | — | — |
| Transfusion dependence | |||
| Yes | 2.4 | 1.72‐3.35 | <0.001 |
| No | 1 | — | — |
| Treatment | |||
| AZA | 1.44 | 0.96‐2.16 | 0.08 |
| IST | 0.38 | 0.20‐0.73 | 0.004 |
| ESA | 0.5 | 0.28‐0.89 | 0.019 |
| BSC | 1 | — | — |
| Model 2: including response to AZA | |||
| Age | 1.05 | 1.04‐1.07 | <0.001 |
| Sex | 1.65 | 1.23‐2.23 | 0.001 |
| IPSS at diagnosis | 0.53 | 0.38‐0.75 | <0.001 |
| Transfusion dependence | 2.08 | 1.50‐2.88 | <0.001 |
| Response to AZA | |||
| Response (CR, mCR, HI) | 1.37 | 0.71‐2.63 | 0.352 |
| Stable disease | 1.56 | 0.85‐2.86 | 0.148 |
| No response | 2.99 | 1.64‐5.45 | <0.001 |
| Non‐AZA group | 1 | — | — |
AZA, azacitidine; BSC, best supportive care; CI, confidence interval; CR, complete remission; ESA, erythropoiesis‐stimulating agent; HI, hematologic improvement; Int‐1, intermediate‐1; IPSS, international prognostic scoring system; IST, immunosuppressive therapy; mCR, marrow CR.
3.4. Safety
With regard to hematological AEs for the AZA group, neutropenia occurred in 81.1%, thrombocytopenia in 83.0%, and anemia in 67.9% (Table 5). Non‐hematological AEs of grade 3 to 4 included febrile neutropenia in 13.2% and infection in 9.4%. During the study period, 204 death events occurred, 15, 11, and 144 in the IST, ESA, and BSC groups, respectively, and 34 in the AZA group (Table 6 and Figure 4). Infection was the most frequent cause of death (35.3%, 12 of 34 cases) in the AZA group, similar with that in the non‐AZA group (30.6%), followed by AML transformation, and hemorrhage. Percentages of AML transformation and hemorrhage were higher in the AZA group (26.5% and 20.6%, respectively) than in the non‐AZA group (8.8% and 7.6%, respectively).
Table 5.
Adverse Events of patients in AZA group (CTCAE v4.0)
| Adverse event | AZA group (n = 53) | |
|---|---|---|
| Grade 3/4, n (%) | All Grade, n (%) | |
| Hematological | ||
| Neutropenia | 41 (77.0) | 43 (81.1) |
| Thrombocytopenia | 35 (66.0) | 44 (83.0) |
| Anemia | 33 (62.3) | 36 (67.9) |
| Non‐hematological | ||
| Febrile neutropenia | 7 (13.2) | 7 (13.2) |
| Infection | 5 (9.4) | 5 (9.4) |
| Constipation | 1 (1.9) | 35 (66.0) |
| Anorexia | 0 | 16 (30.2) |
| Renal dysfunction | 0 | 16 (30.2) |
| Reaction of injection site | 0 | 8 (15.1) |
| Fever | 0 | 5 (9.4) |
| Fatigue | 0 | 6 (11.3) |
| Diarrhea | 0 | 5 (9.4) |
| Oral mucositis | 0 | 1 (1.9) |
| Peripheral neuropathy | 0 | 2 (3.8) |
| Bilirubin increased | 0 | 1 (1.9) |
Abbreviations: CTCAE, Common Terminology Criteria for Adverse Events.
Table 6.
Causes of death
| Cause | Non‐AZA group, n (%) | AZA group, n (%) | |||
|---|---|---|---|---|---|
| IST (n = 15) | ESA (n = 11) | BSC (n = 144) | Total (n = 170) | (n = 34) | |
| AML, n (%) | 2 (13.3) | 0 | 13 (9.0) | 15 (8.8) | 9 (26.5) |
| MDS, n (%) | 0 | 3 (27.3) | 7 (4.9) | 10 (5.9) | 2 (5.9) |
| Infection, n (%) | 4 (26.7) | 2 (18.2) | 46 (31.9) | 52 (30.6) | 12 (35.3) |
| Hemorrhage, n (%) | 2 (13.3) | 2 (18.2) | 9 (6.3) | 13 (7.6) | 7 (20.6) |
| Heart failure, n (%) | 2 (13.3) | 1 (9.1) | 14 (9.7) | 17 (10.0) | 0 |
| Solid tumor, n (%) | 1 (6.7) | 0 | 18 (10.4) | 19 (11.2) | 1 (2.9) |
| Others, n (%) | 2 (13.3) | 2 (18.2) | 21 (14.6) | 25 (14.7) | 1 (2.9) |
| Unknown, n (%) | 2 (13.3) | 1 (9.1) | 16 (11.1) | 19 (11.2) | 2 (5.9) |
Abbreviations: AML, acute myeloid leukemia; AZA, azacitidine; BSC, best supportive care; ESA, ‐stimulating agent; IST, immunosuppressive therapy; MDS, myelodysplastic syndromes.
Figure 4.
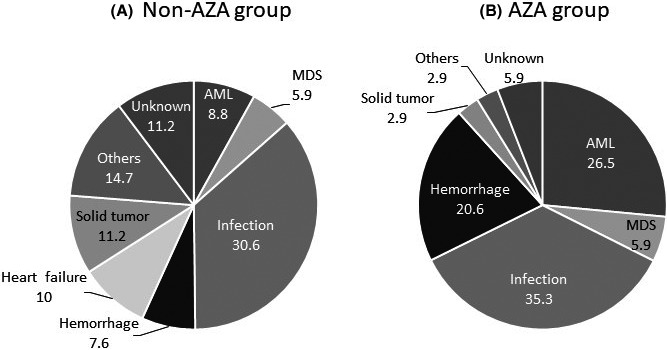
Cause of death in non‐AZA (A) and AZA (B) groups. Infection was the most frequent cause of death (35.3%) in the AZA group, similar with that in the non‐AZA group (30.6%). Percentages of AML transformation and hemorrhage were higher in the AZA group (26.5% and 20.6%, respectively) than in the non‐AZA group (8.8% and 7.6%, respectively)
4. DISCUSSION
The aim of this retrospective cohort study was to evaluate the long‐term survival benefit of AZA for patients with LR‐MDS. We could not demonstrate that AZA had any significant impact on survival for LR‐MDS, even though some hematological responses (including TI) were obtained. This study tried to capture the “real‐world” situation of AZA use for LR‐MDS in Nagasaki, Japan. LR‐MDS patients with minor or no symptoms could be diagnosed and followed in clinics other than the participating 10 institutions for this study. However, considering that these 10 institutions care for most patients with hematological neoplasms in Nagasaki Prefecture, 27 we believe that this study closely reflected the current status of treatment for LR‐MDS. We found that 53 of 489 patients (10.8%) with LR‐MDS were treated with AZA as an initial therapy in the Nagasaki area, and 41 (6.3%) received the first AZA treatment while in LR status (Table 1). Transfusion dependence and increase of blasts were major reasons for AZA administration, which seemed to be related to selection bias for AZA group.
In the AZA001 trial, 8 the disease‐modifying effects of AZA on MDS was shown, significantly prolonging survival of HR‐MDS patients compared with conventional care regimens. Although a current major goal of LR‐MDS treatment is the improvement of cytopenia and quality of life, survival is also an important endpoint. In this regard, AZA could be an option for LR‐MDS, based on the results from the AZA001 study and several retrospective and prospective studies of AZA for LR‐MDS.
In some prospective trials, administration of AZA for 3‐7 days provided OR rates of 16‐49%, 15 , 16 , 17 , 18 , 19 similar to the present results (35.8%). However, numbers of patients were not large (20‐51 patients, Table 7), and observation periods were relatively short, demonstrating 1‐year survival rate in some studies. Retrospective studies (Table 7) had longer observation periods for OS than prospective trials, but one showed 70.8% survival at 30 months, and another showed 36.3% at 4 years. Unfortunately, those studies did not examine the impact of AZA on survival. A retrospective study by Baek et al 14 took a similar approach to our study, using case‐matched analysis to balance risk factors between treatment with hypomethylating agents (AZA and decitabine (HMA)) and non‐treated groups. They described responders to HMA as showing similar OS to those receiving best supportive care, whereas non‐responders to HMA showed significantly worse prognosis than other patients, showing no clear survival benefit from HMA for LR‐MDS patients. One of the unknown, but interesting issues in that report were the reasons for HMA treatment, when known risk factors were comparable in their case‐matched analysis cohort, while TD and blast increase were the major reasons in our study. Some differences were seen between Baek's and our studies, such as median time from diagnosis to HMA treatment (45 days in Baek's study, and 105 days in our study), and patient distributions in the IPSS‐R high and very high categories (36 of 162 case‐matched patients (22.2%) in Beak's study, 40 of 489 patients (8.2%) in ours, Table S1). Patient backgrounds may have differed between the two studies, probably due to a large degree of variability in MDS, although both analyzed LR‐MDS. In any case, neither study identified any survival benefit of AZA/HMA for this group of patients.
Table 7.
Reported clinical effects of AZA for lower‐risk MDS
| Reference | Study design | Patients (n) | Treatment AZA schedule | Response rate | Median survival | OS |
|---|---|---|---|---|---|---|
| Musto et al (2010) | retrospective | 74 | 7d: 58%, 5d: 39% | ORR: 45.9% | not reached | 1‐yr: 74.9%, 30mo: 70.8% |
| Falantes et al (2015) | retrospective | 27 | 7d: 56%, 5d: 37% | ORR: 40.7% | 23 mo | 1‐yr: 62.4%, 2‐yr: 45.1% |
| 61 | non‐AZA | 10 mo | 1‐yr: 74.9%, 2‐yr: 5.7% | |||
| Lee et al (2017) | retrospective | 586 | 7d or 5d | ORR: 50.7% | 27.3 mo | 4‐yr: 36.3% |
| Baek et al (2018) | retrospective | 243 | AZA7d, DEC5d | ORR: 42.8% | NE | 3‐yr: (responder) 4.4% |
| NE | (non‐responder)46.3% | |||||
| 110 | BSC | NE | 3‐yr: 69.1% | |||
| Tobiasson et al (2014) | prospective | 30 | 5d ± ESA | ORR: 16%; TI: 20% | not reached | |
| Jabbour et al (2017) | prospective | 40 | 3d | ORR: 49%; TI: 16% | not reached | 1‐yr: 83% |
| Fili et al (2013) | prospective | 32 | 5d | ORR: 47%; TI: 33% | NE | NE |
| Morita et al (2018) | prospective | 51 | 5d | TI: 39% | NE | NE |
| Sanchez‐Garcia et al (2018) | prospective | 20 | 5d | TI: 33% | not reached | 1‐yr: 87.5% |
| 20 | BSC | TI: 5.5% | not reached | 1‐yr: 87.5% |
Abbreviations: AZA, azacitidine; BSC, best supportive care; d, days; DEC, decitabine; mo, months; NE, not evaluated; ORR, overall response rate; OS, overall survival; TI, transfusion independence; yr, years.
TD has a negative impact on survival for MDS patients, 28 and showed the largest impact in the multivariate analysis in our study, independent of IPSS and treatment (Table 4). In the subgroup analysis, the survival curve for TD patients treated with AZA was above that of TD patients in BSC group up to 75 months from diagnosis (data not shown). This suggests that some patients might have benefited from AZA among TD patients. However, because multivariate analysis including TD and AZA groups as factors did not show any clear benefit of AZA, caution should be paid regarding this interpretation.
In general, mostly because of the relatively long‐term survival of LR‐MDS patients, a prospective clinical trial to measure the survival benefit of treatment for this group is not easy to perform. In this regard, observational studies have a role to play in evaluating the efficacy of treatment on survival for LR‐MDS. Our study also aimed to analyze OS, but our results could not avoid the influence of confounding factors related to the retrospective design of this study. As shown in Table 6, AML transformation was a frequent cause of death in the AZA group (26.5%) with large difference compared with that in the non‐AZA group (8.8%). Considering that AZA group contained patients treated after progression to higher‐risk status (22.6%, Table 1), selection bias existed for patients in this group. There would be selection bias in other groups, because of the retrospective style of this study as mentioned above. Interestingly, however, survival of patients in AZA group did not differ by the risk status at the time of AZA administration (Figure S1), suggesting that frequent AML transformation was not directly reflected to shorter survival among these patients. In terms of AEs from AZA, we observed grade 3 or 4 neutropenia in 77.0% of patients, and grade 3 or 4 infection‐related events occurred in more than 20%, which were potentially dangerous for patients. Infection was the most frequent cause of death in both AZA and non‐AZA groups, and the frequency of hemorrhage was higher in the AZA group. This might also relate to AEs for AZA.
In our retrospective study, we could not identify any group of LR‐MDS patients displaying a survival benefit from AZA, and we thus cannot recommend general use of AZA for LR‐MDS, given the certain frequency of serious AEs without any clear survival benefit. Our findings suggested that AZA treatment aiming survival benefit for LR‐MDS could be considered as a clinical trial even for those with TD. Considering confounding and bias of retrospective studies, prospective evaluation is warranted for the role of AZA among LR‐MDS patients.
CONFLICT OF INTEREST
Y. Mi received research funding from Sumitomo Dainippon Pharma Co., LTD., donations from Pfizer Japan Inc, Takeda Pharmaceutical Co. LTD., Chugai Pharmaceutical Co. LTD., and Nippon Shinyaku Co. LTD, and honorarium from Nippon Shinyaku Co. LTD, Kyowa‐Kirin Co LTD, and Celgene Japan Co. LTD. The remaining authors declare no relevant conflicts of interest.
Supporting information
Fig S1
Table S1
ACKNOWLEDGEMENTS
This work was partially supported by the Research Program of Intractable Disease provided by the Ministry of Health, Labor, and Welfare (MHLW) of Japan (H29‐Nanchi‐Ippan‐026 to Y. Mi), MEXT KAKENHI (Grant number 17H04209, 20H03712 to Y. Mi), and the Program of the Network‐type Joint Usage/Research Center for Radiation Disaster Medical Science (to TH, K‐IY, KA, and Y. Mi). We would like to thank Naoko Ito for the preparation of diagnostic samples. Data of this study were obtained from 10 institutions in Nagasaki, Japan; National Hospital Organization Nagasaki Medical Center, Sasebo City General Medical Center, Nagasaki Harbor Medical Center, Japanese Red Cross Nagasaki Genbaku Hospital, Japan Community Health Care Organization Isahaya General Hospital, Saint Francis Hospital, Shimabara Hospital, National Hospital Organization Nagasaki Hospital, and Nagasaki University Hospital.
Toriyama E, Hata T, Yokota K‐I, et al. No clear survival benefit of azacitidine for lower‐risk myelodysplastic syndromes: A retrospective study of Nagasaki. Cancer Sci. 2020;111:4490–4499. 10.1111/cas.14653
REFERENCES
- 1. Tefferi A, Vardiman JW. Myelodysplastic syndromes. N Engl J Med. 2009;361:1872‐1885. [DOI] [PubMed] [Google Scholar]
- 2. Greenberg P, Cox C, LeBeau MM, et al. International scoring system for evaluating prognosis in myelodysplastic syndromes. Blood. 1997;89:2079‐2088. [PubMed] [Google Scholar]
- 3. Greenberg PL, Tuechler H, Schanz J, et al. Revised international prognostic scoring system for myelodysplastic syndromes. Blood. 2012;120:2454‐2465. [DOI] [PMC free article] [PubMed] [Google Scholar]
- 4. Hellström‐Lindberg E, Ahlgren T, Beguin Y, et al. Treatment of anemia in myelodysplastic syndromes with granulocyte colony‐stimulating factor plus erythropoietin: results from a randomized phase II study and long‐term follow‐up of 71 patients. Blood. 1998;92:68‐75. [PubMed] [Google Scholar]
- 5. Aggarwal S, van de Loosdrecht AA, Alhan C, et al. Role of immune responses in the pathogenesis of low‐risk MDS and high‐risk MDS: implications for immunotherapy. Br J Haematol. 2011;153:568‐581. [DOI] [PubMed] [Google Scholar]
- 6. Fenaux P, Platzbecker U, Mufti GJ, et al. Luspatercept in patients with lower‐risk myelodysplastic syndromes. N Engl J Med. 2020;382:140‐151. [DOI] [PubMed] [Google Scholar]
- 7. Toma A, Kosmider O, Chevret S, et al. Lenalidomide with or without erythropoietin in transfusion‐dependent erythropoiesis‐stimulating agent‐refractory lower‐risk MDS without 5q deletion. Leukemia. 2016;30:897‐905. [DOI] [PubMed] [Google Scholar]
- 8. Fenaux P, Mufti GJ, Hellstrom‐Lindberg E, et al. Efficacy of azacitidine compared with that of conventional care regimens in the treatment of higher‐risk myelodysplastic syndromes: a randomised, open‐label, phase III study. Lancet Oncol. 2009;10:223‐232. [DOI] [PMC free article] [PubMed] [Google Scholar]
- 9. Silverman LR, Demakos EP, Peterson BL, et al. Randomized controlled trial of azacitidine in patients with the myelodysplastic syndrome: a study of the cancer and leukemia group B. J Clin Oncol. 2002;20:2429‐2440. [DOI] [PubMed] [Google Scholar]
- 10. Lyons RM, Cosgriff TM, Modi SS, et al. Hematologic response to three alternative dosing schedules of azacitidine in patients with myelodysplastic syndromes. J Clin Oncol. 2009;27:1850‐1856. [DOI] [PubMed] [Google Scholar]
- 11. Musto P, Maurillo L, Spagnoli A, et al. Ad Hoc Italian Cooperative Study Group on Azacitidine in Myelodysplastic Syndromes Acute Leukemias. Azacitidine for the treatment of lower risk myelodysplastic syndromes: a retrospective study of 74 patients enrolled in an Italian named patient program. Cancer. 2010;116:1485‐1494. [DOI] [PubMed] [Google Scholar]
- 12. Falantes J, Delgado RG, Calderón‐Cabrera C, et al. Spanish Group of Myelodysplastic Syndromes (GESMD). Multivariable time‐dependent analysis of the impact of azacitidine in patients with lower‐risk myelodysplastic syndrome and unfavorable specific lower‐risk score. Leuk Res. 2015;39:52‐57. [DOI] [PubMed] [Google Scholar]
- 13. Lee JH, Kim YJ, Sohn SK, et al. Benefits of hypomethylating therapy in IPSS lower‐risk myelodysplastic syndrome patients: a retrospective multicenter case series study. Leuk Res. 2017;60:135‐144. [DOI] [PubMed] [Google Scholar]
- 14. Baek DW, Lee YJ, Kim H, et al. Response to hypomethylating agents improves long‐term outcomes for lower‐risk patients with myelodysplastic syndrome in case‐matched cohorts. Ann Hematol. 2018;97:2309‐2317. [DOI] [PubMed] [Google Scholar]
- 15. Tobiasson M, Dybedahl I, Holm MS, et al. Limited clinical efficacy of azacitidine in transfusion‐dependent, growth factor‐resistant, low‐ and Int‐1‐risk MDS: results from the nordic NMDSG08A phase II trial. Blood Cancer J. 2014;4:e189. [DOI] [PMC free article] [PubMed] [Google Scholar]
- 16. Jabbour E, Short NJ, Montalban‐Bravo G, et al. Randomized phase 2 study of low‐dose decitabine vs low‐dose azacitidine in lower‐risk MDS and MDS/MPN. Blood. 2017;130:1514‐1522. [DOI] [PMC free article] [PubMed] [Google Scholar]
- 17. Filì C, Malagola M, Follo MY, et al. Prospective phase II Study on 5‐days azacitidine for treatment of symptomatic and/or erythropoietin unresponsive patients with low/INT‐1‐risk myelodysplastic syndromes. Clin Cancer Res. 2013;19:3297‐3308. [DOI] [PubMed] [Google Scholar]
- 18. Morita Y, Maeda Y, Yamaguchi T, et al. Five‐day regimen of azacitidine for lower‐risk myelodysplastic syndromes (refractory anemia or refractory anemia with ringed sideroblasts): a prospective single‐arm phase 2 trial. Cancer Sci. 2018;109:3209‐3215. [DOI] [PMC free article] [PubMed] [Google Scholar]
- 19. Sanchez‐Garcia J, Falantes J, Medina Perez A, et al. Prospective randomized trial of 5 days azacitidine versus supportive care in patients with lower‐risk myelodysplastic syndromes without 5q deletion and transfusion‐dependent anemia. Leuk Lymphoma. 2018;59:1095‐1104. [DOI] [PubMed] [Google Scholar]
- 20. Bennett JM, Catovsky D, Daniel MT, et al. Proposals for the classification of the myelodysplastic syndromes. Br J Haematol. 1982;51:189‐199. [PubMed] [Google Scholar]
- 21. Vardiman JW, Thiele J, Arber DA, et al. The 2008 revision of the WHO classification of myeloid neoplasms and acute leukemia, rationale and important changes. Blood. 2009;114:937‐951. [DOI] [PubMed] [Google Scholar]
- 22. Charlson ME, Pompei P, Ales K, et al. A new method of classifying prognostic comorbidity in longitudinal studies: development and validation. J Chronic Dis. 1987;40:373‐383. [DOI] [PubMed] [Google Scholar]
- 23. Della Porta MG, Malcovati L, Strupp C, et al. Risk stratification based on both disease status and extra‐hematologic comorbidities in patients with myelodysplastic syndrome. Haematologica. 2011;96:441‐449. [DOI] [PMC free article] [PubMed] [Google Scholar]
- 24. Cheson BD, Greenberg PL, Bennett JM, et al. Clinical application and proposal for modification of the International Working Group (IWG) response criteria in myelodysplasia. Blood. 2006;108:419‐425. [DOI] [PubMed] [Google Scholar]
- 25. Kaplan EL, Meier P. Nonparametric estimation from incomplete observations. J Am Stat Assoc. 1958;43:457‐481. [Google Scholar]
- 26. Kanda Y. Investigation of the freely available easy‐to‐use software ‘EZR’ for medical statistics. Bone Marrow Transplant. 2013;48:452‐458. [DOI] [PMC free article] [PubMed] [Google Scholar]
- 27. Matsuo E, Miyazaki Y, Tsutsumi C, et al. Imatinib provides durable molecular and cytogenetic responses in a practical setting for both newly diagnosed and previously treated chronic myelogenous leukemia: a study in nagasaki prefecture, Japan. Int J Hematol. 2007;85:132‐139. [DOI] [PubMed] [Google Scholar]
- 28. Malcovati L, Germing U, Kuendgen A, et al. Time‐dependent prognostic scoring system for predicting survival and leukemic evolution in myelodysplastic syndromes. J Clin Oncol. 2007;25:3503‐3510. [DOI] [PubMed] [Google Scholar]
Associated Data
This section collects any data citations, data availability statements, or supplementary materials included in this article.
Supplementary Materials
Fig S1
Table S1