

Abstract
Some cancers are related to atherosclerotic diseases; therefore, these two types of disease may share some antibody biomarkers in common. To investigate this, a first screening of sera was performed from patients with esophageal squamous cell carcinoma (ESCC) or acute ischemic stroke (AIS) for serological identification of antigens using recombinant cDNA expression cloning (SEREX). The amplified luminescent proximity homogeneous assay‐linked immunosorbent assay (AlphaLISA) method, which incorporates glutathione donor beads and anti‐human IgG acceptor beads, was used to evaluate serum antibody levels. SEREX screening identified low‐density lipoprotein receptor–related protein–associated protein 1 (LRPAP1) as a target antigen of serum IgG antibodies in the sera of patients with ESCC or AIS. Antigens, including recombinant glutathione S‐transferase–fused LRPAP1 protein, were prepared to examine serum antibody levels. AlphaLISA revealed significantly higher antibody levels against the LRPAP1 protein in patients with solid cancers such as ESCC and colorectal carcinoma and some atherosclerosis‐related diseases such as AIS and diabetes mellitus compared with healthy donors. Correlation analysis revealed that the elevated serum antibody levels against LRPAP1 were associated with smoking, a well‐known risk factor for both cancer and atherosclerosis. Serum LRPAP1 antibody is therefore a common marker for the early diagnosis of some cancers and atherosclerotic diseases and may reflect diseases caused by habitual smoking.
Keywords: antibody biomarker, atherosclerosis, colorectal carcinoma, esophageal squamous cell carcinoma, gastric cancer
Some cancers and arteriosclerosis may share some antibody biomarkers in common. To investigate this, a first screening of sera was performed from patients with esophageal squamous cell carcinoma for SEREX. Serum LRPAP1 antibody is a useful marker for the early diagnosis of some cancers and atherosclerotic diseases.

1. INTRODUCTION
Cancer biomarkers are indispensable for diagnosing cancer at an early stage, monitoring during treatment, and making prognoses. In addition to enzyme, antigen, nucleic acid, and antibody markers have recently attracted attention. Anti‐p53 is a typical antibody marker that is useful for cancer diagnosis, monitoring, and prediction, in particular for esophageal squamous cell carcinoma (ESCC) and head and neck cancer. 1 , 2 , 3 , 4 , 5 Our group has searched for antibody markers of ESCC via serological identification of antigens using the recombinant cDNA expression cloning (SEREX) method and has previously reported the discovery of antibodies against Trop2/TACSTD2, 6 SLC2A1, 7 TRIM21, 8 myomegalin, 9 makorin 1, 10 ECSA, 11 and cyclin L2 (CCNL2) 12 for ESCC; anti‐FIR/PUF60 for ESCC 13 and colon cancer 14 ; and anti‐SH3GL1 15 and anti‐filamin C 16 for glioma.
It is known that autoantibodies develop in patients with atherosclerotic diseases such as acute ischemic stroke (AIS) and acute myocardial infarction (AMI). For example, there are antibodies against Hsp60, 17 RPA2, 18 SOSTDC1, 19 PDCD11, 20 MMP1, CBX1, and CBX5 21 for AIS; ATP2B4, 22 BMP‐1, 18 , 22 DHPS, 23 SH3BP5, 24 and prolylcarboxypeptidase 25 for atherosclerosis; nardilysin (NRD1) 26 for acute coronary syndrome; and TUBB2C, 27 insulin, 28 glutamic acid decarboxylase, 29 adiponectin, 30 and GADD 31 for diabetes mellitus (DM).
On the other hand, it was reported some time ago that atherosclerosis may be linked to cancer to varying degrees. For example, patients with esophageal, stomach, intestinal, or lung cancer have more severe coronary atherosclerotic blockage. 32 The degree of atherosclerosis of the coronary arteries and aorta was positively and significantly related to the presence, size, multiplicity, and degree of atypia of adenomatous polyps. 33 Diabetes was shown to be a risk factor linked with pancreatic, 34 colorectal, 35 endometrial, 36 and prostate cancer. 37 More recently, the prevalence of colorectal adenoma was found to be greater in patients with low‐grade coronary atherosclerosis or significant coronary artery disease, 38 suggesting a molecular connection between atherogenesis and tumorigenesis.
In the present study, we report the anti–lipoprotein receptor–related protein–associated protein 1 (LRPAP1) antibody (LRPAP1‐Ab) as a common marker of digestive organ cancers and atherosclerosis‐related diseases.
2. MATERIALS AND METHODS
2.1. Patient and healthy donor (HD) sera
This study was approved by the Local Ethical Review Boards of the Toho University Graduate School of Medicine and of the Chiba University Graduate School of Medicine (Chiba, Japan) as well as the review boards of cooperating hospitals. Serum was collected from patients who had provided written informed consent. Each serum sample was centrifuged at 2000 g for 10 minutes, and the supernatant was stored at −80°C until use. Repeated thawing and freezing of samples was avoided.
Serum samples from patients with ESCC, gastric cancer (GC), colorectal carcinoma (CRC), or lung cancer (LC) were obtained from Toho University, Omori Medical Center. Samples from patients with DM were obtained from Chiba University Hospital, and samples from patients with AIS, transient ischemic attack (TIA), asympt‐CI, or deep and subcortical white matter hyperintensity (DSWMH) were obtained from Chiba Prefectural Sawara Hospital and Chiba Rosai Hospital. Sera from patients with cardiovascular disease (CVD) were obtained from Kyoto University Hospital. 26 Serum samples associated with AIS, TIA, and AMI were obtained within 2 weeks of disease onset. Sera of HDs were obtained from Port Square Kashiwado Clinic, Higashi Funabashi Hospital, Chiba Prefectural Sawara Hospital, Chiba University, and Shimoshizu Hospital. HDs from Port Square Kashiwado Clinic, Higashi Funabashi Hospital, and Chiba Prefectural Sawara Hospital were selected from among participants who exhibited no abnormalities on cranial magnetic resonance imaging.
2.2. SEREX screening
We performed immunoscreening by using a modified version of previously published methods. In order to screen for clones that were immunoreactive against sera of patients with ESCC or AIS, we used a human ESCC cell line T.Tn cDNA library in λZAP II phage 6 , 7 , 8 , 9 , 10 , 11 , 12 and a human aortic endothelial cell cDNA library in Uni‐ZAP XR Premade Library (Stratagene). 20 , 21 Escherichia coli (E coli) XL1‐Blue MRFʹ was infected with Uni‐ZAP XR phage. The expression of resident cDNA clones was induced after blotting infected bacteria onto nitrocellulose membranes (NitroBind, Osmonics), which were pretreated with 10 mmol/L isopropyl‐β‐D‐thiogalactoside (IPTG; Wako Pure Chemicals) for 30 minutes. The membranes with bacterial proteins were washed three times with TBS‐T (20 mmol/L Tris–HCl [pH 7.5], 0.15 mol/L NaCl, and 0.05% Tween‐20). Subsequently, we blocked nonspecific binding by incubating the membranes with 1% protease‐free bovine serum albumin (Nacalai Tesque, Inc) in TBS‐T for 1 hour. The membranes were incubated overnight with 1:2000 diluted sera of patients. Following three washes with TBS‐T, the membranes were incubated for 1 hour with 1:5000 diluted alkaline phosphatase–conjugated goat anti‐human IgG (Jackson ImmunoResearch Laboratories). We visualized positive reactions by incubating membranes in a color development solution (100 mmol/L Tris–HCl [pH 9.5], 100 mmol/L NaCl, and 5 mmol/L MgCl2). The solution contained 0.15 mg/mL 5‐bromo‐4‐chloro‐3‐indolyl phosphate (Wako Pure Chemicals) and 0.3 mg/mL nitro blue tetrazolium (Wako Pure Chemicals). To obtain monoclonality, positive clones were recloned two additional times, as previously described. 6 , 7 , 8 , 9 , 10 , 11 , 12 , 21
2.3. Sequence analysis of identified antigens
We converted the monoclonalized phage cDNA clones to pBluescript phagemids by in vitro excision using ExAssist helper phage (Stratagene). Plasmid DNA was obtained from the E coli SOLR strains transformed by the phagemids. Following sequencing of inserted cDNAs, homologous analysis was performed using a public database provided by the National Center for Biotechnology Information (https://blast.ncbi.nlm.nih.gov/Blast.cgi).
2.4. Expression and purification of LRPAP1 protein
Amino‐terminals (amino acids 1‐275) of coding sequences of LRPAP1 cDNA were recombined into the EcoRI/XhoI site of pGEX‐4T‐3 (GE Healthcare Life Sciences), followed by confirmation by DNA sequencing. Expression of the cDNA product was induced by treating pGEX‐4T‐3‐LRPAP1–transformed E coli with 0.1 mmol/L IPTG for 4 hours at 25°C; the cells were subsequently lysed in BugBuster Master Mix (Merck Millipore). Glutathione S‐transferase (GST)‐tagged LRPAP1 protein was purified by glutathione‐Sepharose (GE Healthcare Life Sciences) column chromatography according to the manufacturer's instructions and dialyzed against phosphate‐buffered saline, as previously described. 18 , 21 , 23
2.5. Western blotting analysis
GST‐tagged LRPAP1 as well as GST was purified as described above. GST and GST‐LRPAP1 proteins (0.3 μg) were separated by SDS‐polyacrylamide gel electrophoresis and electrically transferred onto nitrocellulose membranes (Advantec). The membranes were blocked using blocking solution (0.5% skim milk powder in a buffer comprising 20 mmol/L Tris–HCl [pH 7.6], 137 mmol/L NaCl, and 0.1% Tween 20), and the blotted proteins were probed with primary antibodies including anti‐GST (goat; Rockland), anti‐LRPAP1 (rabbit; Aviva Systems Biology), or sera from HDs or patients with ESCC (#4 and #5). After incubation with horseradish peroxidase (HRP)‐conjugated secondary antibodies (anti‐goat IgG, anti‐rabbit IgG, and anti‐human IgG (Santa Cruz Biotechnology), immunoreactivity was detected using Immobilon™ Western HRP Substrate (Merck KGaA), as previously described. 6 , 7 , 8 , 9 , 10 , 11 , 12 , 23
2.6. Amplified luminescence proximity homogeneous assay (AlphaLISA)
AlphaLISA was performed in 384‐well microtiter plates (white opaque OptiPlate™, Perkin Elmer) containing either 2.5 µL 1:100‐diluted serum with 2.5 µL GST or GST‐LRPAP1 protein (10 µg/mL) in AlphaLISA buffer (25 mmol/L HEPES, pH 7.4, 0.1% casein, 0.5% Triton X‐100, 1 mg/mL dextran‐500, and 0.05% ProClin‐300). The reaction mixture was incubated at room temperature for 6‐8 hours, following which anti‐human IgG–conjugated acceptor beads (2.5 µL at 40 µg/mL) and glutathione‐conjugated donor beads (2.5 µL at 40 µg/mL) were added and incubated prior to another incubation at room temperature in the dark for 1‐14 days. Chemical emissions were read on an EnSpire Alpha microplate reader (PerkinElmer), as previously described. 19 , 20 , 21 , 22 , 23 , 24 , 25 Specific reactions were calculated by subtracting the alpha counts of the GST control from the counts of GST‐fusion proteins.
2.7. Immunohistochemical staining
Formalin‐fixed paraffin‐embedded ESCC tissues were sectioned at 4‐µm thickness. The sections were deparaffinized, pretreated with Cell Conditioning 1 (CC1, Ventana Medical Systems), reacted with primary anti‐LRPAP1 antibodies (rabbit polyclonal antibodies, Atlas Antibodies) at 2 µg/mL for 32 minutes at room temperature, visualized by Ventana's DAB detection kit (iView DAB detection kit, Ventana Medical Systems), and counter stained with Hematoxylin II (Ventana Medical Systems) and Bluing Reagent (Ventana Medical Systems).
2.8. Statistical analyses
The Mann‐Whitney U test was used to determine significant differences between two groups. The Kruskal‐Wallis test was used to evaluate differences among more than three groups. Survival curves were calculated using the Kaplan‐Meier method. Correlations were calculated using Spearman’s correlation analysis. All statistical analyses were performed using GraphPad Prism 5 (GraphPad Software). The predictive values of putative disease markers were assessed via a receiver‐operating characteristic (ROC) curve analysis, and the cutoff values were set to maximize the sums of sensitivity and specificity. All tests were two‐tailed, and P values of <0.05 were considered statistically significant.
3. RESULTS
3.1. Recognition of LRPAP1 by serum components of patients with ESCC or AIS
SEREX screening identified an antigen recognized by antibodies in the sera of both patients with ESCC and those with AIS; this antigen was low‐density LRPAP1 (Accession Number: NM_002337). Subsequently, GST‐fused LRPAP1, which contained full‐length LRPAP1 protein, was expressed in E coli and purified by affinity chromatography.
3.2. Presence of serum antibodies against purified proteins in patients with ESCC
Using Western blotting, we confirmed the presence of antibodies against GST‐fusion LRPAP1 protein in sera from patients with ESCC. GST and GST‐LRPAP1 were recognized by anti‐GST antibodies as reactions of 26‐ and 64‐kDa proteins, respectively (Figure 1). Conversely, GST‐LRPAP1, but not GST, reacted with commercial anti‐LRPAP1 antibody and the serum antibodies of ESCC patients #4 and #5.
Figure 1.
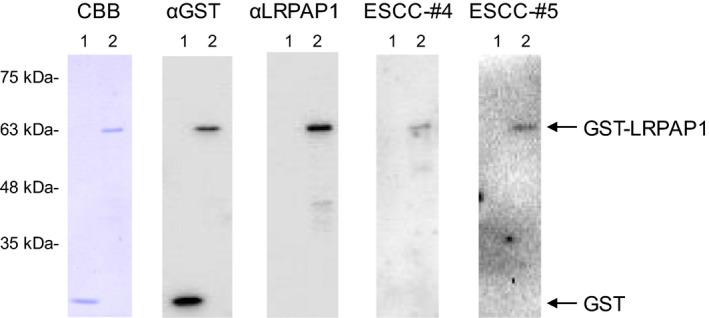
Presence of antibodies against LRPAP1 protein in sera from patients with esophageal squamous cell carcinoma (ESCC). Purified proteins of glutathione S‐transferase (GST) (lane 1) and GST‐LRPAP1 (lane 2) were separated through SDS‐polyacrylamide gel electrophoresis, followed by Western blotting analysis using anti‐GST (αGST), anti‐LPPAP1 (αLRPAP1), and sera from patients with ESCC (ESCC‐#4 and ESCC‐#5). Coomassie Brilliant Blue (CBB) staining profile is also shown. Positions of molecular weight markers are shown at the left
3.3. Serum levels of LRPAP1‐Abs in ESCC, GC, and CRC
We examined the levels of LRPAP1‐Abs in the sera of patients with ESCC, GC, and CRC obtained from Toho University, Omori Medical Center. Sera of HDs were obtained from Port Square Kashiwado Clinic and Higashi Funabashi Hospital. The average ages (± SDs) of HDs and patients with ESCC, GC, or CRC were 57.05 ± 7.79, 67.01 ± 10.65, 68.14 ± 10.91, and 66.65 ± 11.64, respectively. Sample numbers of males/females of HDs, and patients with ESCC, GC, or CRC were 104/88, 155/37, 137/55, and 118/74, respectively. The AlphaLISA results demonstrated that serum antibody levels against the LRPAP1 protein were significantly higher in patients with ESCC, GC, or CRC than in HDs (Figure 2A). At a cutoff value of the average HD value +2 SD, the LRPAP1‐Ab positivity rates in HDs and patients with ESCC, GC, or CRC were found to be 1.1%, 10.9%, 3.6%, and 6.8%, respectively (Table 1). The antibody levels were highest in patients with ECSS compared with other patients and HDs, which may be related to the fact that LRPAP1 was identified by SEREX screening using sera of patients with ESCC. The LRPAP1‐Ab levels were also higher in patients with LC than those in HDs (Figure S1).
Figure 2.
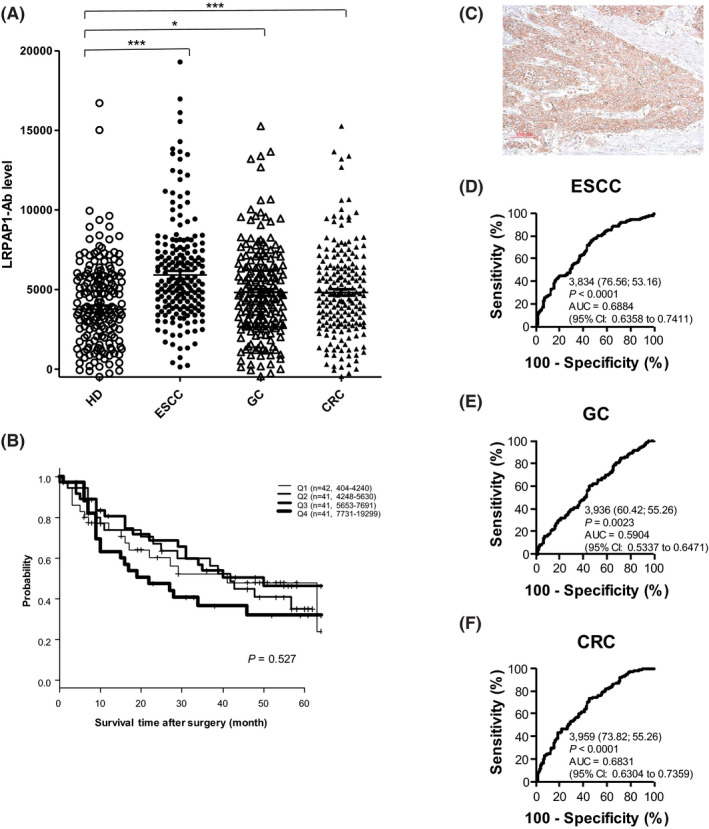
Comparison of serum anti‐LRPAP1 antibody (LRPAP1‐Ab) levels between healthy donor (HDs) and patients with esophageal squamous cell carcinoma (ESCC), gastric cancer (GC), and colorectal carcinoma (CRC). A, Amplified luminescence proximity homogeneous assay (AlphaLISA)‐determined serum antibody levels against LRPAP1‐GST after subtraction of the levels against those of control GST are shown. The bars represent the median. P values were calculated by the Kruskal‐Wallis test. *P < 0.05; ***P < 0.001. The total (male/female) numbers, average values, standard deviations, cutoff values, positive numbers, positive rates (%), and P values are summarized and shown in Table 1. B, Comparison of overall survival among four quartiles of LRPAP1‐Ab levels. Kaplan‐Meier plots are shown. C, Surgically resected ESCC tissues were stained by means of immunohistochemistry using anti‐LRPAP1 antibody. Receiver‐operating characteristic curve (ROC) analysis was performed to assess the abilities of LRPAP1‐Abs to detect ESCC (D), GC (E), and CRC (F). Numbers in the figures indicate the cutoff values for marker levels, and numbers in parentheses indicate sensitivity (left) and specificity (right). Areas under the curve (AUC) and 95% confidence intervals (CI) are also shown
Table 1.
Comparison of the serum anti‐LRPAP1 antibody (LRPAP1‐Ab) levels of healthy donors (HDs) vs those of patients with esophageal squamous cell carcinoma (ESCC), gastric cancer (GC), or colorectal carcinoma (CRC)
| LRPAP1‐Ab | |
|---|---|
| HD | |
| Average | 3767 |
| SD | 3171 |
| Cutoff value | 10 109 |
| Total no. | 190 |
| Positive no. | 2 |
| Positive rate | 1.1% |
| ESCC | |
| Average | 5915 |
| SD | 3585 |
| Total no. | 192 |
| Positive no. | 21 |
| Positive rate | 10.9% |
| P value (ESCC vs HD) | <0.001 |
| GC | |
| Average | 4816 |
| SD | 2852 |
| Total no. | 192 |
| Positive no. | 7 |
| Positive rate | 3.6% |
| P value (GC vs HD) | <0.05 |
| CRC | |
| Average | 5864 |
| SD | 3334 |
| Total no. | 191 |
| Positive no. | 13 |
| Positive rate | 6.8% |
| P value (CRC vs HD) | <0.001 |
The summary of the serum antibody levels (Alpha luminescent photon count) examined by amplified luminescence proximity homogeneous assay (AlphaLISA) using purified LRPAP1‐GST protein as an antigen are shown. Cutoff values were determined as the average HD values plus two SD, and positive samples for which the Alpha counts exceeded the cutoff value were scored. P values were calculated using the Kruskal‐Wallis test. P values < 0.05 and positive rates >10% are marked in bold. All data of the same results are shown in Figure 2.
3.4. Survival analysis
The LRPAP1‐Ab levels were divided into four groups (lowest first, second, third, and highest fourth quartiles) and analyzed for prognoses. Kaplan‐Meier plotting showed that the highest quartile had poorer prognoses than other groups (Figure 2B). The half survival period of the highest quartile was approximately 22 months, whereas that of other groups was 40‐42 months, although the differences were not significant (P values of the survival of the highest quartile vs the lowest, second, and third quartiles were 0.451, 0.290, and 0.127, respectively).
3.5. Immunohistochemical analysis of antigenic LRPAP1 protein
We examined the expression levels of LRPAP1 antigenic protein in ESCC tissues using immunohistochemical staining. Representative examples of staining are shown in Figure 2C. ESCC tissues were heavily stained by anti‐LRPAP1 antibody, whereas surrounding healthy esophageal tissues were not. The cytoplasmic localization of LRPAP1 protein is consistent with previous reports. 39 Thus, the expression levels of LRPAP1 may account for some, if not all, of the development of serum LRPAP1‐Abs.
3.6. Elevation of serum antibody levels against LRPAP1 in patients with AIS or DM
We examined LRPAP1‐Abs in HDs and patients with AIS, CVD, and DM. Sera of patients with AIS or DM were obtained from Chiba Rosai Hospital and Chiba University Hospital, respectively. Sera of patients with CVDs such as AMI, unstable angina pectoris, effort angina pectoris, and old myocardial infarction were obtained from Kyoto University Hospital. HD sera were obtained from Chiba University, Chiba Prefectural Sawara Hospital, and Shimoshizu Hospital. The average ages (± SDs) of HDs and patients with AIS, CVD, or DM were 44.75 ± 12.38, 67.04 ± 10.80, 65.16 ± 11.19, and 61.25 ± 11.38 years, respectively. The ratios of males to females of HDs, AIS, CVD, and DM patients were 50/46, 73/23, 66/30, and 56/40, respectively. A total of 96 specimens of each of HDs, AIS, CVD, and type II DM patients were simultaneously assayed by AlphaLISA on a 384‐well plate. The levels of LRPAP1‐Abs were significantly higher in patients with AIS or DM, but not CVD, compared with those in HDs (Figure 3A). At a cutoff value of the average HD value +2 SD, the positive rates were 4.2% in HDs, 12.5% in AIS, 11.5% in CVD, and 18.8% in DM patients (Table 2).
Figure 3.
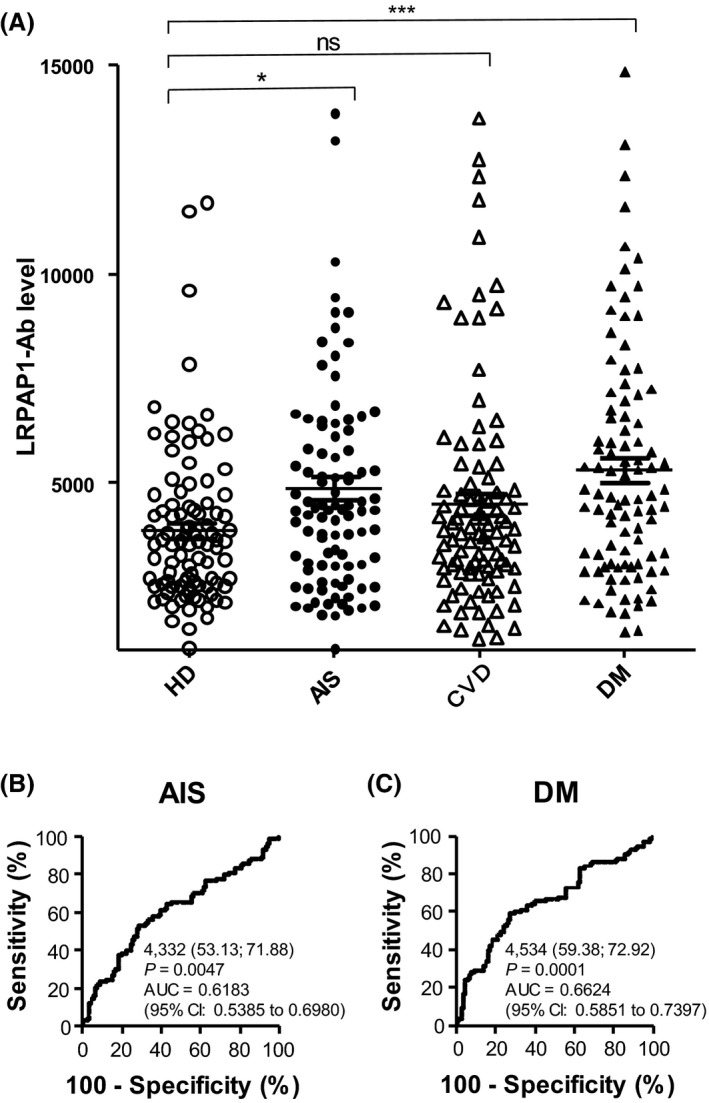
Comparison of serum anti‐LRPAP1 antibody (LRPAP1‐Abs) levels between healthy donors (HDs) and patients with acute myocardial infarction (AMI) and diabetes mellitus (DM). A, Serum antibody levels in HD and patients with acute ischemic stroke (AIS), cardiovascular disease (CVD), and diabetes mellitus (DM) were determined by amplified luminescence proximity homogeneous assay (AlphaLISA), and are shown as described in Figure 2. The same results are summarized in Table 2. The abilities of LRPAP1‐Abs to detect AIS (B) and DM (C) were also evaluated using ROC analysis. *P < 0.05; ***P < 0.001. ns, not significant
Table 2.
Comparison of serum anti‐LRPAP1 antibody (LRPAP1‐Ab) levels between healthy donors (HDs) and patients with acute ischemic stroke (AIS), cardiovascular disease (CVD), and diabetes mellitus (DM) examined by amplified luminescence proximity homogeneous assay (AlphaLISA)
| LRPAP1‐Ab | |
|---|---|
| HD | |
| Average | 3869 |
| SD | 1920 |
| Cutoff value | 7709 |
| Total no. | 96 |
| Positive no. | 4 |
| Positive rate | 4.2% |
| AIS | |
| Average | 4873 |
| SD | 2743 |
| Total no. | 96 |
| Positive no. | 12 |
| Positive rate | 12.5% |
| P value (AIS vs HD) | <0.05 |
| CVD | |
| Average | 4493 |
| SD | 2626 |
| Total no. | 96 |
| Positive no. | 11 |
| Positive rate | 11.5% |
| P value (CVD vs HD) | ns |
| DM | |
| Average | 5312 |
| SD | 2809 |
| Total no. | 96 |
| Positive no. | 18 |
| Positive rate | 18.8% |
| P value (DM vs HD) | <0.001 |
3.7. Elevation of LRPAP1‐Abs levels in patients with stroke
We examined further the levels of LRPAP1‐Abs in 696 sera from controls and stroke patients, including 226 specimens from HDs, 228 from patients with AIS, 44 from patients with TIA, 17 from patients with asymptomatic cerebral infarction (asympt‐CI), 122 from patients with DSWMH, and 59 from patients with chronic‐phase cerebral infarction (cCI), all of which were obtained from Chiba Prefectural Sawara Hospital. The AlphaLISA results demonstrated that the serum antibody levels against LRPAP1 protein were significantly higher in patients with AIS or TIA, but not in other groups, compared with HDs (Figure 4A). Using cutoff values determined as described in the previous section, the LRPAP1‐Ab positivity rates in HDs and patients with AIS, TIA, asympt‐CI, DSWMH, or cCI were found to be 3.5%, 6.1%, 13.6%, 0.0%, 1.6%, and 10.2%, respectively (Table 2). Patients with TIA showed the highest levels of LRPAP1‐Ab in serum among the groups examined (Table 3). Therefore, elevated LRPAP1‐Ab levels may reflect the cause but not the result of stroke.
Figure 4.
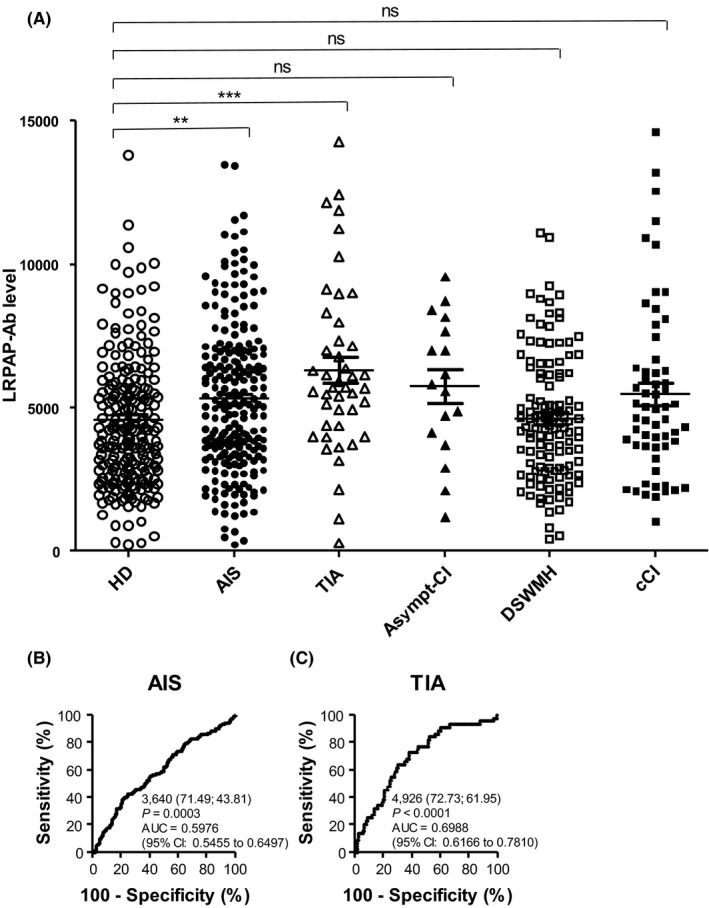
Comparison of serum anti‐LRPAP1 antibody (LRPAP1‐Ab) levels between healthy donors (HDs) and patients with acute ischemic stroke (AIS), transient ischemic attack (TIA), asymptomatic cerebral infarction (asympt‐CI), deep and subcortical white matter hyperintensity (DSWMH), and chronic‐phase cerebral infarction (cCI). A, Serum antibody levels were determined by amplified luminescence proximity homogeneous assay (AlphaLISA) and are shown as described in the legend of Figure 2. The abilities of LRPAP1‐Abs to detect AIS (B) and TIA (C) were also evaluated using receiver‐operating characteristic (ROC) analysis. **P < 0.01; ***P < 0.001. ns, not significant
Table 3.
Comparison of serum anti‐LRPAP1 antibody (LRPAP1‐Ab) levels between healthy donors (HDs) and patients with AIS, transient ischemic attack (TIA), asymptomatic cerebral infarction (asympt‐CI), deep and subcortical white matter hyperintensity (DSWMH), and chronic‐phase CI (cCI) examined by amplified luminescence proximity homogeneous assay (AlphaLISA)
| LRPAP1‐Ab | |
|---|---|
| HD | |
| Average | 4564 |
| SD | 2659 |
| Cutoff value | 9882 |
| Total no. | 226 |
| Positive no. | 8 |
| Positive rate | 3.5% |
| AIS | |
| Average | 5299 |
| SD | 2625 |
| Total no. | 228 |
| Positive no. | 14 |
| Positive rate | 6.1% |
| P value (AIS vs HD) | <0.01 |
| TIA | |
| Average | 6308 |
| SD | 2985 |
| Total no. | 44 |
| Positive no. | 6 |
| Positive rate | 13.6% |
| P value (TIA vs HD) | <0.001 |
| Asympt‐CI | |
| Average | 5747 |
| SD | 2423 |
| Total no. | 17 |
| Positive no. | 0 |
| Positive rate | 0.0% |
| P value (Asympt‐CI vs HD) | ns |
| DSWMH | |
| Average | 4621 |
| SD | 2207 |
| Total no. | 122 |
| Positive no. | 2 |
| Positive rate | 1.6% |
| P value (DSWMH vs HD) | ns |
| cCI | |
| Average | 5474 |
| SD | 3017 |
| Total no. | 59 |
| Positive no. | 6 |
| Positive rate | 10.2% |
| P value (cCI vs HD) | ns |
3.8. ROC analysis
The results of the ROC curve analysis are shown in Figures 2D‐F, 3B,C, and 4B,C, which show areas under the curve (AUC), 95% confidence intervals (CI), cutoff values, sensitivity, specificity, and P values. Serum LRPAP1‐Ab levels showed high AUC values against ESCC, CRC, DM, and TIA, of 0.6884, 0.6831, 0.6624, and 0.6988, respectively. The AUC against LC was 0.6359 (Figure S1B), which was somewhat higher than those against GC and AIS.
3.9. Correlation analysis
A comparative analysis of serum LRPAP1‐Ab levels and participant data was performed using the same samples as shown in Figure 4A, from Chiba Prefectural Sawara Hospital. The antibody levels were then compared between male and female participants; with or without obesity; with or without diseases including DM, hypertension (HT), CVD, and dyslipidemia; and with or without smoking and alcohol intake habits. Comparisons using the Mann‐Whitney U test revealed that LRPAP1‐Ab levels were significantly higher in smokers compared with nonsmokers (Table 4). None of the other categories showed any significant differences in LRPAP1‐Ab levels.
Table 4.
Correlation analysis of antibody levels against LRPAP1‐GST protein with data of subjects of the Sawara Hospital cohort
| Sex | Male | Female |
|---|---|---|
| Sample number | 395 | 270 |
| LRPAP1‐Ab level | ||
| Average | 5140 | 5051 |
| SD | 2712 | 2693 |
| P value (vs male) | 0.669 | |
| Obesity | BMI < 25 | BMI ≥ 25 |
|---|---|---|
| Sample number | 498 | 158 |
| LRPAP1‐Ab level | ||
| Average | 5138 | 5069 |
| SD | 2661 | 2856 |
| P value (vs male) | 0.670 | |
| Other disease | DM− | DM+ |
|---|---|---|
| Sample number | 525 | 135 |
| LRPAP1‐Ab level | ||
| Average | 5052 | 5338 |
| SD | 2702 | 2688 |
| P value (vs DM−) | 0.143 | |
| Other disease | HT− | HT+ |
|---|---|---|
| Sample number | 239 | 421 |
| LRPAP1‐Ab level | ||
| Average | 4914 | 5221 |
| SD | 2615 | 2743 |
| P value (vs HT−) | 0.153 | |
| Other disease | CVD− | CVD+ |
|---|---|---|
| Sample number | 623 | 37 |
| LRPAP1‐Ab level | ||
| Average | 5114 | 5051 |
| SD | 2686 | 2963 |
| P value (vs CVD−) | 0.754 | |
| Other disease | Lipidemia− | Lipidemia+ |
|---|---|---|
| Sample number | 475 | 185 |
| LRPAP1‐Ab level | ||
| Average | 5102 | 5131 |
| SD | 2629 | 2882 |
| P value (vs Lipidemia−) | 0.855 | |
| Lifestyle | Nonsmoker | Smoker |
|---|---|---|
| Sample number | 344 | 319 |
| LRPAP1‐Ab level | ||
| Average | 4702 | 5542 |
| SD | 2331 | 2999 |
| P value (vs nonsmoker) | 0.0006 | |
| Lifestyle | Alcohol− | Alcohol+ |
|---|---|---|
| Sample number | 238 | 419 |
| LRPAP1‐Ab level | ||
| Average | 4748 | 5307 |
| SD | 2386 | 2859 |
| P value (vs Alcohol−) | 0.051 | |
The subjects were divided as follows: sex (male and female); obesity, presence (+) or absence (−) of complication of diabetes mellitus (DM), hypertension (HT), cardiovascular disease (CVD), dyslipidemia, and lifestyle factors (smoking and alcohol intake habits). Antibody levels (Alpha counts) were compared using the Mann‐Whitney U test (lower panels). Sample numbers, averages and SDs of counts as well as P values are shown. Significant correlations (P < 0.05) are marked in bold text.
Spearman's rank‐order correlation analysis was performed to determine if there were any correlations between serum antibody levels against the LRPAP1 protein and participant parameters, including general information such as age, height, weight, body mass index (BMI), and the degree of artery stenosis—the maximum intima‐media thickness (max IMT). The following previously described blood test data were also included: albumin/globulin ratio (A/G), aspartate aminotransferase (AST), alanine amino transferase (ALT), alkaline phosphatase (ALP), lactate dehydrogenase (LDH), leucine aminopeptidase (LAP), total bilirubin (tBil), direct bilirubin (dBil), cholinesterase (CHE), γ‐glutamyl transpeptidase (γ‐GTP), total protein (TP), albumin (ALB), blood urea nitrogen (BUN), creatinine (CRE), estimated glomerular‐filtrating ratio (eGFR), uric acid (UA), thymol turbidity test (TTT), total cholesterol (T‐CHO), high‐density lipoprotein cholesterol (HDL‐C), triglyceride (TG), creatine kinase (CK), potassium (K), chlorine (Cl), calcium (Ca), inorganic phosphate (IP), iron (Fe), C‐reactive protein (CRP), low‐density lipoprotein cholesterol (LDL‐C), white blood cell (WBC), red blood cell (RBC), hemoglobin (HGB), hematocrit (HCT), mean corpuscular volume (MCV), mean corpuscular hemoglobin (MCH), mean corpuscular hemoglobin concentration (MCHC), red‐cell distribution width (RDW), platelet (PLT), mean platelet volume (MPV), procalcitonin (PCT), platelet distribution width (PDW), glucated hemoglobin (HbA1c), blood sugar (BS), smoking period, and alcohol intake frequency.
The serum LRPAP1‐Ab levels were most closely correlated with smoking period (P < 0.0001) and partly related to WBC number (P = 0.0074) and PCT (P = 0.0386; Table 5). Although LRPAP1‐Ab levels were elevated in patients with DM (Figure 3A), there was no apparent correlation between HbA1c and antibody levels (P = 0.3101), suggesting that LRPAP1‐Ab levels do not directly reflect DM but may indirectly reflect lesions caused by DM.
Table 5.
Correlation analysis of serum antibody levels against purified LRPAP1‐GST protein with data of subjects of the Sawara Hospital cohort
| r value | P value | |
|---|---|---|
| Age | 0.0361 | 0.3543 |
| Height (cm) | −0.0322 | 0.4101 |
| Weight (kg) | −0.0342 | 0.3797 |
| BMI | −0.0133 | 0.7334 |
| max IMT | 0.0744 | 0.1121 |
| A/G | 0.0593 | 0.1379 |
| AST | 0.0247 | 0.5289 |
| ALT | 0.0272 | 0.4870 |
| ALP | 0.0453 | 0.2675 |
| LDH | −0.0084 | 0.8340 |
| LAP | 0.0183 | 0.7380 |
| tBil | 0.0510 | 0.1987 |
| dBil | 0.0192 | 0.7487 |
| γ‐GTP | 0.0352 | 0.3854 |
| TP | −0.0189 | 0.6359 |
| ALB | 0.0272 | 0.4929 |
| BUN | −0.0453 | 0.2477 |
| CRE | −0.0287 | 0.4660 |
| eGFR | 0.0653 | 0.1253 |
| UA | −0.0062 | 0.8903 |
| TTT | 0.1106 | 0.0586 |
| T‐CHO | −0.0408 | 0.3344 |
| HDL‐C | −0.0175 | 0.7153 |
| TG | −0.0318 | 0.4960 |
| CK | 0.0061 | 0.9328 |
| K | −0.0541 | 0.1710 |
| Cl | −0.0356 | 0.3688 |
| Ca | −0.0705 | 0.1701 |
| IP | −0.0214 | 0.7105 |
| Fe | 0.0358 | 0.5296 |
| CRP | 0.0439 | 0.3393 |
| LDL‐C | −0.0418 | 0.4392 |
| WBC | 0.1049 | 0.0074 |
| RBC | 0.0456 | 0.2458 |
| HGB | 0.0674 | 0.0860 |
| HCT | 0.0617 | 0.1164 |
| MCV | 0.0432 | 0.2714 |
| MCH | 0.0613 | 0.1183 |
| MCHC | 0.0433 | 0.2709 |
| RDW | −0.0240 | 0.5409 |
| PLT | 0.0655 | 0.0950 |
| MPV | −0.0005 | 0.9894 |
| PCT | 0.0812 | 0.0386 |
| PDW | 0.0006 | 0.9885 |
| HbA1c | −0.0453 | 0.3101 |
| BS | 0.0585 | 0.1537 |
| Smoking period (y) | 0.1858 | <0.0001 |
| Alcohol frequency (time/wk) | 0.0323 | 0.4066 |
Correlation coefficients (r values) and P values obtained through Spearman's correlation analysis are shown. Significant correlations (P < 0.05) are marked in bold text.
4. DISCUSSION
SEREX screening identified LRPAP1 as an antigen recognized by serum IgG in patients with ESCC or atherosclerosis. Subsequent analyses demonstrated higher levels of serum antibodies against the LRPAP1 protein in patients with ESCC, GC, CRC, LC, AIS, TIA, and DM, but not CVD, compared with HDs (Tables 1, 2, 3; Figures 2, 3, 4 and S1). Further comparisons using the Mann‐Whitney U test between LRPAP1‐Ab–positive and –negative groups revealed that smoking was closely associated with LRPAP1‐Ab levels (Table 4). Spearman’s correlation analysis of LRPAP1‐Ab levels and participant parameters also confirmed that the smoking period was correlated with LRPAP1‐Abs (Table 5). The sensitivity of ESCC was higher than that of GC and CRC (Figure 2B‐D), possibly because the esophagus is more susceptible to the effects of smoking than the stomach and colon. 40 , 41
We then examined LRPAP1‐Ab levels in patients with atherosclerosis‐related diseases, because LDL and LDL receptors are closely associated with atherosclerosis. 42 , 43 LRPAP1‐Ab levels were elevated in patients with DM (Figure 3A), whereas they showed no apparent correlation with HbA1c (P = 0.3101) or BS (P = 0.1537; Table 5). Complications arising from DM were not associated with LRPAP1‐Ab levels (Table 4). These findings suggest that LRPAP1‐Ab levels do not directly reflect DM but may indirectly reflect the atherosclerotic lesions caused by DM. 44 DM, like smoking, is a risk factor for both cancer and atherosclerosis. It is possible that DM and smoking can cause a similar effect which results in the elevated expression of LRPAP1‐Abs.
Thus far, some common biomarkers for both atherosclerosis‐related diseases and cancer have been reported. The transcription factor 7‐like 2 (TCF7L2) gene, which influences diabetes risk, is associated with incidence of colon cancer. 45 Low circulating adiponectin concentrations are associated with type 2 DM, HT, dyslipidemia, coronary artery disease, stroke, colon cancer, and GC. 46 Serum β‐2 microglobulin (B2M), a major histocompatibility complex class I molecule that is a biomarker of kidney filtration, is associated with increased colorectal cancer risk. 47 Proteomics analysis has revealed proteins related to atherosclerosis formation, including mimecan and cathepsin D, which have been identified as biomarkers of cancerous tumors. 48 Other molecules and genes reported to be involved in both cancer and atherosclerotic diseases include adenosine monophosphate–activated protein kinase (AMPK), peroxisome proliferator–activated receptor‐γ (PPAR‐γ), plasminogen activator inhibitor‐1 (PAI‐1), dual‐specificity tyrosine phosphorylation–regulated kinase 1B (DYRK1B), and methylenetetrahydrofolate reductase (MTHFR). 49 In addition to these genomic, transcriptomic, and proteomic analyses, our immunomic screening has identified a novel marker that cancer and atherosclerotic diseases share in common, LRPAP1‐Ab.
It is well known that low‐density lipoprotein plays an important role in the development of atherosclerosis. 50 Lectin‐like oxidized low‐density lipoprotein receptor‐1 (LOX‐1), which is a major receptor for oxidized low‐density lipoprotein (ox‐LDL), is important for maintaining the transformed state of cancer cells and for tumor growth. 51 Kounnas et al 52 have reported that LRPAP1 binds to both low‐density lipoprotein receptor–related protein 1 (LRP1) and low‐density lipoprotein receptor–related protein 2 (LRP2) and can specifically inhibit ligand binding to these receptors. Variants of not only LRP1 but also LRP6 were associated with an increased risk of ischemic stroke. 53 LRP1, LRP6, and TCF7L2 are involved in the Wnt signaling pathway, which plays an important role in the development of both atherosclerosis and cancer. 54 , 55
Cytoplasmic LRPAP1 has been suggested to act as a chaperone, preventing ligand binding during receptor trafficking. 39 Willnow et al 56 found that the export of LRP2 and very low–density lipoprotein receptor (VLDL) receptors from the ER is impaired in LRPAP1‐deficient mice. Thus, LRPAP1 is indispensable for absorbing LDL and VLDL into cells by promoting the trafficking of the surface receptors. For cancer cells, the uptake of much lipid involved in LDL and VLDL is beneficial for producing large amounts of energy. On the other hand, the incorporation of large amounts of lipids into vascular endothelial cells and/or smooth muscle cells may facilitate the development of atheromatous plaques.
In both cancer and atherosclerosis, the disease develops gradually over several years. The early stages of the disease are sometimes accompanied by low‐level tissue destruction and subsequent leakage of intracellular proteins. Repeated leakage of such antigenic proteins leads to amplified antibody expression with low antigen levels. Therefore, antibody markers are much more sensitive than antigen markers and could be useful for the early diagnosis of precancerous lesions and preonset detection of AIS. TIA, a prodromal symptom of AIS, consistently showed significantly higher LRPAP1‐Ab levels than HD controls (Figure 4A). Thus, the early treatment of LRPAP1‐Ab–positive patients may avoid the onset of disease. Serum LRPAP1‐Ab levels appear to be a useful marker for the diagnosis of ESCC, GC, CRC, AIS, TIA, and DM, which are presumably caused by smoking.
DISCLOSURE
This work was performed in collaboration with Fujikura Kasei Co., Ltd. RN, NS and HK are employees of Fujikura Kasei Co., Ltd. Hideaki Shimada received honorarium from M3, Inc and research funding from Ono Pharmaceutical Company.
Supporting information
Figure S1
Supplementary Material
ACKNOWLEDGMENTS
This work was performed in collaboration with Fujikura Kasei Co., Ltd. RN, NS and HK are employees of Fujikura Kasei Co., Ltd. The authors would like to thank Ms Seiko Otsuka, Satoko Ishibashi, and Masae Suzuki for technical assistance and MARUZEN‐YUSHODO Co., Ltd. (https://kw.maruzen.co.jp/kousei‐honyaku/) for the English language editing. This research was supported, in part, by research grants from the Ministry of Education, Culture, Sports, Science and Technology (MEXT) in Japan, the Japan Agency for Medical Research and Development (AMED) (Practical Research Project for Life‐Style related Diseases including Cardiovascular Diseases and Diabetes Mellitus), and the Japan Science and Technology Agency (JST).
Sumazaki M, Shimada H, Ito M, et al. Serum anti‐LRPAP1 is a common biomarker for digestive organ cancers and atherosclerotic diseases. Cancer Sci 2020;111:4453–4464. 10.1111/cas.14652
Contributor Information
Hideaki Shimada, Email: hideaki.shimada@med.toho-u.ac.jp.
Takaki Hiwasa, Email: takaki.hiwasa@med.toho-u.ac.jp.
REFERENCES
- 1. Shimada H, Takeda A, Arima M, et al. Serum p53 antibody is a useful tumor marker in superficial esophageal squamous cell carcinoma. Cancer. 2000;89:1677‐1683. [PubMed] [Google Scholar]
- 2. Shimada H, Ochiai T, Nomura F, Japan p53 Antibody Research Group . Titration of serum p53 antibodies in 1,085 patients with various types of malignant tumors: a multiinstitutional analysis by the Japan p53 Antibody Research Group. Cancer. 2003;97:682‐689. [DOI] [PubMed] [Google Scholar]
- 3. Shimada H, Shiratori T, Takeda A, et al. Perioperative changes of serum p53 antibody titer is a predictor for survival in patients with esophageal squamous cell carcinoma. World J Surg. 2009;33:272‐277. [DOI] [PubMed] [Google Scholar]
- 4. Shimada H. p53 molecular approach to diagnosis and treatment of esophageal squamous cell carcinoma. Ann Gastroenterol Surg. 2018;2:266‐273. [DOI] [PMC free article] [PubMed] [Google Scholar]
- 5. Hiwasa T, Shimada H. Autoantibody in cancer In: Shimada H, ed. Biomarkers in Cancer Therapy. Singapore: Springer Nature; 2018:25‐40. ISBN: 978‐981‐13‐7295‐7 [Google Scholar]
- 6. Nakashima K, Shimada H, Ochiai T, et al. Serological identification of TROP2 by recombinant cDNA expression cloning using sera of patients with esophageal squamous cell carcinoma. Int J Cancer. 2004;112:1029‐1035. [DOI] [PubMed] [Google Scholar]
- 7. Kuboshima M, Shimada H, Liu TL, et al. Identification of a novel SEREX antigen, SLC2A1/GLUT1, in esophageal squamous cell carcinoma. Int J Oncol. 2006;28:463‐468. [PubMed] [Google Scholar]
- 8. Kuboshima M, Shimada H, Liu TL, et al. Presence of serum tripartite motif‐containing 21 antibodies in patients with esophageal squamous cell carcinoma. Cancer Sci. 2006;97:380‐386. [DOI] [PMC free article] [PubMed] [Google Scholar]
- 9. Shimada H, Kuboshima M, Shiratori T, et al. Serum anti‐myomegalin antibodies in patients with esophageal squamous cell carcinoma. Int J Oncol. 2007;30:97‐103. [PubMed] [Google Scholar]
- 10. Shimada H, Shiratori T, Yasuraoka M, et al. Identification of makorin 1 as a novel SEREX antigen of esophageal squamous cell carcinoma. BMC Cancer. 2009;9:232. [DOI] [PMC free article] [PubMed] [Google Scholar]
- 11. Kagaya A, Shimada H, Shiratori T, et al. Identification of a novel SEREX antigen family, ECSA, in esophageal squamous cell carcinoma. Proteome Sci. 2011;9:31. [DOI] [PMC free article] [PubMed] [Google Scholar]
- 12. Shimada H, Ito M, Kagaya A, et al. Elevated serum antibody levels against cyclin L2 in patients with esophageal squamous cell carcinoma. J Cancer Sci Ther. 2015;7:60‐66. [Google Scholar]
- 13. Kobayashi S, Hiwasa T, Ishige T, et al. Anti‐FIRΔexon2, a splicing variant form of PUF60, auto‐antibody is detected in the sera of esophageal squamous cell carcinoma. Cancer Sci. 2019;110:2004‐2013. [DOI] [PMC free article] [PubMed] [Google Scholar]
- 14. Kobayashi S, Hoshino T, Hiwasa T, et al. Anti‐FIRs (PUF60) auto‐antibodies are detected in the sera of early‐stage colon cancer patients. Oncotarget. 2016;7:82493‐82503. [DOI] [PMC free article] [PubMed] [Google Scholar]
- 15. Matsutani T, Hiwasa T, Takiguchi M, et al. Autologous antibody to src‐homology 3‐domain GRB2‐like 1 specifically increases in the sera of patients with low‐grade gliomas. Exp Clin Cancer Res. 2012;31:85. [DOI] [PMC free article] [PubMed] [Google Scholar]
- 16. Adachi‐Hayama M, Adachi A, Shinozaki N, et al. Circulating anti‐filamin C antibody as a potential serum biomarker for low‐grade gliomas. BMC Cancer. 2014;14:452. [DOI] [PMC free article] [PubMed] [Google Scholar]
- 17. Kramer J, Harcos P, Prohászka Z, et al. Frequencies of certain complement protein alleles and serum levels of anti‐heat‐shock protein antibodies in cerebrovascular diseases. Stroke. 2000;31:2648‐2652. [DOI] [PubMed] [Google Scholar]
- 18. Machida T, Kubota M, Kobayashi E, et al. Identification of stroke‐associated‐antigens via screening of recombinant proteins from the human expression cDNA library (SEREX). J Translat Med. 2015;13:71. [DOI] [PMC free article] [PubMed] [Google Scholar]
- 19. Goto K, Sugiyama T, Matsumura R, et al. Identification of cerebral infarction‐specific antibody markers from autoantibodies detected in patients with systemic lupus erythematosus. J Mol Biomark Diagnos. 2015;6:2. [Google Scholar]
- 20. Yoshida Y, Wang H, Hiwasa T, et al. Elevation of autoantibody level against PDCD11 in patients with transient ischemic attack. Oncotarget. 2018;9:8836‐8848. [DOI] [PMC free article] [PubMed] [Google Scholar]
- 21. Wang H, Zhang XM, Tomiyoshi G, et al. Association of serum levels of antibodies against MMP1, CBX1, and CBX5 with transient ischemic attack and cerebral infarction. Oncotarget. 2018;9:5600‐5613. [DOI] [PMC free article] [PubMed] [Google Scholar]
- 22. Hiwasa T, Machida T, Zhang XM, et al. Elevated levels of autoantibodies against ATP2B4 and BMP‐1 in sera of patients with atherosclerosis‐related diseases. Immunome Res. 2015;11:097 [Google Scholar]
- 23. Nakamura R, Tomiyoshi G, Shinmen N, et al. An anti‐deoxyhypusine synthase antibody as a marker of atherosclerosis‐related cerebral infarction, myocardial infarction, diabetes mellitus, and chronic kidney disease. SM Atheroscler J. 2017;1:1001. [Google Scholar]
- 24. Hiwasa T, Tomiyoshi G, Nakamura R, et al. Serum SH3BP5‐specific antibody level is a biomarker of atherosclerosis. Immunome Res. 2017;13:132. [Google Scholar]
- 25. Zhang XM, Wang H, Mine S, et al. Association of serum anti‐prolylcarboxypeptidase antibody marker with atherosclerotic diseases accompanied by hypertension. J Mol Biomark Diagn. 2017;8:361. [Google Scholar]
- 26. Chen PM, Ohno M, Hiwasa T, et al. Nardilysin is a promising biomarker for the early diagnosis of acute coronary syndrome. Int J Cardiol. 2017;243:1‐8. [DOI] [PubMed] [Google Scholar]
- 27. Hiwasa T, Zhang XM, Kimura R, et al. Association of serum antibody levels against TUBB2C with diabetes and cerebral infarction. Integ Biomed Sci. 2015;1:49‐63. [Google Scholar]
- 28. Palmer JP, Asplin CM, Clemons P, et al. Insulin antibodies in insulin‐dependent diabetics before insulin treatment. Science. 1983;222:1337‐1339. [DOI] [PubMed] [Google Scholar]
- 29. Baekkeskov S, Aanstoot H, Christgau S, et al. Identification of the 64K autoantigen in insulin dependent diabetes as the GABA‐synthesizing enzyme glutamic acid decarboxylase. Nature. 1990;347:151‐156. [DOI] [PubMed] [Google Scholar]
- 30. Hiwasa T, Zhang XM, Kimura R, et al. Elevated adiponectin antibody levels in sera of patients with atherosclerosis‐related coronary artery disease, cerebral infarction, and diabetes mellitus. J Circ Biomark. 2016;5:8. [DOI] [PMC free article] [PubMed] [Google Scholar]
- 31. Sugimoto K, Tomiyoshi G, Mori M, et al. Identification of serum anti‐GADD34 antibody as a common marker of diabetes mellitus and Parkinson disease. J Alzheimers Dis Parkinsonism. 2017;7:358. [Google Scholar]
- 32. Parrish HM, Goldner JC, Silberg SL. Coronary atherosclerosis and cancer in women. Arch Intern Med. 1966;117:639‐642. [PubMed] [Google Scholar]
- 33. Stemmermann GN, Heilbrun LK, Nomura A, et al. Adenomatous polyps and atherosclerosis: an autopsy study of Japanese men in Hawaii. Int J Cancer. 1986;38:789‐794. [DOI] [PubMed] [Google Scholar]
- 34. Silverman DT, Schiffman M, Everhart J, et al. Diabetes mellitus, other medical conditions and familial history of cancer as risk factors for pancreatic cancer. Br J Cancer. 1999;80:1830‐1837. [DOI] [PMC free article] [PubMed] [Google Scholar]
- 35. Hu FB, Manson JE, Liu S, et al. Prospective study of adult onset diabetes mellitus (type 2) and risk of colorectal cancer in women. J Natl Cancer Inst. 1999;91:542‐547. [DOI] [PubMed] [Google Scholar]
- 36. Anderson KE, Anderson E, Mink PJ, et al. Diabetes and endometrial cancer in the Iowa Women’s Health Study. Cancer Epidemiol Biomarkers Prev. 2001;10:611‐616. [PubMed] [Google Scholar]
- 37. Rodriguez C, Patel AV, Mondul AM, et al. Diabetes and risk of prostate cancer in a prospective cohort of US men. Am J Epidemiol. 2005;161:147‐152. [DOI] [PubMed] [Google Scholar]
- 38. Yang SY, Kim YS, Chung SJ, et al. Association between colorectal adenoma and coronary atherosclerosis detected by CT coronary angiography in Korean men; a cross‐sectional study. J Gastroenterol Hepatol. 2010;25:1795‐1799. [DOI] [PubMed] [Google Scholar]
- 39. Korenberg JR, Argraves KM, Chen XN, et al. Chromosomal localization of human genes for the LDL receptor family member glycoprotein 330 (LRP2) and its associated protein RAP (LRPAP1). Genomics. 1994;22:88‐93. [DOI] [PubMed] [Google Scholar]
- 40. Lagergren J, Bergstrom R, Lindgren A, et al. The role of tobacco, snuff and alcohol use in the aetiology of cancer of the oesophagus and gastric cardia. Int J Cancer. 2000;85:340‐346. [PubMed] [Google Scholar]
- 41. Ishiguro S, Sasazuki S, Inoue M, et al. Effect of alcohol consumption, cigarette smoking and flushing response on esophageal cancer risk: a population‐based cohort study (JPHC study). Cancer Lett. 2009;275:240‐246. [DOI] [PubMed] [Google Scholar]
- 42. Nelson JR, Wani O, May HT, et al. Potential benefits of eicosapentaenoic acid on atherosclerotic plaques. Vascul Pharmacol. 2017;91:1‐9. [DOI] [PubMed] [Google Scholar]
- 43. Lu J, Mitra S, Wang X, et al. Oxidative stress and lectin‐like ox‐LDL‐receptor LOX‐1 in atherogenesis and tumorigenesis. Antioxid Redox Signal. 2011;15:2301‐2333. [DOI] [PubMed] [Google Scholar]
- 44. Yahagi K, Kolodgie FD, Lutter C, et al. Pathology of human coronary and carotid artery atherosclerosis and vascular calcification in diabetes mellitus. Arterioscler Thromb Vasc Biol. 2017;37:191‐204. [DOI] [PMC free article] [PubMed] [Google Scholar]
- 45. Folsom AR, Pankow JS, Peacock JM, et al. Variation in TCF7L2 and increased risk of colon cancer: the Atherosclerosis Risk in Communities (ARIC) study. Diabetes Care. 2008;31:905‐909. [DOI] [PMC free article] [PubMed] [Google Scholar]
- 46. Kishida K, Funahashi T, Shimomura I. Adiponectin as a routine clinical biomarker. Best Pract Res Clin Endocrinol Metab. 2014;28:119‐130. [DOI] [PubMed] [Google Scholar]
- 47. Prizment AE, Linabery AM, Lutsey PL, et al. Circulating β‐2 microglobulin and risk of cancer: the Atherosclerosis Risk in Communities Study (ARIC). Cancer Epidemiol Biomarkers Prev. 2016;25:657‐664. [DOI] [PMC free article] [PubMed] [Google Scholar]
- 48. Fasehee H, Fakhraee M, Davoudi S, et al. Cancer biomarkers in atherosclerotic plaque: evidenced from structural and proteomic analyses. Biochem Biophys Res Commun. 2019;509:687‐693. [DOI] [PubMed] [Google Scholar]
- 49. Masoudkabir F, Sarrafzadegan N, Gotay C, et al. Cardiovascular disease and cancer: evidence for shared disease pathways and pharmacologic prevention. Atherosclerosis. 2017;263:343‐351. [DOI] [PMC free article] [PubMed] [Google Scholar]
- 50. Libby P, Ridker PM, Hansson GK. Progress and challenges in translating the biology of atherosclerosis. Nature. 2011;473:317‐325. [DOI] [PubMed] [Google Scholar]
- 51. Jiang J, Yan M, Mehta JL, et al. Angiogenesis is a link between atherosclerosis and tumorigenesis: role of LOX‐1. Cardiovasc Drugs Ther. 2011;25:461‐468. [DOI] [PubMed] [Google Scholar]
- 52. Kounnas MZ, Argraves WS, Strickland DK. The 39‐kDa receptor‐associated protein interacts with two members of the low density lipoprotein receptor family, alpha‐2‐macroglobulin receptor and glycoprotein 330. J Biol Chem. 1992;267:21162‐21166. [PubMed] [Google Scholar]
- 53. Harriott AM, Heckman MG, Rayaprolu S, et al. Low density lipoprotein receptor related protein 1 and 6 gene variants and ischaemic stroke risk. Eur J Neurol. 2015;22:1235‐1241. [DOI] [PMC free article] [PubMed] [Google Scholar]
- 54. Zilberberg A, Yaniv A, Gazit A. The low density lipoprotein receptor‐1, LRP1, interacts with the human frizzled‐1 (HFz1) and down‐regulates the canonical Wnt signaling pathway. J Biol Chem. 2004;279:17535‐17542. [DOI] [PubMed] [Google Scholar]
- 55. Lemieux E, Cagnol S, Beaudry K, et al. Oncogenic KRAS signalling promotes the Wnt/β‐catenin pathway through LRP6 in colorectal cancer. Oncogene. 2015;34:4914‐4927. [DOI] [PMC free article] [PubMed] [Google Scholar]
- 56. Willnow TE, Armstrong SA, Hammer RE, et al. Functional expression of low density lipoprotein receptor‐related protein is controlled by receptor‐associated protein in vivo. Proc Nat Acad Sci USA. 1995;92:4537‐4541. [DOI] [PMC free article] [PubMed] [Google Scholar]
Associated Data
This section collects any data citations, data availability statements, or supplementary materials included in this article.
Supplementary Materials
Figure S1
Supplementary Material