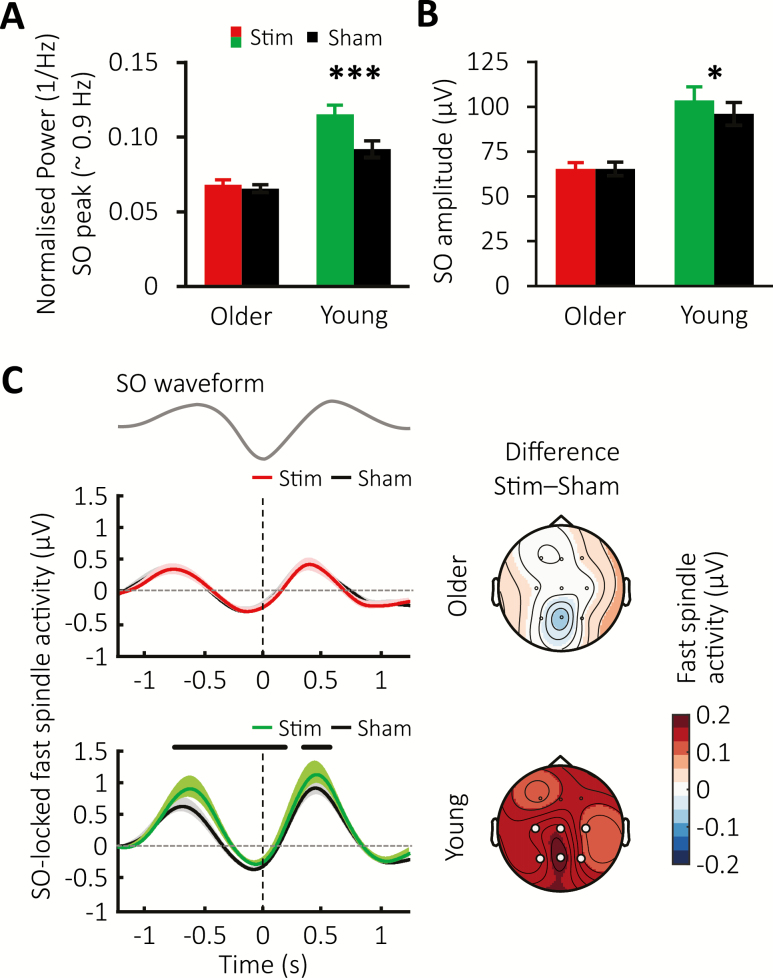
Figure 4.
Sustained modulation of SOs and fast spindles. (A) Global mean ± SEM of the normalized spectral power for the SO peak obtained across the 180-min stimulation period for the Stimulation condition in the older (red) and young population (green) and their corresponding Sham conditions (black). (B) Mean ± SEM of SO amplitude of offline-detected SO events across the stimulation period for the stimulation condition in the older (red) and young (green) cohort and their Sham conditions (black). (C) Fast spindle RMS-activity averages time-locked to the negative peak (vertical lines) of offline detected SO events for the older (top) and young population (below) with Stimulation conditions shown in red or green, and Sham conditions in black. Thick horizontal black bars mark time points of significant difference between conditions. The corresponding topographical distribution of the difference between conditions over the time intervals −1.25 to 1.25 s (where t = 0 time-locked to the negative SO peak) is shown on the right. White circles indicate channel locations with significant difference in overall phase-locked fast spindle activity between conditions after FDR correction.

