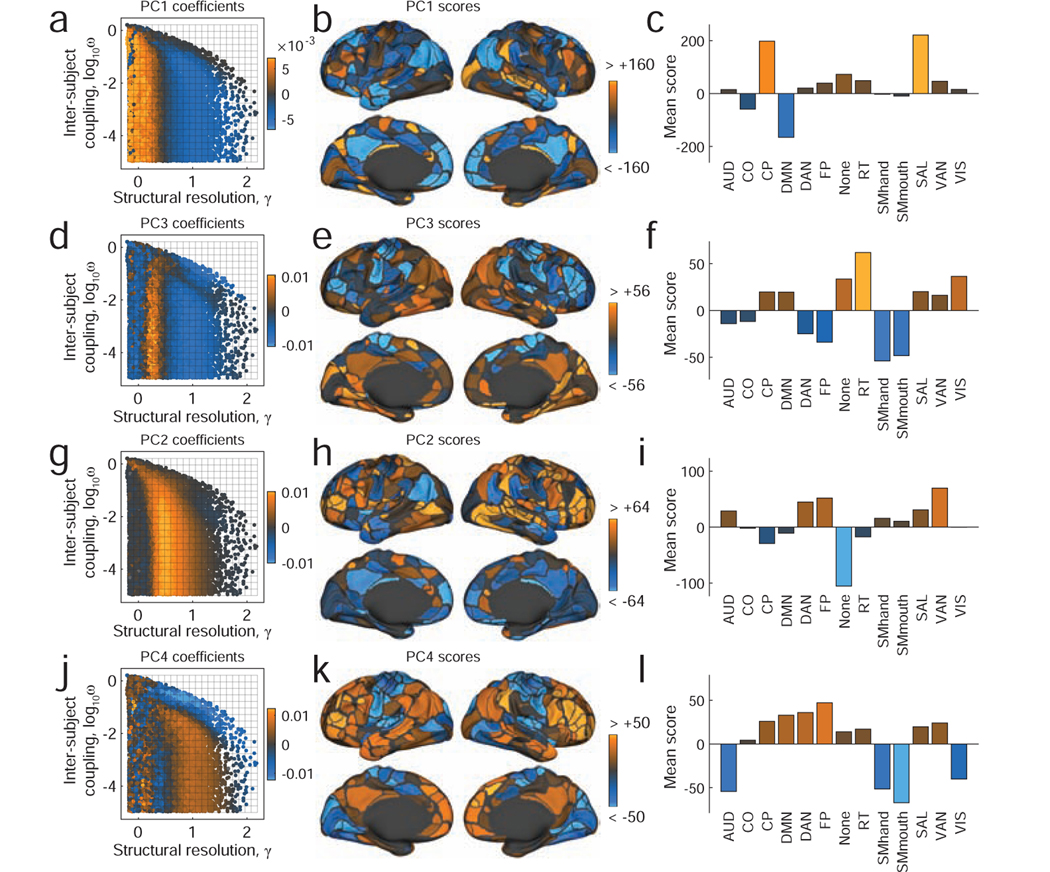
FIG. 4. Modes of inter-subject community variability.
Principal component coefficients and scores for the first four components. (a) PC coefficients for the first component projected into {γ, ω} parameter space. (b) PC scores for the same component projected onto the cortical surface. The community assignments of bright orange brain areas are highly variable across subjects at orange points in the parameter space. Conversely, the community assignments of blue brain areas are highly consistent across subjects at those same points. (c) Areal values of principal component scores averaged across thirteen previously-defined cognitive/functional systems [26]. This panel helps shift focus away area-level community variability and onto system level patterns of variation. The remaining panels show corresponding plots for PC2, PC3, and PC4. Note: we present principal components in the order in which they are expressed along the γ axis. This choice results in the following ordering: PC1, PC3, PC2, and PC4.

