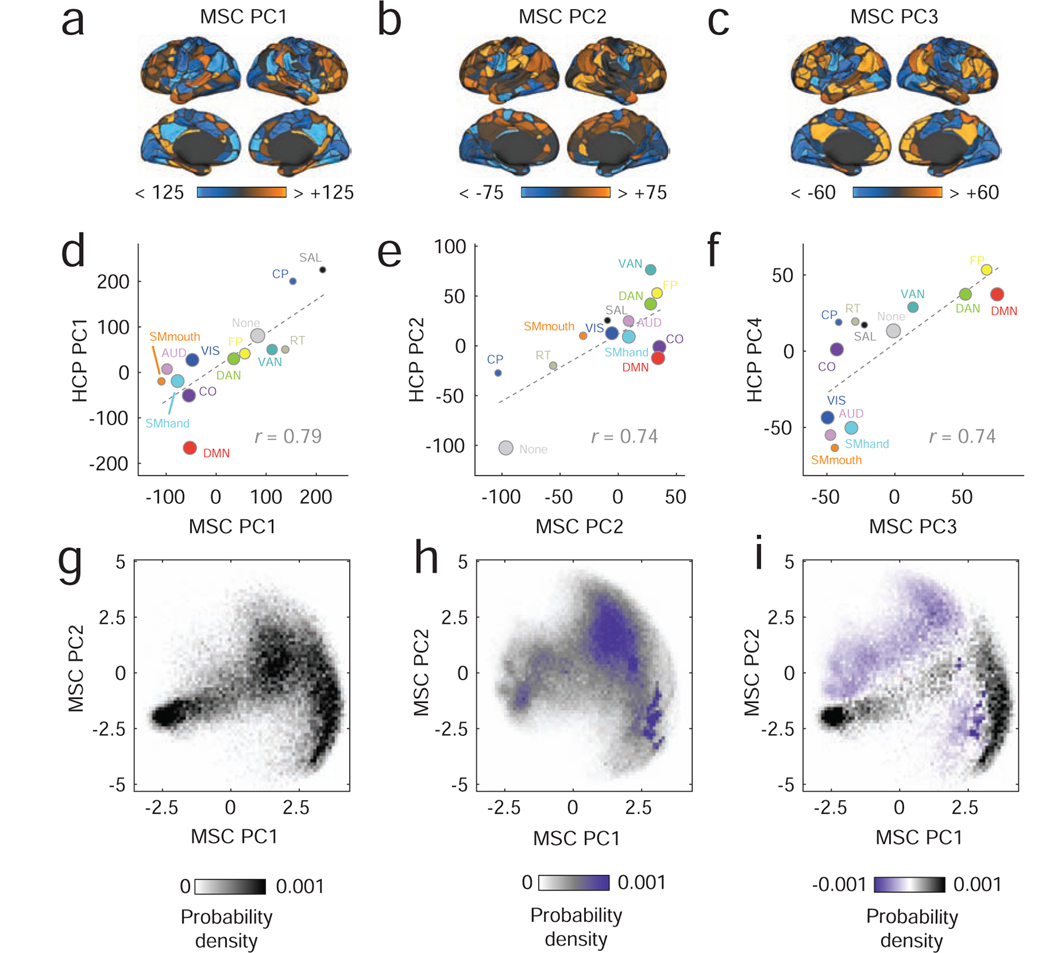
FIG. 7. Summary and analysis of the midnight scan club dataset.
In panels (a)-(c), we show surface maps depicting the first three components generated from PCA analysis of the midnight scan club (MSC) dataset. These principal components correspond, broadly, to the components detected in the HCP dataset. We compare the two datasets by averaging principal components within brain systems and computing system-average correlations. The results are shown in panels (d)-(f). The size of dots is proportional to the number of nodes assigned to each system. We perform a similar analysis of intra-subject variability, in which we characterize variation in community structure within subjects across scan sessions. To visualize these results, we project within- and between-subject community entropy scores into the two-dimensional space defined using the first two dimensions of a joint PCA. In panel g, we show the distribution of inter-subject patterns. Panel h shows the same for intra-subject patterns, and i shows the difference between the two.

