Abstract
Objective
The combined spatiotemporal dynamics underlying sign language production remain largely unknown. To investigate these dynamics compared to speech production, we used intracranial electrocorticography during a battery of language tasks.
Methods
We report a unique case of direct cortical surface recordings obtained from a neurosurgical patient with intact hearing who is bilingual in English and American Sign Language. We designed a battery of cognitive tasks to capture multiple modalities of language processing and production.
Results
We identified 2 spatially distinct cortical networks: ventral for speech and dorsal for sign production. Sign production recruited perirolandic, parietal, and posterior temporal regions, while speech production recruited frontal, perisylvian, and perirolandic regions. Electrical cortical stimulation confirmed this spatial segregation, identifying mouth areas for speech production and limb areas for sign production. The temporal dynamics revealed superior parietal cortex activity immediately before sign production, suggesting its role in planning and producing sign language.
Conclusions
Our findings reveal a distinct network for sign language and detail the temporal propagation supporting sign production.
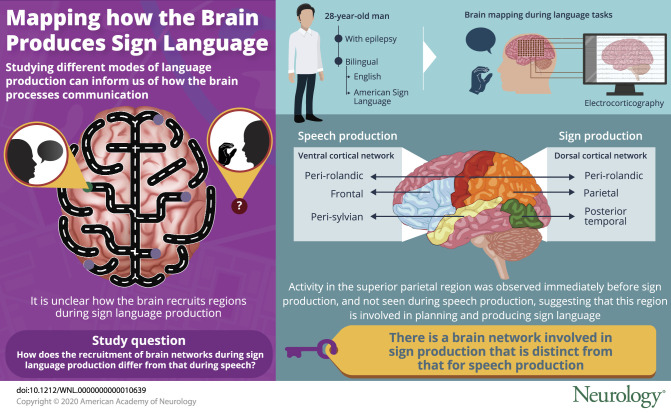
Studying the spatiotemporal dynamics of signed and spoken language can provide unique insights into how different cortical networks are recruited, depending on the modality in which the language is produced. Most studies on sign language use fMRI or lesion analysis, which have revealed information on the shared and differential brain regions involved in sign and speech production. However, these techniques have limited temporal resolution. EEG and magnetoencephalography have been used in a few studies to overcome this limitation, but the combined spatiotemporal dynamics of sign language processing still remain largely unknown.
There is substantial overlap in the left-lateralized perisylvian network involved in signed and spoken language production.1‐3 Lesion studies reveal that left hemispheric damage severely impairs language perception and production for signed and spoken language, whereas right hemispheric damage does not. Left perisylvian areas are activated on fMRI studies in both language modalities. There are also differentially activated regions in sign and spoken language. Comprehension and production of these 2 language modalities use different systems: sign uses a visual-motor system, and speech uses an auditory-vocal system.
The temporal dynamics of language production from magnetoencephalography studies have revealed similar findings for sign and speech. During comprehension, early sensory processing (≈100 milliseconds) is confined to modality-specific regions and lexical-semantic processing (≈300 milliseconds) activated left frontotemporal regions.4 During production, phrase building engaged left anterior temporal and ventromedial cortices with similar timing during sign and speech.5
The combined spatiotemporal dynamics of sign language production have been difficult to study. Electrocorticography (ECoG) resolves spatiotemporal parameters to the subcentimeter and submillisecond scale. However, ECoG studies of sign language are rare because the implanted participant must be fluent in sign language. Only 1 prior study used ECoG to study sign language.7 Crone et al.7 in 2001 studied word production using signed vs spoken language in a 38-year-old participant with normal hearing and speech who acquired sign language proficiency in adulthood. Speech activated tongue regions of the sensorimotor cortex, and sign activated hand regions of the sensorimotor cortex. In addition, word production during sign activated parietal regions, which were not activated during speech. Temporally, the posterior superior temporal gyrus was activated earliest and to the greatest extent during auditory word repetition, while the basal temporal occipital cortex was activated similarly during visual naming and visual word repetition. The temporal dynamics reflect the different modalities of input processing because their analysis was locked to stimulus perception. Their analysis was not locked to production; thus, the temporal dynamics during sign language production remain unknown. In addition, their participant acquired sign language in adulthood, so their sign language network may be different compared to a native signer.
We had the unique opportunity to use ECoG to study the differences between spoken and signed language in a 28-year-old right-handed man who had normal hearing and was bilingual in English and American Sign Language (ASL). He is a hearing child of a deaf adult and acquired sign language at an early age. He was implanted with left hemisphere intracranial electrodes for epilepsy surgery. We designed a battery of cognitive tasks to capture multiple modalities of language processing, which mirrored the clinical paradigms used during electrical stimulation mapping, the stimuli of which were matched to language production. The tasks involved visual naming, visual word repetition, auditory word repetition, auditory naming, and auditory sentence completion. During lulls in clinical treatment, we administered this battery with the patient responding in spoken English and ASL. These results use direct cortical recordings in a hearing-intact native ASL bilingual patient and provide a unique window into the spatiotemporal differences during production between a spoken and a signed language.
Methods
Patient
Our patient was a 28-year-old, right-handed, hearing-intact man who is bilingual in both English and ASL. The patient is a child of a deaf adult and acquired sign language at an early age. Patient has had epilepsy since 9 years of age secondary to perinatal left inferior parietal infarct. Neuropsychological testing showed that general intellectual abilities were largely in the average range. He had impairments with verbal fluency but otherwise functioned normally across cognitive domains. Wada testing showed bilateral speech representation.
Standard protocol approvals, registrations, and patient consents
The patient gave informed consent to participate in research, and the New York University Institutional Review Board approved the study.
Electrode localization
The patient was implanted, for the purposes of his clinical care, with 124 electrodes (AdTech Medical Instrument Corp, Oak Creek, WI) composed of an electrode grid (8 × 8 contact) over the left temporal parietal occipital cortex, strips (three 1 × 8 contact, one 1 × 6 contact, and two 1 × 4 contact) over the left frontal, temporal, and occipital regions, and depth electrodes (four 1 × 8 contact) within the left parietal lobe (figure 1B). Depth electrodes were not included in the analysis. Subdural electrodes had a 10-mm center-to-center interelectrode spacing, with a 4-mm diameter and a 2.3-mm diameter exposed recording contact. Surface reconstructions, electrode localization, and Montreal Neurological Institute coordinates were extracted by aligning a postoperative brain MRI to the preoperative brain MRI using previously published methods.8
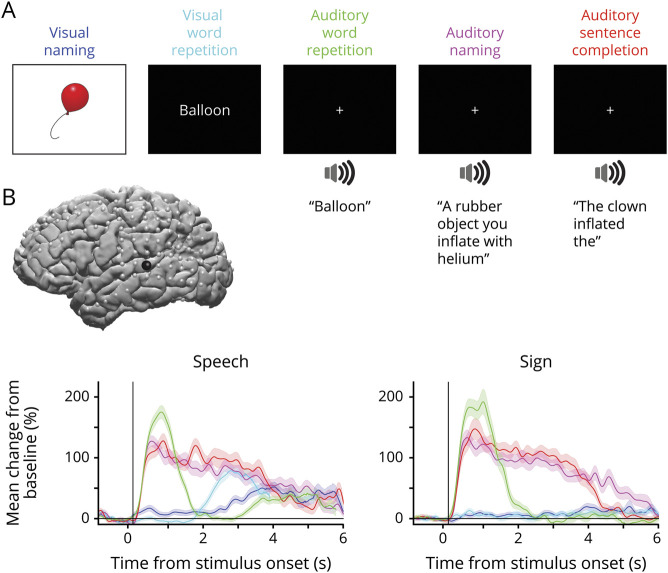
Figure 1. Battery of 5 tasks to investigate language processing during speech and sign production.
(A) Our tasks involve 2 visual tasks of naming and word repetition and 3 auditory tasks of word repetition, naming, and sentence completion. Each task has 50 stimuli, the responses of which are matched across tasks. Visual naming, visual word repetition, and auditory word repetition are repeated twice. (B) Lateral view of brain reconstruction with subdural electrode localizations (gray electrodes) and an example of responses from a select electrode (black) in the superior temporal gyrus. For the select electrode, mean broadband high gamma activity locked to stimulus presentation is shown for speech and for sign during each of the 5 tasks (color coded by task indicated in panel A). Shaded area denotes the SEM across trials.
Language battery
A battery of 5 language tasks was administered to the participant with the participant responding in speech and sign (figure 1A). The tasks involve visual naming, visual word repetition, auditory word repetition, auditory naming, and auditory sentence completion, with the goal of capturing multiple modalities of language processing. The task design mirrors the language tasks given during electrical stimulation mapping. The stimuli consist of 50 items taken from the revised Snodgrass and Vanderwart object pictorial set,9 and the stimuli are matched across the 5 tasks. Our auditory naming and sentence completion stimuli are taken from the Hamberger sets when matched stimuli are available.10,11 Each task contains 50 trials. There is a 500-millisecond interstimulus interval between each trial. Visual naming, visual word repetition, and auditory word repetition are repeated twice. The trials are self-paced, and the total duration of the 5 tasks ranges between 20 and 30 minutes.
Motor control
The video was reviewed for spontaneous right-hand reaching movements. Inclusion criteria included right-hand reaching movements with >20-cm change in distance. Exclusion criteria included any other observed movement besides the right arm and any audible speech from the participant. The onset was the initiation of the movement. Eighteen trials were obtained. Examples of movements include reaching for a utensil or picking up a mobile phone.
Electrophysiologic recording and analysis
Signals were recorded at 512 Hz with the Nicolet system. Channels were inspected by an epileptologist (J.S.), and channels with epileptiform activity or artifact were removed from further analysis. The data were then rereferenced to a common average. Audio and video were manually inspected to mark the onset of speech and sign production (with the onset of sign production determined as the onset of initial motor movement). Trials in which the patient did not respond or the reaction time was >3 SDs above the mean were removed. Our analysis of the electrophysiologic signals focused on changes in broadband high gamma activity (70–150 Hz). To quantify changes in the high gamma range, the data were bandpass filtered between 70 and 150 Hz, and then a Hilbert transform was applied to obtain the analytic amplitude. Event-related epochs were extracted. For the language tasks, these were time-locked to either stimulus presentation or speech or sign production, and for the motor control, this was time-locked to initiation of motor movement. The data were then normalized into percent change from baseline: for the language tasks, the baseline was the 500-millisecond prestimulus period, and for the motor control, the baseline was the mean of the entire 56-minute period from which the trials were obtained.
Identifying significantly active electrodes and temporal propagation
A sliding window moving across the trial activity, aligned to language production, was used to determine whether an electrode was significantly active (figure 2A) and at what time points this significant activity occurred (figure 5). For each sliding window, a Wilcoxon signed-rank test was performed, using the null hypothesis that the median trial activity (normalized to the baseline) is equal to 0. Trials across all 5 language tasks were pooled. A sliding window of 100-millisecond duration with a 50-millisecond overlap was used. Significance was determined as a value of p < 0.05, false discovery rate (FDR) corrected for multiple comparisons (over the number of time windows). A channel was considered significantly active if it contained at least a 500-millisecond contiguous segment of significance, if it had at least a mean 10% signal increase, and if the peak activity occurred >250 milliseconds before the onset of language production, because peak activity prior reflected stimulus presentation rather than language production. We pooled across the 5 language tasks to obtain a higher signal-to-noise ratio. In a separate analysis, to justify pooling across the 5 tasks, we investigated whether there were significant differences in high gamma activity across tasks. We looked at mean trial activity from 0.6 second before production onset to the end of the trial and used a Kruskal-Wallis test with the null hypothesis that median responses for the 5 tasks were equal, FDR corrected for multiple comparisons (over the number of electrodes). We found that during sign production, only 1 electrode in the bottom right corner of the grid (in the occipital region) showed a significant difference in activity across the 5 tasks, and this was due to differences in stimulus input (visual vs auditory). For identifying significantly active right motor responses, a similar method was used for trial activity aligned to the onset of right-hand reaching movements. Because the number of trials (n = 18) was smaller than for language production, slightly different parameters were used due to a lower signal-to-noise ratio. A sliding window of 300-millisecond duration with 75-millisecond overlap was used. Significance was determined as a value of p < 0.05, FDR corrected for multiple comparisons (over the number of time windows). A channel was considered significantly active if it contained at least a 200-millisecond contiguous segment of significance and if it had at least a mean 10% signal increase. The temporal dynamics of language production were calculated with the same methods to determine significantly active electrodes, with a sliding window, which determined the time periods of significant activity. The onset of significant high gamma activity is the first time point of the 100-millisecond window that was significantly and consecutively active.
Figure 2. Two spatially distinct networks for speech and sign production.
(A) Electrodes significantly active during speech production (blue), sign production (red), or control right reaching movements (green) and their overlap (see legend) are plotted on a surface reconstruction of the brain. There is a spatially distinct network for sign production that does not overlap with speech production or right-hand reaching movements. Significance was determined with a Wilcoxon signed-rank test on trial activity moving across time with a sliding window, false discovery rate corrected for multiple comparisons. Gray electrodes did not show significant activity. (B) Electrodes with significant differential activity between sign (red) and speech (blue) production. Using a different statistical analysis, we confirm our findings in panel A. Significant differential activity between sign and speech production (from −0.6 second before production until the end of the trial) was determined with a Wilcoxon signed-rank test paired to the matched stimuli. Significant electrodes are displayed and color coded according to the z value, with a higher absolute value indicating higher significance. Gray electrodes were not significant, false discovery rate corrected for multiple comparisons.
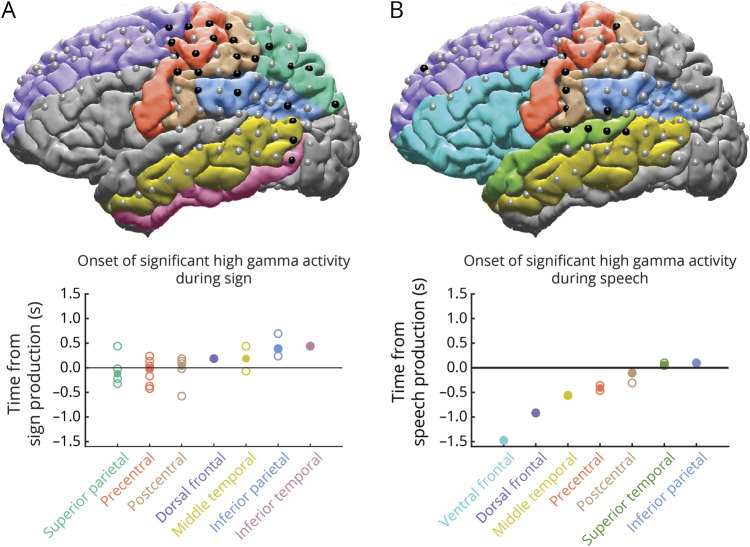
Figure 5. Combined spatiotemporal dynamics during sign and speech production.
The temporal propagation of significant high gamma active electrodes during (A) sign production and (B) speech production by cortical region are shown. The brain reconstruction indicates the significantly active high gamma electrodes (black electrodes) for the respective modality of language production (same as in figure 2A). The cortical regions with significant activity are colored. The plots below show the temporal propagation of the onset of significant high gamma activity, as time from language production, for each region, colored according to the corresponding region. The solid circle is the median onset time for each region, and the hollow circle represents the onset time for each electrode in the region.
Determining the degree of differential sign and speech production activity
To determine the differential degree to which an electrode was active during sign vs speech production (figure 2B), we performed a Wilcoxon signed-rank test, using the null hypothesis that the median responses during sign and speech were equal. Trial activity was aligned to production onset, and we averaged from 0.6 second before production to the end of the trial. Significance was determined as a value of p < 0.05, FDR corrected for multiple comparisons (over the number of electrodes). The degree of differential activity was defined using the z value statistic and color coded from the minimum to maximum value.
Electrical stimulation mapping
Electrical stimulation mapping was performed by the participant's clinical team (P.D.) using previously established protocols at our center.12 For language testing, tasks performed during stimulation include counting (to rule out motor phenomena rather than language disruption), continuous speech (e.g., Pledge of Allegiance, reciting the months of the year or days of the week), visual naming, auditory naming, and auditory sentence completion. For motor/sensory testing, each stimulus site was tested for sensory symptoms and positive and negative motor phenomena. Stimulation was delivered using bipolar contiguous contacts with a biphasic pulse at a 50-Hz pulse rate with a pulse width of 0.3 to 0.5 millisecond, a train duration ranging from 3 to 5 seconds, and a goal current intensity between 10 and 15 mA. Both electrodes in the electrode pair will be considered a hit for language disruption if the participant reliably misses 2 different stimuli of the same task.
Data availability
Anonymized data will be shared if requested by any qualified investigator.
Results
High gamma activity as an index of neuronal activity
Our analysis of electrophysiological signals focused on the broadband high gamma range (70–150 Hz). High gamma robustly tracks single trial cortical activity13,14 and correlates with neural population firing rates and fMRI blood oxygen level–dependent responses,15–17 making it a suitable index to identify functionally active areas. Our battery of 5 language tasks (figure 1A) allowed us to measure event-related changes in high gamma activity across 2 different input modalities (visual verses auditory) and different task demands (naming, repetition, and sentence completion). The responses to the 5 tasks are matched, and the tasks were repeated in spoken English and then ASL, allowing us to identify differences in language processing depending on the output modality. We tracked neuronal activity from stimulus presentation to language production (example of responses from a superior temporal gyrus electrode is given in figure 1B).
Two spatially distinct cortical networks involved in sign and speech production
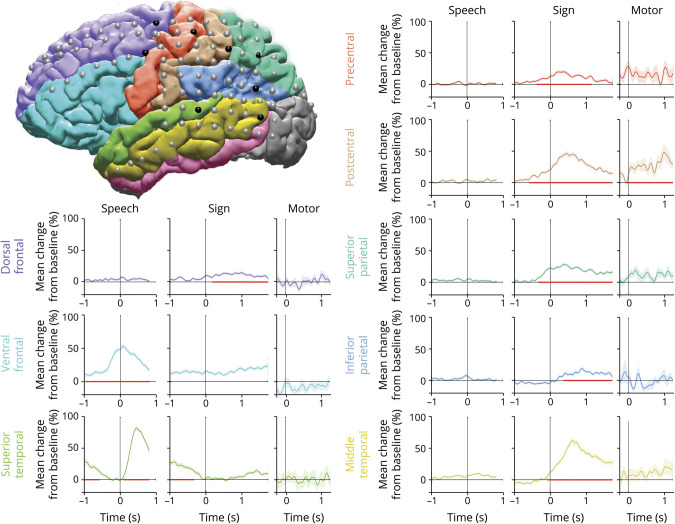
We first investigated activation patterns during sign and speech production to determine the shared and differential regions involved between speech and signed modalities. High gamma activity was aligned to language production and averaged across all 5 tasks. Electrodes with significant increases from baseline were identified for each production modality (using a sliding window over time; see Methods for details). This analysis revealed 2 major spatially distinct distributions of modality specific recruitment: a dorsal network recruited differentially for sign (figure 2A, red electrodes) and a ventral network recruited for speech (figure 2A, blue electrodes). Sign production recruited the perirolandic, parietal, and posterior temporal regions, while speech production recruited the frontal, perisylvian, and perirolandic regions. To ensure that activity was specific to sign production rather than general motor, we analyzed spontaneously produced right-handed reaching movements as a control. Only a subset of the sign-active electrodes in the perirolandic regions were also active during pure motor movements (figure 2A, yellow and black electrodes). There was minimal overlap between sign and speech modalities, seen in isolated perirolandic electrodes (figure 2A, purple and black electrodes). To directly compare speech and sign activity and to confirm our findings using a different statistical approach, we determined statistically significant differential activity using a Wilcoxon signed-rank test (p < 0.05, FDR corrected for multiple comparisons), comparing trial activity locked to production between speech and sign trials, paired to the matched stimuli (figure 2B). The z value of the Wilcoxon signed rank approximates the degree of difference between the 2 modalities, and when it is plotted for all electrodes with significant differential activity, we find a similar result with a dorsal network recruited for sign (positive z scores ranging from 2.3–9.4, figure 2B) and a ventral network recruited for speech (negative z scores ranging from −2.5 to −8.8, figure 2B). Example mean high gamma traces are plotted for each cortical region (figure 3), showing responses during speech and sign locked to production and motor locked to initiation of right-hand reaching movements.
Figure 3. Mean high gamma activity during speech production, sign production, and right-hand reaching movements in select electrodes in different regions.
The brain reconstruction displays 1 electrode (black) chosen in each of the different colored regions. The high gamma traces are colored according to corresponding region. The traces are aligned (time 0) to language production for speech and sign or to initiation of movement for the motor condition. The activity during speech and sign represents the average across all 5 language tasks. The shaded area denotes the SEM across trials. Red line on the x-axis indicates time period of significant high gamma activity.
Electrical cortical stimulation identifies motor and sensory regions corresponding to sign and speech production
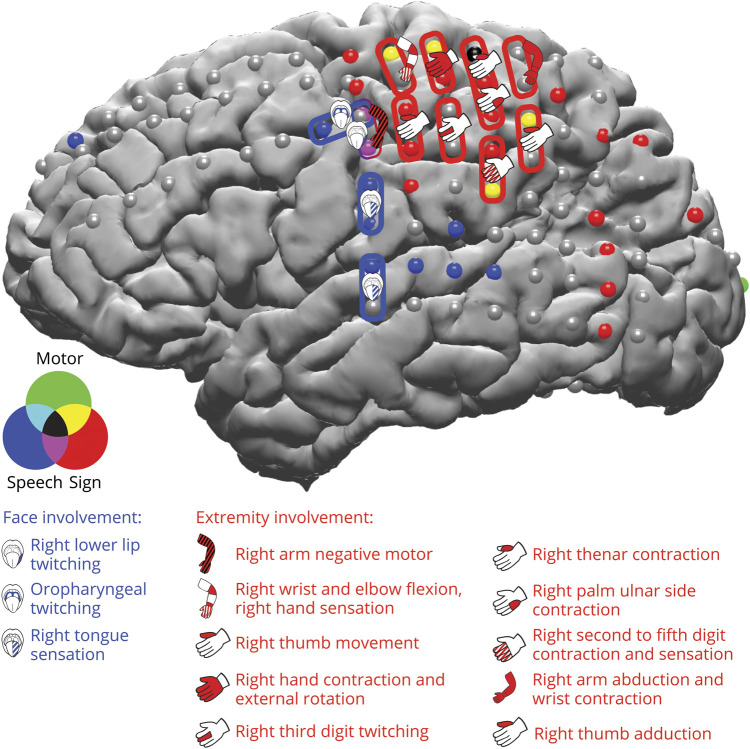
Clinical electrical cortical stimulation (ECS) was performed to map language, motor, and sensory regions for presurgical planning. ECS results corresponded to the regions identified with significant high gamma activity during sign production, speech production, and control right-hand reaching movements (figure 4). ECS identified mouth motor electrodes corresponding to electrodes with significant high gamma activity during speech production, and ECS identified right upper limb motor electrodes corresponding to electrodes with significant high gamma activity during sign production and control right-hand reaching movements. Stimulation of electrodes that showed significant high gamma activity for both speech and sign (figure 4, purple and black electrodes) elicited right lower lip twitching, right arm negative motor deficit, and right thenar contraction. Stimulation of electrodes with significant high gamma activity during control right-hand reaching movements elicited motor contraction and sensory symptoms of the right arm, as well as more localized deficits of the hand and the digits. Stimulation of high-gamma-activity sign electrodes in the perirolandic region, which were not active during control right-hand reaching movements, elicited thumb movement, palm stiffening, and dizziness/confusion. Stimulation of high-gamma-activity sign electrodes in the superior parietal and posterior temporal regions did not reveal sensory or motor findings. Instead, stimulation of high gamma active sign electrodes in the superior parietal electrodes elicited symptoms such as a rainbow-colored moving flash of light, objects appearing to pop out and move forward, and disorientation and lightheadedness, or it elicited no deficit. Stimulation of high-gamma-activity sign electrodes in the posterior temporal region did not elicit any deficits, but some stimulations provoked electrographic seizures. Stimulation of an adjacent electrode pair in the occipital lobe elicited the illusion that the examiner suddenly moved. No language deficits were elicited, although testing was done only with speech and not with sign.
Figure 4. ECS findings in relation to electrodes with significant high gamma activity during sign and speech production.
Electrical cortical stimulation (ECS) results are overlaid over significantly active high gamma electrodes during speech production (blue) and sign (red) production and control right-hand reaching movements (green) and their overlap, as in figure 2A. All electrodes displayed were stimulated. Stimulation pairs are depicted with blue pairs representing face involvement, red pairs representing right upper extremity involvement. Language was tested only using speech, and no speech language deficits were elicited. Cartoon depicts type of deficit elicited, with solid color representing positive motor, black cross-hatch pattern representing negative motor, and white cross-hatch pattern representing sensory.
Temporal dynamics during sign and speech production
To map the propagation of significant high gamma activity during sign production and speech production, we determined the onset of significant high gamma activity using a Wilcoxon signed-rank test on trial activity moving across time with a sliding window, FDR corrected for multiple comparisons. During sign, the superior parietal region was active first at a median of 119 milliseconds before the onset of sign production (figure 5). High gamma activity subsequently propagated to the perirolandic regions, the onset of which overlapped with the onset of sign production, and then the dorsal frontal, inferior parietal, middle temporal, and inferior temporal regions, the onset of which occurred after sign production. During speech, the inferior parietal, dorsal frontal, middle temporal, precentral, and postcentral regions were active first and before the onset of speech production, while the superior temporal and inferior parietal regions were active after the onset of speech production.
Discussion
Our ECoG study revealed that the production of spoken and signed language used 2 distinct networks, and ECS supported this finding. The temporal resolution of ECoG allowed us to study the temporal propagation during sign and speech production. Our findings revealed that the superior parietal region is active before sign production, suggesting its role in the planning and execution of signs.
Superior parietal activity was specific to sign language production and did not contain right-hand motor activity or speech language activity. This region was active first, with a median onset of activation 119 milliseconds before sign production. ECS of the sign-active electrodes in the superior parietal region did not produce any motor/sensory deficits, suggesting that they are higher-order regions involved with sign language production. In addition, ECS did not elicit language deficits during speech, supporting that these sign-active electrodes are not involved during spoken language and are unique to sign language. Sign production could not be tested during ECS to confirm this due to clinical constraints. Previous studies have implicated the left superior parietal region during signing18–24 and suggested its role in the spatial configuration and location of hands,19 control of learned motor movements,20 or linguistic working memory during motor rehearsal.21 In addition, the left superior parietal region may support planning of goal-directed reaching movements25 and the bilateral superior parietal regions in visual spatial attention.26,27 A left parietal lesion study in a deaf signer also revealed deficits in sign morphology (reduced sign inventory), syntax (simplified word order), semantics, and distortions in sign space, but the signer had preserved nonlinguistic spatial functioning.28 Compared to the only other published ECoG study on sign language by Crone et al.,7 higher gamma activity was also identified in the superior parietal lobe during signing compared to speech. However, the temporal dynamics of this activation were not provided. They also found that ECS in the superior parietal lobe interfered with signed word production during a visual naming and visual word repetition task. Thus, the timing of superior parietal activation was previously unknown. Our findings indicate that superior parietal activity occurs before sign production, suggesting that this region is not involved with the monitoring of learned motor movements20 or monitoring of proprioceptive language output,18,23 although a subsequent role in monitoring is possible. We postulate that the left superior parietal region has a specialized role in the spatial configuration of hands during language production.
Posterior temporal activity was also specific to sign language and did not contain right-hand motor activity or speech language activity. It was active after sign production, a median of 440 milliseconds later. Our findings are consistent with prior studies that also have found posterior temporal region (V5/MT) activity during signing.29,30 This region is likely involved with motion processing monitoring,31 and our findings of activity onset after sign production support this.
Perirolandic activity likely represents primary motor regions involved with sign production. High gamma activity was seen during both sign language production and right-hand reaching movements. ECS also identified right upper limb sensorimotor functions in these regions. This is consistent with what Crone et al.7 found during their study. Our ECS results did identify overlapping sensorimotor functions in the perirolandic region; however, this is consistent with what prior studies have found during ECS.32,33
We found no significant sign-specific activity in the superior temporal gyrus; however, speech production was identified in this region. This is consistent with what Crone et al.7 found during their visual naming task. They identified superior temporal gyrus activity during auditory word repetition during signing. However, the activity occurred before sign production, and because their analysis was locked to stimulus presentation, it represents the participant hearing the auditory stimulus.
We did not have adequate coverage of the inferior frontal gyrus or anterior temporal regions to make any conclusions about these areas. We suspect that there would have been more overlap between sign and speech production in these regions as prior fMRI studies have established.1–3 ECS of the left inferior frontal gyrus during sign has also elicited reduced movements and blocked signs and caused mistakes in hand shape and location.34 We suspect that our ECS did not reveal any speech language areas, likely due to lack of coverage in these regions. It is also important to note that ECS identifies critical language areas, and a limitation of this technique is that a language region may be missed if alternative regions are able to compensate for the disruption caused by ECS.
The main limitation in our study was our electrode coverage. Coverage was determined by clinical needs, and although we had extensive coverage over the left temporal-parietal region, inferior frontal and anterior temporal coverage was limited. In addition, we did not have coverage over the right hemisphere, so we cannot make any conclusions about the lateralization of our findings.
Another limitation of our study was that we failed to find significant differences between the language tasks during signing, specifically between visual naming and visual word repetition and between auditory naming and auditory word repetition. Because visual and auditory naming involves more semantic processing than repetition, we expected to find greater high gamma activity in the naming tasks or regions specific to semantic processing. We suspect that these differences are located, among other regions, in the inferior frontal and anterior temporal regions, which were not sampled. Similarly, Crone et al.7 found high gamma activity for both visual naming and visual word repetition in the superior parietal regions. Overall, their study did not find significant differences between visual naming or visual word repetition; they also had limited inferior frontal coverage.
This study provides a unique window into the spatiotemporal differences during production between a spoken and signed language. It identifies a distinct network for sign production in the perirolandic, parietal, and posterior temporal regions that is not involved during speech production. ECoG provided high-resolution temporal dynamics of these regions. Our findings reveal that the superior parietal region is active before sign onset, implicating its role in the planning and production of sign language, potentially analogous to the role of the Broca area in prearticulatory planning during speech production.
Acknowledgment
The authors acknowledge the Finding a Cure for Epilepsy and Seizures Foundation and the patient for participating in this research. A.F. acknowledges R01 award 1R01NS109367-01A1 from the NIH.
Glossary
- ASL
American Sign Language
- ECoG
electrocorticography
- ECS
electrical cortical stimulation
- FDR
false discovery rate
Appendix. Authors
Footnotes
Podcast: NPub.org/y9wu62
Study funding
This work is supported by Finding a Cure for Epilepsy and Seizures and R01NS109367-01A1 from the NIH.
Disclosure
The authors report no disclosures relevant to this manuscript. Go to Neurology.org/N for full disclosures.
References
- 1.Gordon N. The neurology of sign language. Brain Dev 2004;26:146–150. [DOI] [PubMed] [Google Scholar]
- 2.MacSweeney M, Capek CM, Campbell R, Woll B. The signing brain: the neurobiology of sign language. Trends Cogn Sci 2008;12:432–440. [DOI] [PubMed] [Google Scholar]
- 3.Corina DP, Lawyer LA, Cates D. Cross-linguistic differences in the neural representation of human language: evidence from users of signed languages. Front Psychol 2013;3:1–8. [DOI] [PMC free article] [PubMed] [Google Scholar]
- 4.Leonard MK, Ferjan Ramirez N, Torres C, Hatrak M, Mayberry RI, Halgren E. Neural stages of spoken, written, and signed word processing in beginning second language learners. Front Hum Neurosci 2013;7:1–14. [DOI] [PMC free article] [PubMed] [Google Scholar]
- 5.Blanco-Elorrieta E, Kastner I, Emmorey K, Pylkkänen L. Shared neural correlates for building phrases in signed and spoken language. Sci Rep 2018;8:5492. [DOI] [PMC free article] [PubMed] [Google Scholar]
- 6.Buzsáki G, Anastassiou CA, Koch C. The origin of extracellular fields and currents: EEG, ECoG, LFP and spikes. Nat Rev Neurosci 2012;13:407–420. [DOI] [PMC free article] [PubMed] [Google Scholar]
- 7.Crone NE, Hao L, Hart J, et al. Electrocorticographic gamma activity during word production in spoken and sign language. Neurology 2001;57:2045–2053. [DOI] [PubMed] [Google Scholar]
- 8.Yang AI, Wang X, Doyle WK, et al. Localization of dense intracranial electrode arrays using magnetic resonance imaging. Neuroimage 2012;63:157–165. [DOI] [PMC free article] [PubMed] [Google Scholar]
- 9.Rossion B, Pourtois G. Revisiting Snodgrass and Vanderwart's object pictorial set: the role of surface detail in basic-level object recognition. Perception 2004;33:217–236. [DOI] [PubMed] [Google Scholar]
- 10.Hamberger MJ, Friedman D, Rosen J. Completion norms collected from younger and older adults for 198 sentence contexts. Behav Res Methods Instruments Comput 1996;28:102–108. [Google Scholar]
- 11.Hamberger MJ, Seidel WT. Auditory and visual naming tests: normative and patient data for accuracy, response time, and tip-of-the-tongue. J Int Neuropsychol Soc 2003;9:479–489. [DOI] [PubMed] [Google Scholar]
- 12.Morrison C, Carlson CE. Electrocortical Mapping of Language: Handbook on the Neuropsychology of Epilepsy [online]. New York: Springer New York; 2015;139–154. [Google Scholar]
- 13.Flinker A, Chang EF, Kirsch HE, Barbaro NM, Crone NE, Knight RT. Single-trial speech suppression of auditory cortex activity in humans. J Neurosci 2010;30:16643–16650. [DOI] [PMC free article] [PubMed] [Google Scholar]
- 14.Flinker A, Korzeniewska A, Shestyuk AY, et al. Redefining the role of Broca's area in speech. Proc Natl Acad Sci USA 2015;112:2871–2875. [DOI] [PMC free article] [PubMed] [Google Scholar]
- 15.Mukamel R, Gelbard H, Arieli A, Hasson U, Fried I, Malach R. Coupling between neuronal firing, field potentials, and fMRI in human auditory cortex. Science 2005;309:951–954. [DOI] [PubMed] [Google Scholar]
- 16.Lachaux JP, Fonlupt P, Kahane P, et al. Relationship between task-related gamma oscillations and BOLD signal: new insights from combined fMRI and intracranial EEG. Hum Brain Mapp 2007;28:1368–1375. [DOI] [PMC free article] [PubMed] [Google Scholar]
- 17.Rich EL, Wallis JD. Decoding subjective decisions from orbitofrontal cortex. Nat Neurosci 2016;19:973–980. [DOI] [PMC free article] [PubMed] [Google Scholar]
- 18.Braun AR. The neural organization of discourse: an H215O-PET study of narrative production in English and American sign language. Brain 2001;124:2028–2044. [DOI] [PubMed] [Google Scholar]
- 19.MacSweeney M, Woll B, Campbell R, et al. Neural correlates of British Sign Language comprehension: spatial processing demands of topographic language. J Cogn Neurosci 2002;14:1064–1075. [DOI] [PubMed] [Google Scholar]
- 20.Emmorey K, Grabowski T, McCullough S, et al. Motor-iconicity of sign language does not alter the neural systems underlying tool and action naming. Brain Lang 2004;89:27–37. [DOI] [PubMed] [Google Scholar]
- 21.Buchsbaum B, Pickell B, Love T, Hatrak M, Bellugi U, Hickok G. Neural substrates for verbal working memory in deaf signers: fMRI study and lesion case report. Brain Lang 2005;95:265–272. [DOI] [PubMed] [Google Scholar]
- 22.Corina DP, Knapp H. Sign language processing and the mirror neuron system. Cortex 2006;42:529–539. [DOI] [PubMed] [Google Scholar]
- 23.Emmorey K, Mehta S, Grabowski TJ. The neural correlates of sign versus word production. Neuroimage 2007;36:202–208. [DOI] [PMC free article] [PubMed] [Google Scholar]
- 24.Emmorey K, McCullough S, Mehta S, Ponto LLB, Grabowski TJ. The biology of linguistic expression impacts neural correlates for spatial language. J Cogn Neurosci 2013;25:517–533. [DOI] [PMC free article] [PubMed] [Google Scholar]
- 25.Striemer CL, Chouinard PA, Goodale MA. Programs for action in superior parietal cortex: a triple-pulse TMS investigation. Neuropsychologia 2011;49:2391–2399. [DOI] [PubMed] [Google Scholar]
- 26.Corbetta M, Miezin F, Shulman G, Petersen S. A PET study of visuospatial attention. J Neurosci 1993;13:1202–1226. [DOI] [PMC free article] [PubMed] [Google Scholar]
- 27.Corbetta M, Shulman GL, Miezin FM, Petersen SE. Superior parietal cortex activation during spatial attention shifts and visual feature conjunction. Science 1995;270:802–805. [DOI] [PubMed] [Google Scholar]
- 28.Poizner H, Kegl J. Neural disorders of the linguistic use of space and movement. Ann NY Acad Sci 1993;682:192–213. [DOI] [PubMed] [Google Scholar]
- 29.MacSweeney M. Neural systems underlying British Sign Language and audio-visual English processing in native users. Brain 2002;125:1583–1593. [DOI] [PubMed] [Google Scholar]
- 30.Courtin C, Hervé PY, Petit L, et al. The neural correlates of highly iconic structures and topographic discourse in French Sign Language as observed in six hearing native signers. Brain Lang 2010;114:180–192. [DOI] [PubMed] [Google Scholar]
- 31.Born RT, Bradley DC. Structure and function of visual area MT. Annu Rev Neurosci 2005;28:157–189. [DOI] [PubMed] [Google Scholar]
- 32.Nii Y, Uematsu S, Lesser RP, Gordon B. Does the central sulcus divide motor and sensory functions: cortical mapping of human hand areas as revealed by electrical stimulation through subdural grid electrodes. Neurology 1996;46:360–367. [DOI] [PubMed] [Google Scholar]
- 33.Branco DM, Coelho TM, Branco BM, et al. Functional variability of the human cortical motor map: electrical stimulation findings in perirolandic epilepsy surgery. J Clin Neurophysiol 2003;20:17–25. [DOI] [PubMed] [Google Scholar]
- 34.Metellus P, Boussen S, Guye M, Trebuchon A. Successful insular glioma removal in a deaf signer patient during an awake craniotomy procedure. World Neurosurg 2017;98:883.e1–883.e5. [DOI] [PubMed] [Google Scholar]
Associated Data
This section collects any data citations, data availability statements, or supplementary materials included in this article.
Data Availability Statement
Anonymized data will be shared if requested by any qualified investigator.


