Abstract
Objective
To determine whether vascular risk and Alzheimer disease (AD) biomarkers have independent or synergistic effects on cognitive decline and whether vascular risk is associated with the accumulation of AD pathology as measured by change in biomarkers over time.
Methods
At baseline, participants (n = 168) were cognitively normal and primarily middle-aged (mean 56.4 years, SD 10.9 years) and had both vascular risk factor status and proximal CSF biomarkers available. Baseline vascular risk was quantified with a composite vascular risk score reflecting the presence or absence of hypertension, hypercholesterolemia, diabetes, current smoking, and obesity. CSF biomarkers of β-amyloid (Aβ)1–42, total tau (t-tau), and phosphorylated tau (p-tau) were used to create dichotomous high and low AD biomarker groups (based on Aβ1–42 and tau). Linear mixed-effects models were used to examine change in a cognitive composite score (mean follow-up 13.9 years) and change in CSF biomarkers (mean follow-up 4.2 years).
Results
There was no evidence of a synergistic relationship between the vascular risk score and CSF AD biomarkers and cognitive decline. Instead, the vascular risk score (estimate −0.022, 95% confidence interval [CI] −0.043 to −0.002, p = 0.03) and AD biomarkers (estimate −0.060, 95% CI −0.096 to −0.024, p = 0.001) were independently and additively associated with cognitive decline. In addition, the vascular risk score was unrelated to levels of or rate of change in CSF Aβ1–42, t-tau, or p-tau.
Conclusions
The results of this observational cohort study suggest that vascular risk and biomarkers of AD pathology, when measured in midlife, act along independent pathways and underscore the importance of accounting for multiple risk factors for identifying cognitively normal individuals at the greatest risk of cognitive decline.
When measured in midlife, vascular risk factors (e.g., hypertension, diabetes)1–4 and biomarkers of amyloid and tau pathology5,6 are each associated with cognitive decline and increased risk of developing clinical symptoms of dementia. However, few studies have examined whether these measures independently or synergistically affect cognitive decline with mixed results.7–9 In addition, the extent to which vascular risk factors affect cognitive trajectories of cognitively normal individuals in the presence of both amyloid and tau pathology remains to be determined.
It is also unclear whether vascular risk factors accelerate Alzheimer disease (AD) pathology. While some studies among cognitively normal participants and those without dementia have found more abnormal AD biomarker levels among individuals with higher vascular risk, findings have been inconsistent.10–19 In addition, longitudinal studies have failed to find relationships between vascular risk and changes in amyloid.20–22 Moreover, little is known about the impact of vascular risks on changes in tau.22 This question is particularly important given the accumulating evidence that amyloid is necessary but not sufficient to cause cognitive decline and dementia.23
This study examined (1) whether midlife vascular risk and CSF amyloid and tau biomarkers, measured among cognitively normal, primarily middle-aged individuals, independently or synergistically affect long-term cognitive trajectories and (2) whether vascular risk is associated with change in CSF biomarkers. The focus on primarily middle-aged participants is particularly important because AD pathology begins to develop in midlife24,25 and midlife (vs late-life) vascular risk factors may be differentially related to dementia risk.26
Methods
Standard protocol approvals, registrations, and patient consents
All participants provided written informed consent. This study was approved by the Johns Hopkins University (JHU) Institutional Review Board.
Study design and participant selection
Data for these analyses were derived from the Biomarkers for Older Controls at Risk for Dementia (BIOCARD) study, an ongoing longitudinal study designed to identify variables among cognitively normal individuals that predict subsequent development of mild to moderate symptoms of AD. As described previously,27 the study was initiated in 1995 at the NIH, with recruitment conducted between 1995 and 2005 by the staff of the Geriatric Psychiatry Branch of the intramural program of the National Institute of Mental Health. Participants were recruited through various sources, including printed materials, informational lectures, and word of mouth. Approximately 75% of the cohort had a first-degree relative with dementia of the Alzheimer type by design. At enrollment, participants completed a comprehensive evaluation consisting of a physical and neurologic examination, neuropsychological testing, an ECG, and standard laboratory studies. Individuals with cognitive impairment (as determined by the cognitive testing or evidence of clinical symptoms based on reports by the participant and collateral sources) or with significant medical problems (e.g., cardiovascular disease), severe cerebrovascular disease (CVD), chronic psychiatric or neurologic disorders, or alcohol or drug abuse were excluded from participation.
A total of 349 primarily middle-aged (mean 57.3 years, SD 10.4 years) individuals were enrolled in the study. While the study was at the NIH, participants were administered a comprehensive neuropsychological battery and clinical assessments annually; blood, CSF, and MRI scans were obtained biennially. The study was stopped in 2005 and re-established in 2009 by a research team from JHU, at which point annual clinical and cognitive assessments and collection of blood specimens were reinitiated. Collection of CSF and MRI scans was reinitiated in 2015.
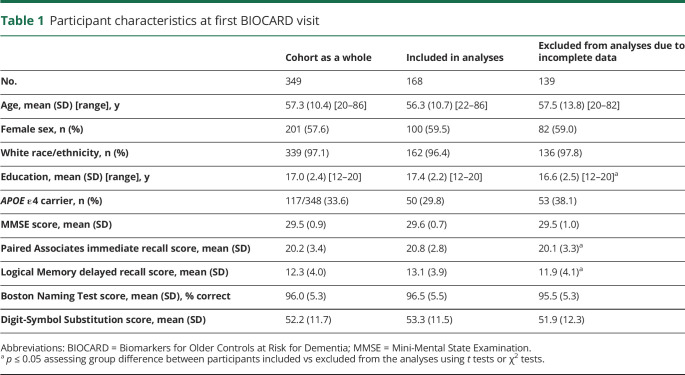
The analyses presented here included 168 participants who had both baseline vascular risk scores and CSF collected in the same time frame (i.e., CSF within 14 months of the baseline vascular risk score; mean time between baseline vascular risk score and matched CSF data −0.02 years, SD 0.17 years). Participants were excluded from analyses for the following reasons: (1) participants have not yet re-enrolled or had not given permission to use their previously acquired data (n = 28); (2) participants' estimated age at onset of clinical symptoms of mild cognitive impairment (MCI) was determined to be at or before their baseline vascular risk score (n = 14); (3) baseline vascular risk scores were missing (n = 70); and (4) no CSF draw was done within 14 months of baseline vascular risk score (n = 69). Table 1 shows the characteristics of participants excluded from the analyses due to incomplete data (i.e., missing vascular risk scores or no matching CSF measures) relative to the whole BIOCARD cohort and those included in the analyses.
Table 1.
Participant characteristics at first BIOCARD visit
Clinical assessment
The clinical assessments in the BIOCARD study have been completed annually, first at the NIH and subsequently at JHU.27 Clinical assessments include a physical and neurologic examination, record of medication use, behavioral and mood assessments, family history of dementia, history of symptom onset, neuropsychological testing, and a Clinical Dementia Rating28 (CDR) based on a semistructured interview.
All consensus diagnoses used in study analyses are based on procedures implemented by the staff of the JHU BIOCARD Clinical Core, with diagnoses completed prospectively for all JHU visits and retrospectively for all NIH visits. All cases are handled in a manner comparable with those used in the National Institute on Aging Alzheimer's Disease Centers program. First, a syndromic diagnosis is established (e.g., normal, MCI, dementia) from 3 sources of information: (1) clinical data pertaining to the medical, neurologic, and psychiatric status of the individual; (2) reports of changes in cognition by the individual and by collateral sources based on a semistructured interview (the CDR); and (3) decline in cognitive performance based on review of longitudinal testing from multiple domains (and comparison to published norms). Second, if a participant is deemed to be impaired, a decision is made about the likely etiology of the syndrome on the basis of the medical, neurologic, and psychiatric information collected at each visit, as well as medical records obtained from the participant when necessary. More than 1 etiology can be endorsed for each participant (e.g., AD and vascular disease; Parkinson disease and depression).
This consensus diagnosis procedure follows the diagnostic recommendations incorporated in the National Institute on Aging/Alzheimer’s Association working group reports for the diagnosis of MCI29 and dementia due to AD.30 A diagnosis of impaired not MCI is also used, reflecting this incorporation in the AD Centers Program diagnostic procedures. Within the context of this study, this diagnosis typically reflects contrasting information from the CDR interview and the cognitive test scores (i.e., the participant or collateral source expressed concerns about cognitive changes in daily life but the cognitive testing did not show changes or vice versa). Diagnoses (and determination of likely etiology) are made without knowledge of biomarker measures.
Cognitive assessment
The annual cognitive assessment consisted of a comprehensive battery of neuropsychological tests. Four tests from this battery were used to create a composite score to examine longitudinal cognitive trajectories using previously published procedures.6 This a priori–derived cognitive composite score included 4 measures previously identified to be the best combination of cognitive predictors of time to progress from normal cognition to clinical symptom onset in this cohort.27 These measures included Paired Associates immediate recall (Wechsler Memory Scale–Revised), Logical Memory delayed recall score (Story A; Wechsler Memory Scale–Revised), Boston Naming, and Digit-Symbol Substitution (Wechsler Adult Intelligence Scale–Revised). The cognitive composite score was calculated by transforming the individual measures to z scores and then averaging them. Thus, the standardized score has a mean of 0 at baseline. To maximize the amount of data available for modeling, at least 2 of the 4 scores were required to be present at a given time point (78% of the longitudinal composites were calculated with all 4 test scores). Cognitive test scores before an individual's baseline vascular risk score (described below) were excluded from analysis.
Composite vascular risk score
Vascular risk factors were established by medical records or self-report during a medical history interview. A composite vascular risk score was calculated with a previously published algorithm,11 which sums 5 dichotomous vascular risk factors (each coded as 0 = absent vs 1 = recent/remote): hypertension, hypercholesterolemia, diabetes, current smoking (i.e., within the last 30 days), and obesity based on body mass index >30 kg/m2. For the majority of participants, vascular risk scores were calculated at their first study visit; for the remaining participants, the first available vascular risk data were used (mean time between baseline vascular risk score and first study visit 0.08 years, SD 0.70 years, range −0.97 to 5.98 years). For the purposes of this study, baseline is therefore defined as first available vascular risk score. Because very few individuals had ≥3 risk factors, composite vascular risk scores were coded dichotomously (0 vs ≥1).
CSF AD biomarkers
Lumbar punctures were conducted after an overnight fast. A maximum of 30 mL CSF was drawn with a 20- or 22-gauge needle (1995–2000) or 25-gauge Whiteacre-point needle (starting in 2000) and divided into aliquots in polypropylene cryotubes, which were kept on dry ice (≈0.5 mL CSF per tube). Immediately after the collection, the cryotubes were transferred to a −80°C freezer for long-term storage. These samples were thawed for the first time after collection to run the assays described below.
The CSF assays used the xMAP-based AlzBio3 kit (Innogenetics, Ghent, Belgium) run on the Bioplex 200 system. The AlzBio3 kit contains monoclonal antibodies specific for β-amyloid (Aβ)1–42 (4D7A3), total tau (t-tau; AT120), and phosphorylated tau (p-tau181p; AT270), each chemically bonded to unique sets of color-coded beads, and analyte-specific detector antibodies (HT7, 3D6). Samples (run in triplicate) were analyzed on the same plate. Calibration curves, coefficients of variation, and comparison to published norms have been published previously.5,31
CSF measures were analyzed in 2 ways. (1) To examine the combined impact of the composite vascular risk score and biomarkers of both amyloid and tau pathology on cognitive trajectories, we used a previously published approach to create a dichotomous AD biomarker indicator variable that reflects the presence of both low Aβ1–42 and high t-tau (or low Aβ1–42 and high p-tau) at baseline on the basis of tertiles.6 Using all available baseline CSF, AD biomarker group status was coded as 1 if Aβ1–42 was in the lower one-third of the distribution and t-tau (or p-tau) was in the upper one-third of the distribution, reflecting the high AD biomarker group, or otherwise coded as 0 (low AD biomarker group). (This is conceptually similar to the stage 2 hypothetical preclinical AD group defined by significant alterations in biomarkers for both amyloid and tau, which has been proposed as 1 of 3 stages for categorizing cognitively normal individuals along a continuum of preclinical AD.32) Although the present study did not use clinically derived cut points for determining biomarker abnormality, in prior publications, we have found that the relationship between these biomarker groupings and longitudinal cognitive outcomes is fairly robust to variations in cut points (e.g., using quintiles).6 Note that the primary goal of these groupings was to dichotomize the variables as high vs low AD biomarker groups for statistical purposes, as opposed to using clinically defined cut points (e.g., normal vs abnormal). The impact of the composite vascular risk score and CSF biomarkers on cognitive trajectories was also evaluated with continuous CSF biomarker measures (as opposed to the AD biomarker indicator), as described in the sensitivity analyses below. (2) To examine the relationship between the composite vascular risk score and change in CSF biomarkers over time, CSF Aβ1–42, t-tau, and p-tau values were modeled as continuous variables with the use of CSF acquired at the NIH (CSF acquired at JHU was not included because biomarker harmonization is still ongoing).
APOE genotype
APOE genotypes were determined by restriction endonuclease digestion of PCR-amplified genomic DNA (performed by Athena Diagnostics, Worcester, MA). Genotypes were coded dichotomously (APOE ε4 carriers = 1, noncarriers = 0).
Statistical Analyses
The data were analyzed with longitudinal linear mixed-effects models that included random intercepts and slopes with unstructured covariance.33 Baseline age and education were centered using baseline means, and time (from baseline) was modeled in the unit of years. All other continuous variables (including dependent variables) were standardized as z scores before model fitting.
The first set of models examined the combined impact of the baseline composite vascular risk score and baseline CSF AD biomarker indicators (low vs high) on longitudinal change in cognition. Separate models were run with the AD biomarker indicator defined by Aβ1–42 and t-tau and by Aβ1–42 and p-tau. The model predictors included time, as well as baseline age, sex, APOE ε4 genotype, education (years), vascular risk score, AD biomarker indicator, their interaction (cross-product) with time, vascular risk score × AD biomarker indicator interaction, and vascular risk score × AD biomarker indicator × time interaction. The 3-way interactions examined the possible synergism between baseline vascular risk and AD biomarkers on cognitive trajectories. If this term was not significant, we ran reduced models that excluded this term (and the vascular risk score × AD biomarker indicator term) to examine the independent associations between vascular risk and AD biomarkers with the rate of change in cognition (as indicated by the composite vascular risk score × time and AD biomarker indicator × time interaction term, respectively). In sensitivity analyses, these models were rerun using continuous measures of Aβ1–42, t-tau, p-tau, and the ratios of t-tau/Aβ1–42 and p-tau/Aβ1–42 (as opposed to the AD biomarker indicators).
The second set of linear mixed-effects models tested the relationship between the composite vascular risk score and longitudinal change in CSF AD biomarkers. Separate models were run with Aβ1–42, t-tau, and p-tau as outcome variables. The model predictors included time, as well as baseline age, sex, APOE ε4 genotype, vascular risk score, and their interactions with time. In sensitivity analyses, these models were rerun using the log-transformed ratios of t-tau/Aβ1–42 or p-tau/Aβ1–42 (to correct for skewness) as outcome variables to assess the association with combined Aβ1–42 and tau/p-tau. All analyses were run in Stata/IC (version 15.1; StataCorp, College Station, TX). Estimates and 95% confidence intervals (CIs) are reported for final models, and values of p ≤ 0.05 were considered significant.
Data availability
Anonymized data used in the analyses presented in this report are available on request from qualified investigators (biocard-se.org).
Results
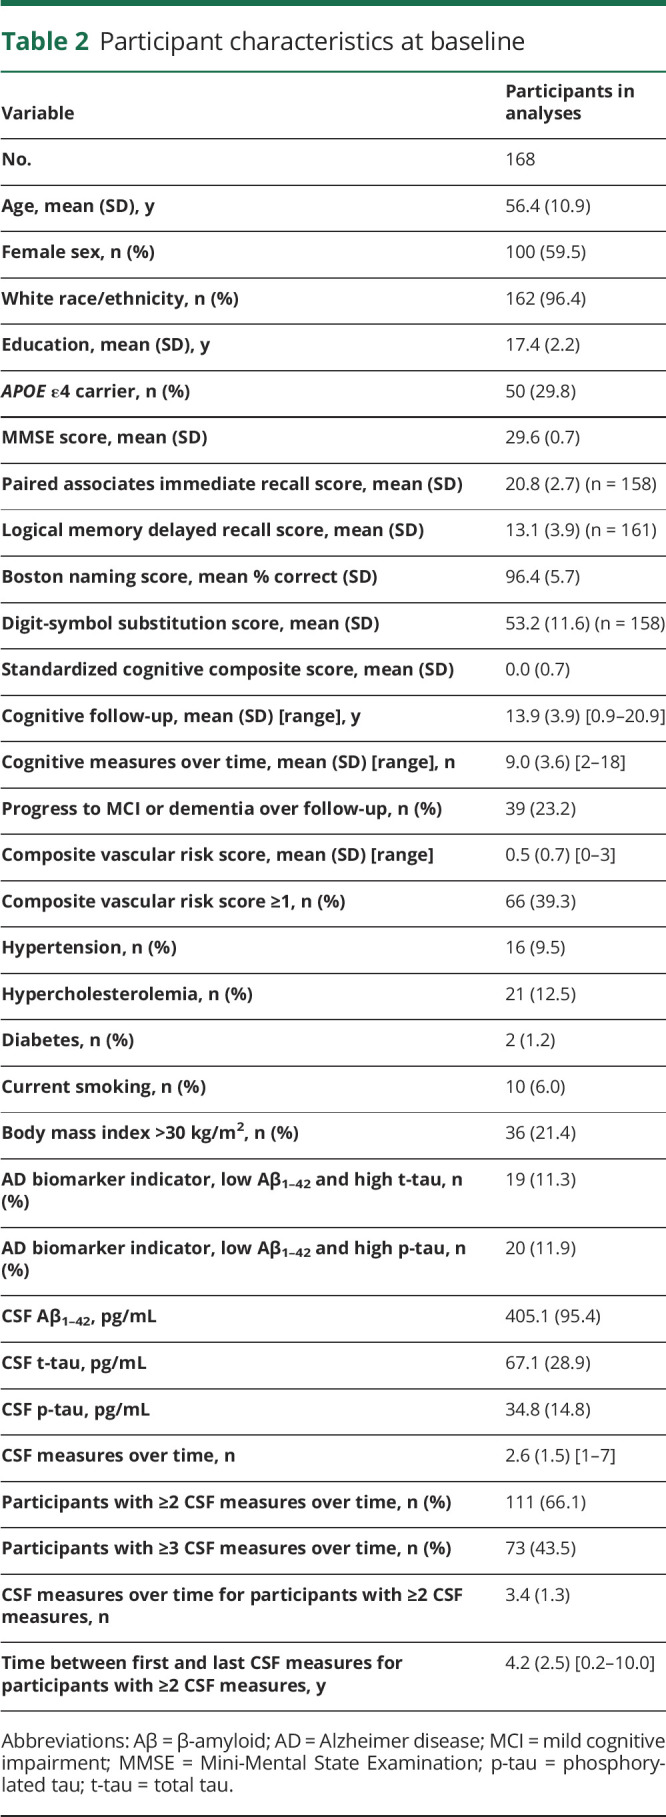
At baseline, participants were primarily middle-aged; the majority were white and highly educated (table 2).
Table 2.
Participant characteristics at baseline
Vascular risk, AD biomarkers, and change in cognition
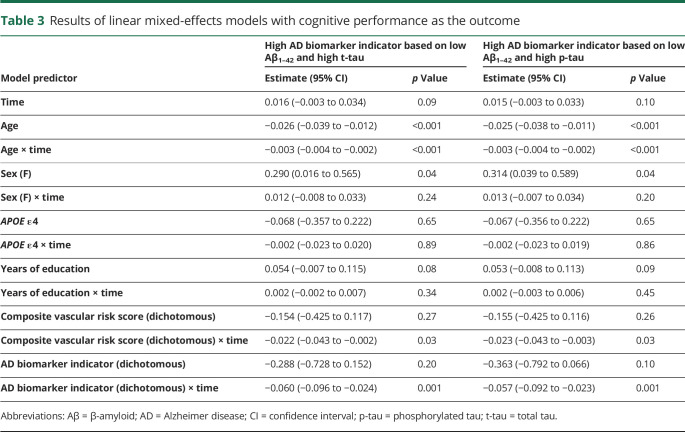
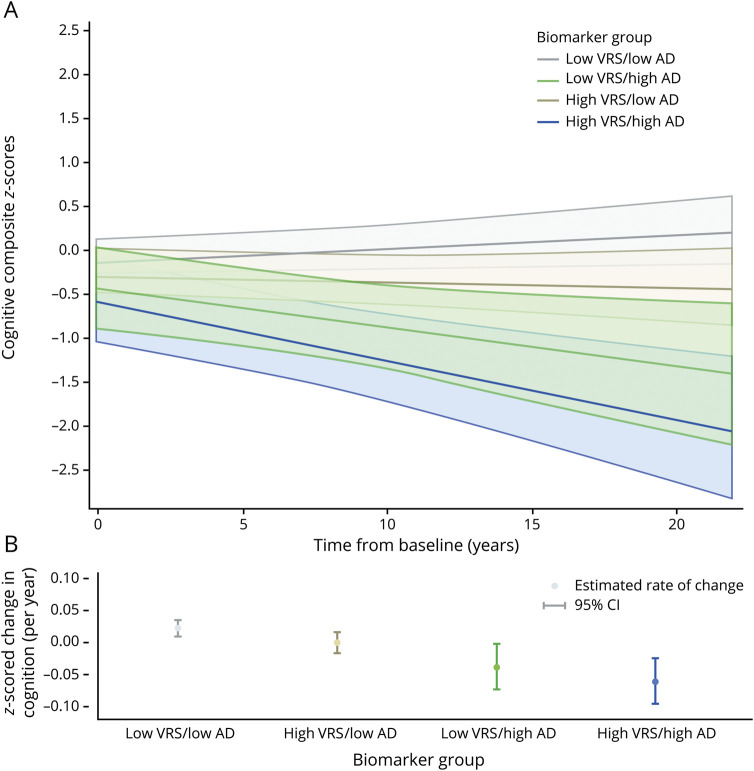
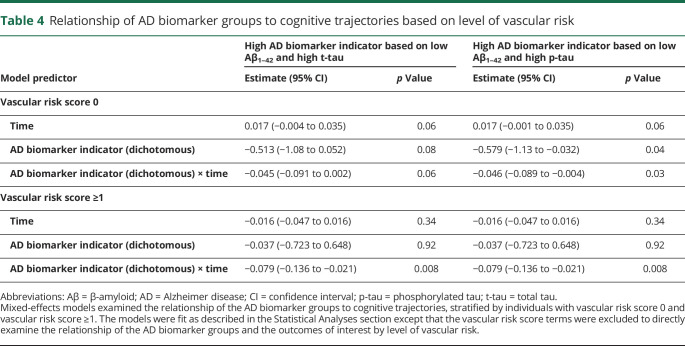
On average, participants had 9.0 occasions of cognitive assessments over time, with 13.9 years of follow-up. Results examining longitudinal cognitive trajectories as the outcome were identical whether CSF Aβ1–42 and t-tau or Aβ1–42 and p-tau were used to define AD biomarker group membership. There were no significant 3-way vascular risk score × AD biomarker indicator × time interactions (all p > 0.50, data not shown), providing no statistical evidence that the association between the AD biomarker indicator and cognitive trajectories differed by baseline vascular risk. In the reduced models (table 3), there were significant effects of age and age × time (indicating lower cognitive performance and steeper cognitive decline among older individuals) and sex (indicating higher cognitive performance among women). Of primary interest, the vascular risk score and AD biomarker indicator were each independently associated with steeper cognitive decline (figure; table 4 provides models stratified by vascular risk).
Table 3.
Results of linear mixed-effects models with cognitive performance as the outcome
Figure. Estimates of longitudinal cognitive change based on the composite vascular risk score (0 vs ≥1) and AD biomarker group defined by Aβ1-42 and t-tau (low vs high; see text for details).
(A) Adjusted estimates from linear mixed-effects models predicting cognitive composite scores (95% confidence interval [CI]) over time. (B) Adjusted estimates of annual rate of change in cognitive composite scores (95% CI). Predicted marginal rates of global cognitive change were as follows: low vascular risk score (VRS)/low Alzheimer disease (AD) biomarker group estimate 0.022 (95% CI 0.010–0.035); high VRS/low AD biomarker group estimate 0.000 (95% CI −0.016 to 0.016); low VRS/high AD biomarker group estimate −0.038 (95% CI −0.073 to −0.002); and high VRS/high AD biomarker group estimate −0.060 (95% CI −0.096 to −0.024). Corresponding rates of global cognitive change for the CSF biomarker indicator based on β-amyloid1-42 and phosphorylated tau (p-tau) are nearly identical (data not shown). Estimates are adjusted for age, sex, education, APOE ε4 genotype, and their interactions with time. t-tau = total tau.
Table 4.
Relationship of AD biomarker groups to cognitive trajectories based on level of vascular risk
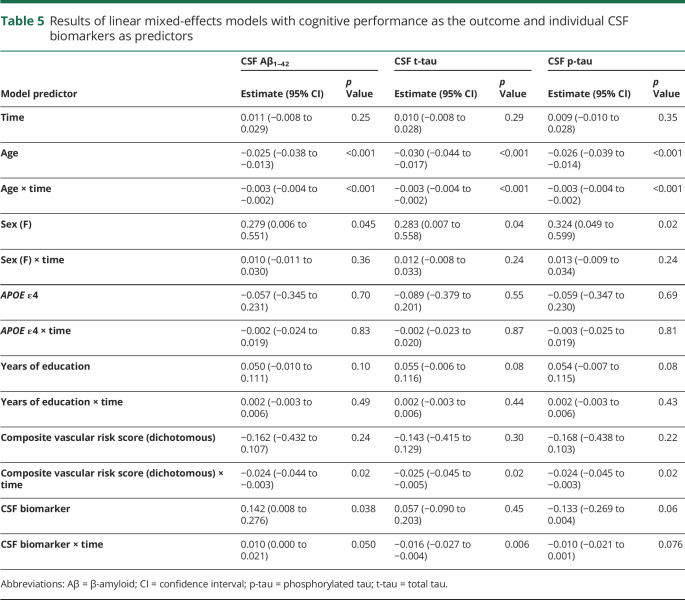
The patterns of results were similar in sensitivity analyses that used continuous measures of Aβ1–42, t-tau, and p-tau (as opposed to the AD biomarker indicators; table 5) or the ratios of t-tau/Aβ1–42 and p-tau/Aβ1–42 (data not shown). For each set of analyses, there were no significant 3-way vascular risk score × CSF biomarker × time interactions (all p > 0.16), and the reduced models showed significant vascular risk score × time and CSF biomarker × time interactions (with the exception of p-tau × time, estimate −0.010 [95% CI −0.021 to 0.001], p = 0.076). Patterns of results were also unchanged in sensitivity analyses that excluded the APOE ε4 and APOE ε4 × time covariates (data not shown). Likewise, similar results were obtained when the vascular risk score was treated as a continuous variable (data not shown).
Table 5.
Results of linear mixed-effects models with cognitive performance as the outcome and individual CSF biomarkers as predictors
Vascular risk and change in AD biomarkers
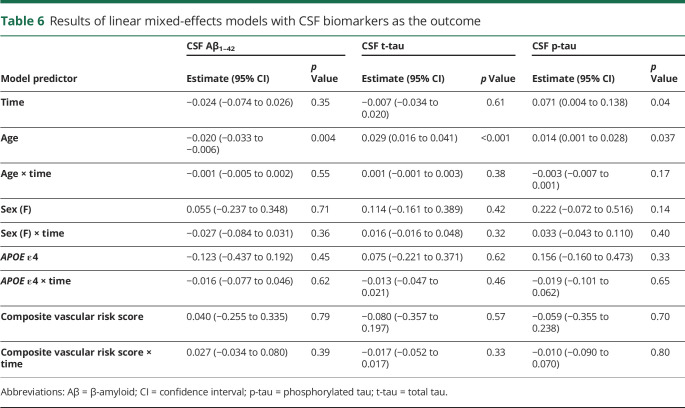
On average, participants had 2.6 CSF measures over time; 66% (111 of 168) of participants had ≥2 CSF measures with an average of 3.4 CSF measures. Results of the models examining the relationship of the vascular risk score to level of and rate of change in the CSF biomarkers are shown in table 6. There were main effects of age, indicating more abnormal baseline CSF biomarkers levels among older participants. For CSF p-tau, there was also a main effect of time (indicating an increase in p-tau over time). (In reduced models that excluded nonsignificant interaction terms, the main effect of time was also significant for Aβ1–42—estimate −0.035 [95% CI −0.064 to −0.006], p = 0.019—indicating a decrease in Aβ1–42 over time.) The main effects of the composite vascular risk score and the vascular risk score × time interactions were not significant, indicating no relationship between vascular risk and baseline levels of or rate of change in CSF biomarkers over time. The patterns of results were the same when the log-transformed ratio of t-tau/Aβ1–42 or p-tau/Aβ1–42 was used as the dependent variable and when the APOE ε4 and APOE ε4 × time covariates were excluded (data not shown).
Table 6.
Results of linear mixed-effects models with CSF biomarkers as the outcome
Discussion
In this longitudinal study of individuals who were cognitively normal and primarily middle-aged at baseline, the composite vascular risk score and CSF AD biomarkers were each independently associated with cognitive decline over 13.9 years on average. Because there were no significant 3-way interactions, these results suggest that vascular risks and CSF AD biomarkers have additive effects on cognitive trajectories whereby the combined effects of these variables are not greater than the sum of their parts. In addition, the composite vascular risk score was unrelated to levels of or short-term rate of change in AD biomarkers (over 4.2 years on average), as measured by CSF Aβ1–42, t-tau, or p-tau. Taken together, these results suggest that vascular risk and AD biomarkers, when measured in midlife, appear to act in an independent and additive manner rather than synergistically.
The results of this study suggest that vascular risk, measured among primarily middle-aged cognitively normal individuals, affects longitudinal cognitive trajectories independently from the combined effects of biomarkers of amyloid and tau pathology. This is important given that cognitively normal individuals with biomarker evidence of both amyloid and tau pathology/neurodegeneration (sometimes referred to as hypothetical stage 232) are at the greatest risk for cognitive decline compared to those with only 1 or no abnormal AD biomarkers.6,34,35 Similar to a prior study that measured AD pathology with amyloid imaging among cognitively normal individuals in their 70s,9 we found that vascular risk and CSF measures of AD pathology are each associated with cognitive decline. However, unlike that prior study, we found that these effects were not synergistic but additive. There are several possible reasons for these differences, including differences in baseline age (56.4 vs 73.7 years), duration of follow-up (13.9 vs 3.7 years), level of vascular risk, and method of AD biomarker measurement (CSF amyloid and tau vs amyloid PET). Nonetheless, together, these studies emphasize that even low levels of vascular risk affect the cognitive trajectories of cognitively normal individuals, after accounting for levels of AD biomarkers.
Notably, our results are also consistent with prior studies among cognitively normal individuals that have found that biomarkers of AD and CVD (e.g., infarcts, white matter hyperintensities) have independent effects on longitudinal cognitive outcomes36–38 and with neuropathologic studies suggesting that cerebrovascular and AD pathologies have additive effects on the threshold for dementia.39,40
Providing additional support for the independence of vascular risk and biomarkers of AD pathology, we found no evidence that vascular risk promoted the short-term accumulation of amyloid or tau pathology as measured by CSF biomarkers. Similar findings have been reported in other studies examining short-term rates of change in biomarkers of amyloid pathology.20–22 Consistent with the present results, a recent study reported that midlife atherosclerosis, measured among cognitively normal individuals, was associated with cerebral small vessel disease measured ≈20 years later but not with CSF biomarkers of AD pathology.41 However, other studies have reported associations between midlife vascular risk and amyloid abnormality ≈20 years later.11,15 Prior studies examining cardiovascular risk in relationship to short-term change in biomarkers of tau pathology among individuals who were cognitively normal at baseline are limited. Contrary to our results, Bos et al.22 found that higher vascular risk, particularly hypertension, was associated with an increase in CSF t-tau and p-tau over a mean of follow-up of 2.1 years (mean baseline age 68 years), with the strongest effects in the small subset of individuals classified as amyloid and tau positive at baseline (n = 23 with mean 1.7 years of follow-up). The authors interpreted these associations as reflecting hypertension-related changes in neurodegeneration, raising the possibility that relationships may differ for individual vascular risk factors vs composite vascular risk scores. Although it is unclear why findings differ across studies with respect to CSF t-tau and p-tau, the reason might be related to differences in study design (i.e., use of a composite vascular risk score vs individual risk factors), baseline age among participants, and levels of cardiovascular risk. Because AD pathology accumulates over years to decades, it will be important to examine the association between midlife vascular risk and longitudinal rates of change of AD pathology over longer periods of follow-up using both composite vascular risk scores and individual vascular risk factors.
In addition, several neuropathologic studies have found no relationship between vascular risk and levels of AD pathology at autopsy,42–44 although this is not universally true.45,46 Notably, it has been suggested that vascular risk factors, when measured among population-based, prospective studies, are not associated with the subsequent degree of AD pathology at autopsy but instead appear to affect cognitive outcomes through concomitant CVD and vascular brain injury.47
As reviewed elsewhere, there are a number of ways by which AD pathology and measures related to vascular risk may combine on a pathophysiologic level to exert additive effects on cognitive outcomes, which may include downstream effects on neuronal function, cerebral perfusion, and cortical atrophy.48,49 More work is needed to better understand the independent and shared mechanisms by which these risk factors affect cognitive trajectories and the time course of these processes. Nonetheless, targeting modifiable midlife vascular risk factors to lower the burden of CVD may be a promising avenue for interventions designed to reduce late-life cognitive decline and dementia risk.
In line with prior work in this cohort,6 the model indicators reflecting AD biomarker status had a significant relationship with longitudinal cognitive decline. More abnormal levels of amyloid and tau were associated with a marked decline in cognition, regardless of whether the AD biomarker indicator was defined using CSF Aβ1–42 and t-tau or Aβ1–42 and p-tau. Although p-tau levels are thought to be more directly related to the neurofibrillary tau tangle pathology found in AD and levels of t-tau are thought to reflect more general neurodegeneration/neuronal injury (i.e., due to both AD and non-AD causes such as CVD), they tend to be strongly correlated among individuals with limited coexisting pathologies.50 In this study, there was a strong correlation between these measures [r(166) = 0.67, p < 0.001] and therefore high concordance in the 2 AD biomarker groups. We hypothesize that this is because much of this cohort's elevation in t-tau is due to AD-related processes given the cohort's relatively young age, strong family history of AD, and proportion of APOE ε4 carriers.
This study has a number of strengths. For example, the cohort's characteristics allowed us to examine associations between vascular risk and AD biomarkers in a younger cohort with longer follow-up and a more comprehensive set of AD biomarkers than has been done previously. The current study also has limitations. First, BIOCARD participants are highly educated and primarily white and have a strong family history of AD dementia, which limits the generalizability of these findings to the population at large. Second, participants had very low levels of vascular risk, and the individual vascular risk factors were dichotomized and determined during the medical history interview rather than objective measurements or medication use. This limits the generalizability of these findings, and we cannot rule out the possibility that vascular risk was underestimated or that the results would have been different with the use of objectively determined vascular risk scores, with the use of continuous measures of vascular risk, or in a sample with greater variability in vascular risk or clinical evidence of CVD. Third, the sample size was limited, and we therefore may have been underpowered to detect a 3-way interaction between vascular risk and CSF biomarkers on cognitive trajectories. Fourth, although participants were largely middle-aged at baseline (i.e., 83% were 40–69 years of age), the sample included a large age range (22–86 years). Of note, sensitivity analyses demonstrated comparable results when the age range excluded individuals <45 years of age. Lastly, although participants had undergone 13.9 years of cognitive follow-up, on average, the duration of CSF follow-up was more limited. Future studies examining the relationship of vascular risk factors to biomarker trajectories over longer intervals are critically needed given that the pathologic process underlying cognitive decline likely occurs over decades.
These results underscore the importance of accounting for multiple risk factors for identifying cognitively normal individuals at the greatest risk of cognitive decline and the need for interventions designed to reduce the burden of midlife vascular risks.
Acknowledgment
The authors acknowledge the contributions of the Geriatric Psychiatry Branch of the intramural program of National Institute of Mental Health who initiated the study (principal investigator, Dr. Trey Sunderland). The authors are particularly indebted to Dr. Karen Putnam, who has provided ongoing documentation of the Geriatric Psychiatry Branch study procedures and the data files received from National Institute of Mental Health.
Glossary
- Aβ
β-amyloid
- AD
Alzheimer disease
- BIOCARD
Biomarkers for Older Controls at Risk for Dementia
- CDR
Clinical Dementia Rating
- CI
confidence interval
- CVD
cerebrovascular disease
- JHU
Johns Hopkins University
- MCI
mild cognitive impairment
- p-tau
phosphorylated tau
- t-tau
total tau
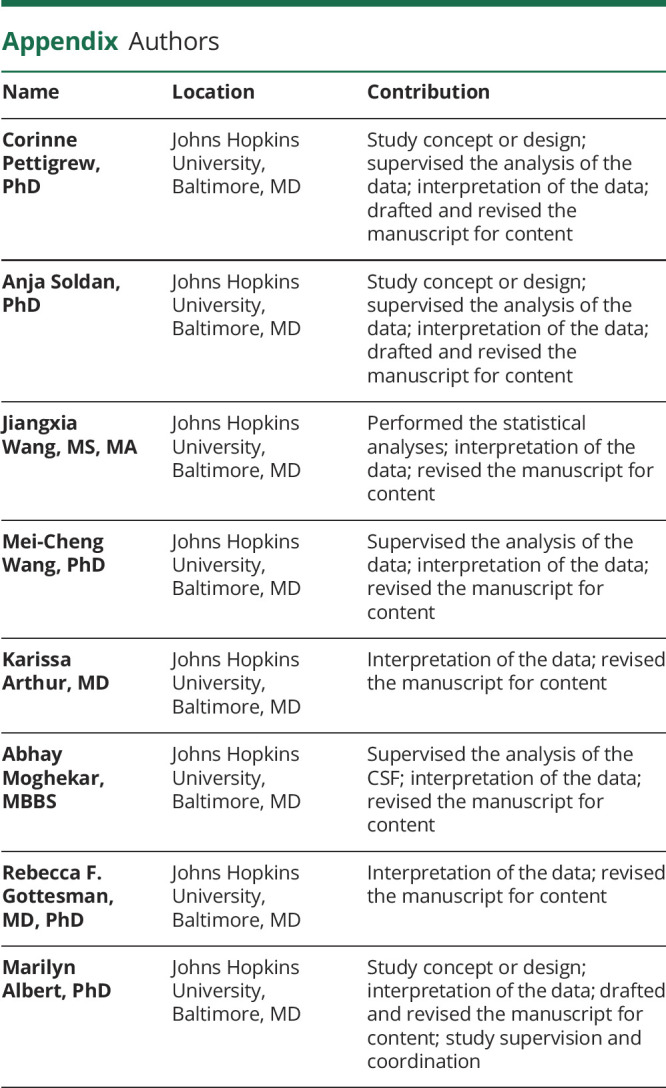
Appendix. Authors
Study funding
This work was supported by the NIH (grants U19-AG033655, P50-AG005146). The BIOCARD Study consists of 7 cores with the following members: (1) the Administrative Core (Marilyn Albert, Rostislav Brichko); (2) the Clinical Core (Marilyn Albert, A. Soldan, C. Pettigrew, R.F. Gottesman, Ned Sacktor, Scott Turner, Leonie Farrington, Jules Gilles, Maura Grega, Gay Rudow, Scott Rudow); (3) the Imaging Core (Michael Miller, Susumu Mori, Tilak Ratnanather, Timothy Brown, Andrea Faria, Anthony Kolasny, Kenichi Oishi, Laurent Younes); (4) the Biospecimen Core (A. Moghekar, Jacqueline Darrow, Richard O'Brien); (5) the Informatics Core (Roberta Scherer, David Shade, Ann Ervin, Jennifer Jones, Hamadou Coulibaly, Kathy Moser); (6) the Biostatistics Core (M.-C. Wang, Daisy Zhu, J. Wang); and (7) the Neuropathology Core (Juan Troncoso, Olga Pletnikova, Gay Rudow, Karen Fisher). The authors are grateful to the members of the BIOCARD Scientific Advisory Board who provide continued oversight and guidance regarding the conduct of the study, including Drs. John Csernansky, David Holtzman, David Knopman, Walter Kukull, and Kevin Grimm, and Drs. John Hsiao and Laurie Ryan, who provide oversight on behalf of the National Institute on Aging. The authors thank the members of the BIOCARD Resource Allocation Committee who provide ongoing guidance regarding the use of the biospecimens collected as part of the study, including Drs. Constantine Lyketsos, Carlos Pardo, Gerard Schellenberg, Leslie Shaw, Madhav Thambisetty, and John Trojanowski.
Disclosure
C. Pettigrew, A. Soldan, J. Wang, M.-C. Wang, and K. Arthur report no disclosures relevant to the manuscript. A. Moghekar has a research grant from Fujirebio Diagnostics. R.F. Gottesman is an associate editor for Neurology. M. Albert is an advisor to Eli Lily. Go to Neurology.org/N for full disclosures.
References
- 1.Gottesman RF, Albert MS, Alonso A, et al. Associations between midlife vascular risk factors and 25-year incident dementia in the Atherosclerosis Risk in Communities (ARIC) cohort. JAMA Neurol 2017;74:1246–1254. [DOI] [PMC free article] [PubMed] [Google Scholar]
- 2.Kivipelto M, Helkala EL, Laakso MP, et al. Midlife vascular risk factors and Alzheimer's disease in later life: longitudinal, population based study. BMJ 2001;322:1447–1451. [DOI] [PMC free article] [PubMed] [Google Scholar]
- 3.Meng XF, Yu JT, Wang HF, et al. Midlife vascular risk factors and the risk of Alzheimer's disease: a systematic review and meta-analysis. J Alzheimers Dis 2014;42:1295–1310. [DOI] [PubMed] [Google Scholar]
- 4.Rawlings AM, Sharrett AR, Schneider AL, et al. Diabetes in midlife and cognitive change over 20 years: a cohort study. Ann Intern Med 2014;161:785–793. [DOI] [PMC free article] [PubMed] [Google Scholar]
- 5.Moghekar A, Li S, Lu Y, et al. CSF biomarker changes precede symptom onset of mild cognitive impairment. Neurology 2013;81:1753–1758. [DOI] [PMC free article] [PubMed] [Google Scholar]
- 6.Soldan A, Pettigrew C, Cai Q, et al. Hypothetical preclinical Alzheimer disease groups and longitudinal cognitive change. JAMA Neurol 2016;73:698–705. [DOI] [PMC free article] [PubMed] [Google Scholar]
- 7.Clark LR, Koscik RL, Allison SL, et al. Hypertension and obesity moderate the relationship between beta-amyloid and cognitive decline in midlife. Alzheimers Dement 2019;15:418–428. [DOI] [PMC free article] [PubMed] [Google Scholar]
- 8.Hohman TJ, Samuels LR, Liu D, et al. Stroke risk interacts with Alzheimer's disease biomarkers on brain aging outcomes. Neurobiol Aging 2015;36:2501–2508. [DOI] [PMC free article] [PubMed] [Google Scholar]
- 9.Rabin JS, Schultz AP, Hedden T, et al. Interactive associations of vascular risk and beta-amyloid burden with cognitive decline in clinically normal elderly individuals: findings from the Harvard Aging Brain Study. JAMA Neurol 2018;75:1124–1131. [DOI] [PMC free article] [PubMed] [Google Scholar]
- 10.Enache D, Solomon A, Cavallin L, et al. CAIDE Dementia Risk Score and biomarkers of neurodegeneration in memory clinic patients without dementia. Neurobiol Aging 2016;42:124–131. [DOI] [PubMed] [Google Scholar]
- 11.Gottesman RF, Schneider AL, Zhou Y, et al. Association between midlife vascular risk factors and estimated brain amyloid deposition. JAMA 2017;317:1443–1450. [DOI] [PMC free article] [PubMed] [Google Scholar]
- 12.Kemppainen N, Johansson J, Teuho J, et al. Brain amyloid load and its associations with cognition and vascular risk factors in FINGER Study. Neurology 2018;90:e206–e213. [DOI] [PubMed] [Google Scholar]
- 13.Langbaum JB, Chen K, Launer LJ, et al. Blood pressure is associated with higher brain amyloid burden and lower glucose metabolism in healthy late middle-age persons. Neurobiol Aging 2012;33:827.e11–827.e19. [DOI] [PMC free article] [PubMed] [Google Scholar]
- 14.Moran C, Beare R, Phan TG, et al. Type 2 diabetes mellitus and biomarkers of neurodegeneration. Neurology 2015;85:1123–1130. [DOI] [PMC free article] [PubMed] [Google Scholar]
- 15.Nagga K, Gustavsson AM, Stomrud E, et al. Increased midlife triglycerides predict brain beta-amyloid and tau pathology 20 years later. Neurology 2018;90:e73–e81. [DOI] [PMC free article] [PubMed] [Google Scholar]
- 16.Nation DA, Edland SD, Bondi MW, et al. Pulse pressure is associated with Alzheimer biomarkers in cognitively normal older adults. Neurology 2013;81:2024–2027. [DOI] [PMC free article] [PubMed] [Google Scholar]
- 17.Rabin JS, Yang HS, Schultz AP, et al. Vascular risk and beta-amyloid are synergistically associated with cortical tau. Ann Neurol 2019;85:272–279. [DOI] [PMC free article] [PubMed] [Google Scholar]
- 18.Roberts RO, Knopman DS, Cha RH, et al. Diabetes and elevated hemoglobin A1c levels are associated with brain hypometabolism but not amyloid accumulation. J Nucl Med 2014;55:759–764. [DOI] [PMC free article] [PubMed] [Google Scholar]
- 19.Willette AA, Johnson SC, Birdsill AC, et al. Insulin resistance predicts brain amyloid deposition in late middle-aged adults. Alzheimers Dement 2015;11:504–510 e501. [DOI] [PMC free article] [PubMed] [Google Scholar]
- 20.Lo RY, Jagust WJ; Alzheimer's Disease Neuroimaging Initiative. Vascular burden and Alzheimer disease pathologic progression. Neurology 2012;79:1349–1355. [DOI] [PMC free article] [PubMed] [Google Scholar]
- 21.Walters MJ, Sterling J, Quinn C, et al. Associations of lifestyle and vascular risk factors with Alzheimer's brain biomarker changes during middle age: a 3-year longitudinal study in the broader New York City area. BMJ Open 2018;8:e023664. [DOI] [PMC free article] [PubMed] [Google Scholar]
- 22.Bos I, Vos SJB, Schindler SE, et al. Vascular risk factors are associated with longitudinal changes in cerebrospinal fluid tau markers and cognition in preclinical Alzheimer's disease. Alzheimers Dement 2019;15:1149–1159. [DOI] [PMC free article] [PubMed] [Google Scholar]
- 23.Musiek ES, Holtzman DM. Three dimensions of the amyloid hypothesis: time, space and “wingmen.” Nat Neurosci 2015;18:800–806. [DOI] [PMC free article] [PubMed] [Google Scholar]
- 24.Pletnikova O, Kageyama Y, Rudow G, et al. The spectrum of preclinical Alzheimer's disease pathology and its modulation by ApoE genotype. Neurobiol Aging 2018;71:72–80. [DOI] [PubMed] [Google Scholar]
- 25.Pletnikova O, Rudow GL, Hyde TM, et al. Alzheimer lesions in the Autopsied brains of people 30 to 50 years of age. Cogn Behav Neurol 2015;28:144–152. [DOI] [PMC free article] [PubMed] [Google Scholar]
- 26.Knopman DS, Roberts R. Vascular risk factors: imaging and neuropathologic correlates. J Alzheimers Dis 2010;20:699–709. [DOI] [PMC free article] [PubMed] [Google Scholar]
- 27.Albert M, Soldan A, Gottesman R, et al. Cognitive changes preceding clinical symptom onset of mild cognitive impairment and relationship to ApoE genotype. Curr Alzheimer Res 2014;11:773–784. [DOI] [PMC free article] [PubMed] [Google Scholar]
- 28.Morris JC. The Clinical Dementia Rating (CDR): current version and scoring rules. Neurology 1993;43:2412–2414. [DOI] [PubMed] [Google Scholar]
- 29.Albert MS, DeKosky ST, Dickson D, et al. The diagnosis of mild cognitive impairment due to Alzheimer's disease: recommendations from the National Institute on Aging-Alzheimer's Association workgroups on diagnostic guidelines for Alzheimer's disease. Alzheimers Dement 2011;7:270–279. [DOI] [PMC free article] [PubMed] [Google Scholar]
- 30.McKhann GM, Knopman DS, Chertkow H, et al. The diagnosis of dementia due to Alzheimer's disease: recommendations from the National Institute on Aging-Alzheimer's Association workgroups on diagnostic guidelines for Alzheimer's disease. Alzheimers Dement 2011;7:263–269. [DOI] [PMC free article] [PubMed] [Google Scholar]
- 31.Moghekar A, Goh J, Li M, Albert M, O'Brien RJ. Cerebrospinal fluid Abeta and tau level fluctuation in an older clinical cohort. Arch Neurol 2012;69:246–250. [DOI] [PMC free article] [PubMed] [Google Scholar]
- 32.Sperling RA, Aisen PS, Beckett LA, et al. Toward defining the preclinical stages of Alzheimer's disease: recommendations from the National Institute on Aging-Alzheimer's Association workgroups on diagnostic guidelines for Alzheimer's disease. Alzheimers Dement 2011;7:280–292. [DOI] [PMC free article] [PubMed] [Google Scholar]
- 33.Laird NM, Ware JH. Random-effects models for longitudinal data. Biometrics 1982;38:963–974. [PubMed] [Google Scholar]
- 34.Mormino EC, Betensky RA, Hedden T, et al. Synergistic effect of beta-amyloid and neurodegeneration on cognitive decline in clinically normal individuals. JAMA Neurol 2014;71:1379–1385. [DOI] [PMC free article] [PubMed] [Google Scholar]
- 35.Vos SJ, Xiong C, Visser PJ, et al. Preclinical Alzheimer's disease and its outcome: a longitudinal cohort study. Lancet Neurol 2013;12:957–965. [DOI] [PMC free article] [PubMed] [Google Scholar]
- 36.Rosano C, Aizenstein HJ, Wu M, et al. Focal atrophy and cerebrovascular disease increase dementia risk among cognitively normal older adults. J Neuroimaging 2007;17:148–155. [DOI] [PubMed] [Google Scholar]
- 37.Vemuri P, Lesnick TG, Przybelski SA, et al. Vascular and amyloid pathologies are independent predictors of cognitive decline in normal elderly. Brain 2015;138:761–771. [DOI] [PMC free article] [PubMed] [Google Scholar]
- 38.Soldan A, Pettigrew C, Zhu Y, et al. White matter hyperintensities and CSF Alzheimer disease biomarkers in preclinical Alzheimer disease. Neurology 2020;94:e950–e960. [DOI] [PMC free article] [PubMed] [Google Scholar]
- 39.Kapasi A, DeCarli C, Schneider JA. Impact of multiple pathologies on the threshold for clinically overt dementia. Acta Neuropathol 2017;134:171–186. [DOI] [PMC free article] [PubMed] [Google Scholar]
- 40.Troncoso JC, Zonderman AB, Resnick SM, Crain B, Pletnikova O, O'Brien RJ. Effect of infarcts on dementia in the Baltimore Longitudinal Study of Aging. Ann Neurol 2008;64:168–176. [DOI] [PMC free article] [PubMed] [Google Scholar]
- 41.Gustavsson AM, van Westen D, Stomrud E, Engstrom G, Nagga K, Hansson O. Midlife atherosclerosis and development of Alzheimer or vascular dementia. Ann Neurol 2020;87:52–62. [DOI] [PMC free article] [PubMed] [Google Scholar]
- 42.Ahtiluoto S, Polvikoski T, Peltonen M, et al. Diabetes, Alzheimer disease, and vascular dementia: a population-based neuropathologic study. Neurology 2010;75:1195–1202. [DOI] [PubMed] [Google Scholar]
- 43.Arvanitakis Z, Schneider JA, Wilson RS, et al. Diabetes is related to cerebral infarction but not to AD pathology in older persons. Neurology 2006;67:1960–1965. [DOI] [PubMed] [Google Scholar]
- 44.Wang LY, Larson EB, Sonnen JA, et al. Blood pressure and brain injury in older adults: findings from a community-based autopsy study. J Am Geriatr Soc 2009;57:1975–1981. [DOI] [PMC free article] [PubMed] [Google Scholar]
- 45.Chuang YF, An Y, Bilgel M, et al. Midlife adiposity predicts earlier onset of Alzheimer's dementia, neuropathology and presymptomatic cerebral amyloid accumulation. Mol Psychiatry 2016;21:910–915. [DOI] [PMC free article] [PubMed] [Google Scholar]
- 46.Petrovitch H, White LR, Izmirilian G, et al. Midlife blood pressure and neuritic plaques, neurofibrillary tangles, and brain weight at death: the HAAS: Honolulu-Asia Aging Study. Neurobiol Aging 2000;21:57–62. [DOI] [PubMed] [Google Scholar]
- 47.Chui HC, Zheng L, Reed BR, Vinters HV, Mack WJ. Vascular risk factors and Alzheimer's disease: are these risk factors for plaques and tangles or for concomitant vascular pathology that increases the likelihood of dementia? An evidence-based review. Alzheimers Res Ther 2012;4:1. [DOI] [PMC free article] [PubMed] [Google Scholar]
- 48.Attems J, Jellinger KA. The overlap between vascular disease and Alzheimer's disease: lessons from pathology. BMC Med 2014;12:206. [DOI] [PMC free article] [PubMed] [Google Scholar]
- 49.Iadecola C. The overlap between neurodegenerative and vascular factors in the pathogenesis of dementia. Acta Neuropathol 2010;120:287–296. [DOI] [PMC free article] [PubMed] [Google Scholar]
- 50.Jack CR Jr, Bennett DA, Blennow K, et al. A/T/N: an unbiased descriptive classification scheme for Alzheimer disease biomarkers. Neurology 2016;87:539–547. [DOI] [PMC free article] [PubMed] [Google Scholar]
Associated Data
This section collects any data citations, data availability statements, or supplementary materials included in this article.
Data Availability Statement
Anonymized data used in the analyses presented in this report are available on request from qualified investigators (biocard-se.org).


